The role of population on economic
growth and development: evidence from
developing countries
Atanda, Akinwande A. and Aminu, Salaudeen B. and Alimi,
Olorunfemi Y.
Datatric Research Consulting, Nigeria.
4 March 2012
Online at
https://mpra.ub.uni-muenchen.de/37966/
1
The Role of Population on Economic Growth and
Development: Evidence from Developing
Countries
ATANDA, Akinwande Abdulmaliq
Strategic R&D Unit,
Datatric Research Consulting, Nigeria.
datatricng@gmail.com
AMINU, Salaudeen Babatunde
Financial and Marketing Research Unit,
Globafrique Consulting, Nigeria.
princeaminu@yahoo.com
ALIMI, Olorunfemi Y
Associate Research Consultant,
Datatric Research Consulting, Nigeria.
2
The Role of Population on Economic Growth
and Development: Evidence from Developing
Countries
Atanda, A. A., Aminu, S. B., & Alimi, O. Y.
Abstract
The precise relationship between population growth and per capita income has been inconclusive in the literature and the nexus has been found not clearly explain the determinants of rapid population growth in developing countries that lacks fertility control and management framework. This forms the rationale for this study to access the trend of factors that influence rapid population growth in developing countries between 1980 and 2010. This paper examined the comparative trend review of population growth determinants between developing countries (Bangladesh, Ethiopia, Indonesia, Mexico and Nigeria) and developed nations (Germany and United States). The trend analysis revealed that fertility rate, crude death rate, birth rate, mortality rate, and life expectancy are the major determinants of rapid population growth rate, while youth dependency ratio of young people below age 15 has also been attributed as one of the leading causes of population growth and growth threat in developing countries. However, the analysis further indicated that excluding Mexico from the Upper Middle Income group, developed economies (United State and Germany) with large population size have a higher real economic well-being as measured by the Real GNI per capita, compared with selected developing economies in the world. The study then proffered the need for population control framework and provision of essential infrastructures for the rapid growing population size in developing countries in order to enhance their welfare.
3
I. INTRODUCTION
The existing state of knowledge does not warrant any clear-cut generalization as to the effect of population growth on economic development in today's less developed areas. Some theoretical analyses argue that high population growth creates pressures on limited natural resources, reduces private and public capital formation, and diverts additions to capital resources to maintaining rather than increasing the stock of capital per worker. Others point to positive effects such as economies of scale and specialization, the possible spur to favourable motivation caused by increased dependency, and the more favourable attitudes, capacities, and motivations of younger populations compared with older ones. The actual evidence on the association between growth rates of population and per capita income does not point to any uniform conclusion, though the true relationship may be obscured in a simple two-variable comparison. None of this means that per capita income growth, currently and in the past, would have been the same if population growth rates had been markedly higher or lower (Easterlin, 1967).
Although, it is possible that the effect of population growth on economic development has been exaggerated, or that no single generalization is justified for countries differing as widely in growth rates, densities, and income levels as do today's less developed areas. Clearly there is need for more extensive research on the actual trend and experience of developing nations comparatively to developed nations in the last three decades. Thus, forms the major rationale for this paper and consist the major thrust in assessing the trend of population level in relative to economic development and growth indicators of selected developing countries between 1980 and 2010.
II. DETERMINANTS OF RAPID POPULATION GROWTH
4
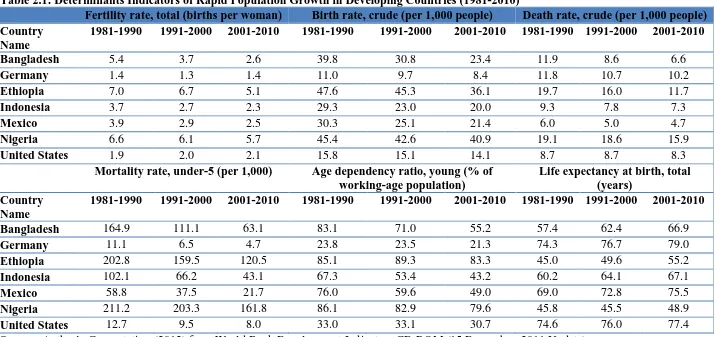
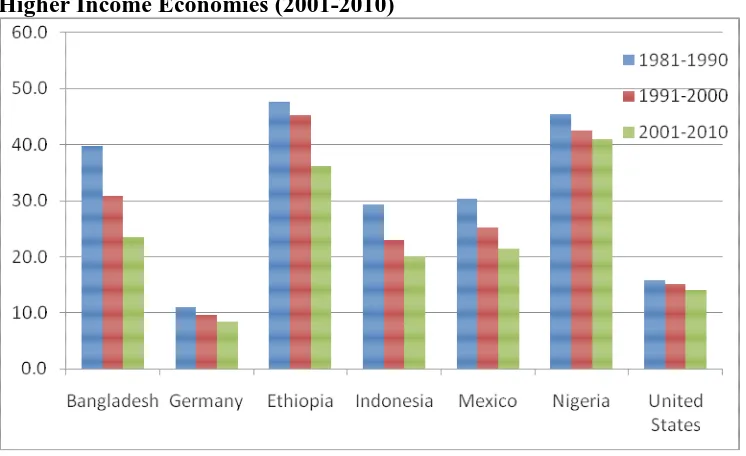
The table 2.1 and Figure 2.1-2.3 presents the fertility rate, birth rate, death rate, and under five mortality rate per 1,000 people. Also, the table 2.1 shows the age dependency ratio of young people to the total working age population (15-64 age), and the life of expectancy at birth. From, Table 2.1 and Figure 2.1, the total fertility rate that represents the number of children that would be born to a woman if she were to live to the end of her childbearing years and bear children in accordance with current age-specific fertility rates indicated higher rates in developing countries like Bangladesh, Ethiopia, Indonesia, Mexico and Nigeria compared to United States and Germany that recorded a lesser rate. This indicates that the fertility is one of the major contributing factors to observed level of developing countries population size relative to the developed nations. Also, the Table 2.2 and Figure 2.3 indicated the Crude birth rate which is the number of live births per 1,000 midyear population and the recorded estimates indicated that most of the developing countries birth rate has decreased steadily in the last three decades, despite this trend, the rate is more than the those recorded in the developed countries in the past three decades. The decrease might be as a result of child labour related complications often experienced by women in developing countries and as well as low health infrastructural facilities and these however reflected in the death rate trend. The Crude death rate that indicates the number of deaths per 1,000 midyear population as shown in Table 2.1 and Figure 2.3 revealed that all of the considered developing countries recorded a very high death rate mostly associated to health related diseases as a result of high poverty prevalence, unemployment, low literacy rate and low per capita income growth rate etc.
In addition, the Table 2.1 clearly indicate that most of the developing countries recorded a very high mortality rate, high age dependency ratio to working population and low life expectancy at birth compared to the considered developed nations with high improved health, low dependency rate and high life expectancy. These features however, characterized these countries being developing with relative low income.
5
Table 2.1: Determinants Indicators of Rapid Population Growth in Developing Countries (1981-2010)
Fertility rate, total (births per woman) Birth rate, crude (per 1,000 people) Death rate, crude (per 1,000 people) Country
Name
1981-1990 1991-2000 2001-2010 1981-1990 1991-2000 2001-2010 1981-1990 1991-2000 2001-2010
Bangladesh 5.4 3.7 2.6 39.8 30.8 23.4 11.9 8.6 6.6
Germany 1.4 1.3 1.4 11.0 9.7 8.4 11.8 10.7 10.2
Ethiopia 7.0 6.7 5.1 47.6 45.3 36.1 19.7 16.0 11.7
Indonesia 3.7 2.7 2.3 29.3 23.0 20.0 9.3 7.8 7.3
Mexico 3.9 2.9 2.5 30.3 25.1 21.4 6.0 5.0 4.7
Nigeria 6.6 6.1 5.7 45.4 42.6 40.9 19.1 18.6 15.9 United States 1.9 2.0 2.1 15.8 15.1 14.1 8.7 8.7 8.3
Mortality rate, under-5 (per 1,000) Age dependency ratio, young (% of working-age population)
Life expectancy at birth, total (years)
Country Name
1981-1990 1991-2000 2001-2010 1981-1990 1991-2000 2001-2010 1981-1990 1991-2000 2001-2010
6
Figure 2.1: Plot of Fertility Rate of Selected Developing Countries and Higher Income Economies (2001-2010)
[image:7.595.73.446.431.659.2]7
Figure 2.3: Plot of Death Rate of Selected Developing Countries and Higher Income Economies (2001-2010)
III. GROWTH AND DEVELOPMENT EFFECTS OF POPULATION GROWTH IN DEVELOPING COUNTRIES: STYLIZED FACTS
3.1 World Population and Economic Well-Being: A Glance Review
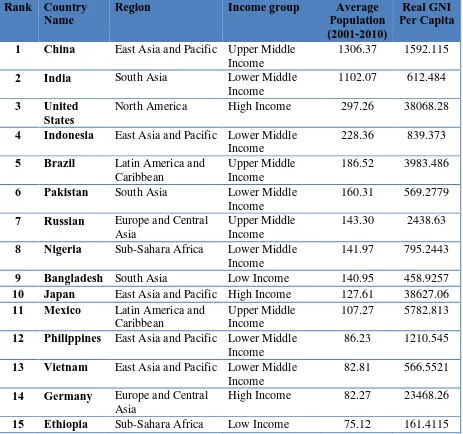
This phase of the paper presents and assesses the trend of population distribution relative to economic development indicators for selected countries across major economic regions in the world. Firstly, developing countries were selected from the top 15 list of most populous country in the world shown in Table 1 for comparative analysis. Developing countries were picked on the basis of their low income group across Sub-Saharan Africa, South Asia, East Asia and Pacific, and Latin American and Caribbean. Also, United States and Germany were considered as the benchmark or base economies for comparative purpose.
8
[image:9.595.69.532.246.680.2]America that is ranked third in 2001- 2010, while the population well-being as measured by Real GNI per capita in the last decade is 2.2% of United States per capita income that stood at $38,068.28; Nigeria being the 8th World largest economy in population size is also a Lower Middle Income that inhabit an average of 141.97million people between 2001 and 2010 and with an average GNI per capita income of $795.22 which is 2.1% of United States Standard of Living; Bangladesh with an average population size of 140.95million ranked as the 9th in
Table 1: Top 15 Most Populated Countries in the World between 2001 and 2010
Rank Country Name
Region Income group Average Population (2001-2010)
Real GNI Per Capita
1 China East Asia and Pacific Upper Middle Income
1306.37 1592.115
2 India South Asia Lower Middle Income
1102.07 612.484
3 United States
North America High Income 297.26 38068.28
4 Indonesia East Asia and Pacific Lower Middle Income
228.36 839.373
5 Brazil Latin America and Caribbean
Upper Middle Income
186.52 3983.486
6 Pakistan South Asia Lower Middle Income
160.31 569.2779
7 Russian Europe and Central Asia
Upper Middle Income
143.30 2438.63
8 Nigeria Sub-Sahara Africa Lower Middle Income
141.97 795.2443
9 Bangladesh South Asia Low Income 140.95 458.9257 10 Japan East Asia and Pacific High Income 127.61 38627.06 11 Mexico Latin America and
Caribbean
Upper Middle Income
107.27 5782.813
12 Philippines East Asia and Pacific Lower Middle Income
86.23 1210.545
13 Vietnam East Asia and Pacific Lower Middle Income
82.81 566.5521
14 Germany Europe and Central Asia
High Income 82.27 23468.26
9
Source: Author’s Computation (2012) from World Bank Development Indicators CD-ROM (15 December, 2011 Update)
the World in the last decade is a Low Income economy and with a average economic well-being proxy by the GNI per capita of $458.93 which share is 1.2% and 1.9% of United State and Germany per capita income respectively; Mexico is an Upper Middle Income country from the Latin America and Pacific region inhabit an average population size of 107.27million with GNI per capita of $5,782.8 that represents 15.2% and 24.6% of United State and Germany per capita income respectively; and Ethiopia is a Low Income country with a total average population size of 75.12million in the last decade and with a relative average economic well being measured by GNI per capita of $161.41 that takes 0.42% and 0.69% of United State and Germany per capita income respectively.
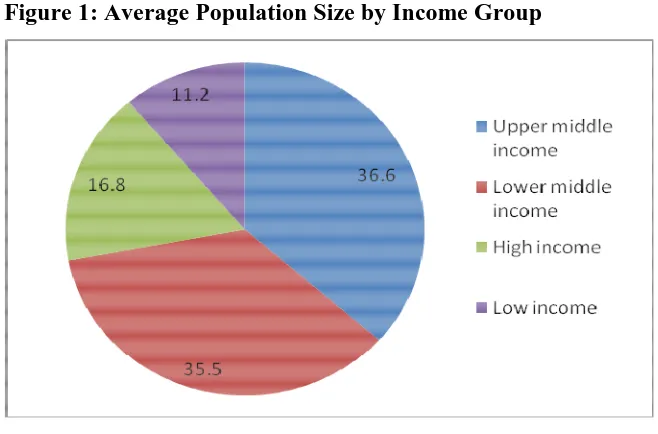
[image:10.595.70.399.504.721.2]Also, the average distribution of the World population across income group between 2001 and 2010 is presented in Figure 1. The pie chart revealed that the Upper Middle Income has the share of the World population in the last decade that stood at 36.6% of 6,497million, followed by the Lower Middle Income group that inhabit 35.5% of the World population. Likewise, the High Income group within the range of $12,276 higher GNI per capita represents 16.8% of the global population size, while the Low Income group with a range of $1,006 - $3,975 has the least share of the world population that stood at 11.2%. This indicates that majority of the world population falls within the lower income group.
10
3.2 Economic Well-Being and Population Size of Developing Countries: The Benchmark Analysis
[image:11.595.67.458.254.428.2]In order to precisly explain the relative average share of developing countries economic wel-beings of the people and total population size to selected developed economies with higher income such as United States and Germany the Table 2, Figure 2 and Figure 3 are presented for critical comparative review.
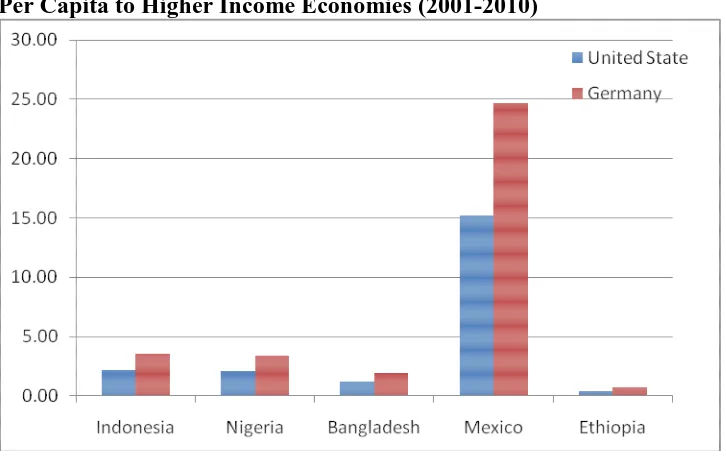
Table 2: Average Share of Selected Developing Countries Real GNI Per Capita and Population Size to Higher Income Economies (2001-2010)
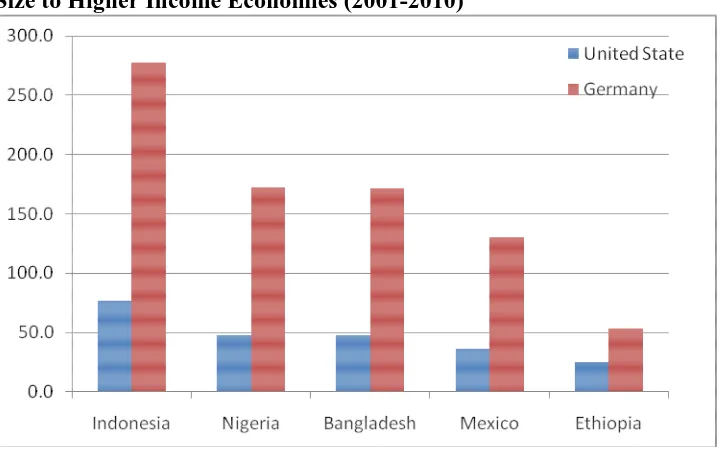
Real GNI Per Capita Population Share United States Germany United States Germany Indonesia 2.20 3.58 76.8 277.6 Nigeria 2.09 3.39 47.8 172.6 Bangladesh 1.21 1.96 47.4 171.3 Mexico 15.19 24.64 36.1 130.4 Ethiopia 0.42 0.69 25.3 52.9 Source: Author’s Computation (2012) from World Bank Development Indicators CD-ROM (15 December, 2011 Update)
[image:11.595.73.436.497.725.2]11
[image:12.595.75.436.272.498.2]From Figure 2, Mexixo is found to have the higest share of United States and Germany GNI per capita that stood at 15.19% and 24.64% respectively. The sebsequent lead taken by Indoniesia and Nigeria for the share of United State and Germany economic status. Likewsie, the Figure 3 that plot the share of population size relative of developed economies inidcated that despite Mexico higer share of developed economies (United State and Germany) per capita, it has least share of United State and Germany population sizes. The Upper Middle Income country has a relative small average population of 36.1% of United States and a higer population size of 130.4% of Germany’s size.
Figure 3: Plot of Share of Selected Developing Countries Population Size to Higher Income Economies (2001-2010)
Also, Indonesia has the highest of share of United States and Germany population size but the country population is relatively higher than Germany, while Nigeria and Bangladesh have similar population share of United States and Germany’s total population size. This inidcates that Nigeria and Bangladesh have relatively close population size but wide economic well-being share of the developed economies (United State and Germany) between 2001 and 2010. Moreover, Ethiopia was found to have the least population size of the developed economies (United State and Germany) and this however reflected in the country real GNI per capita that recorded the least share of the benchmark countries between 2001 and 2010.
12
have a higher real economic well-being as measured by the Real GNI per capita in 2001-2010, compared to selected developing economies in the world.
3.3 Population Structure of Developing Economies: Composition Analysis
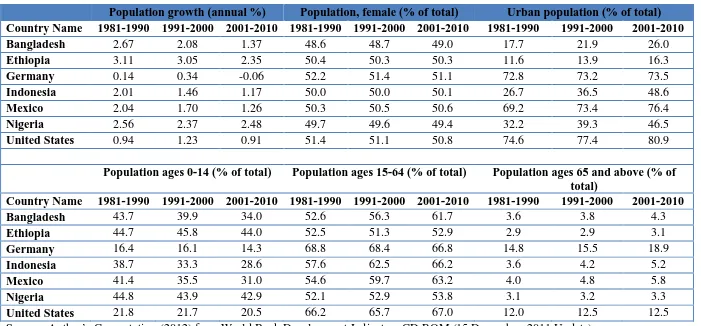
[image:13.595.74.459.381.615.2]The structure and composition of Bangladesh, Ethiopia, Indonesia, Mexico and Nigeria as the selected developing countries within the top 15 population rank, and Germany and United States as the considered benchmark or developed economies within the top 15 rank are critically examined as presented in Table 3 and Figure 4-9. The composition consists of three decades total population growth, population proportion of females, urban population size relative to rural, and the age structure of the population. The age covers the young group, economic active or working population group and old age population group within the respective age range of 0-14years, 15-64 years, and 65 and above years.
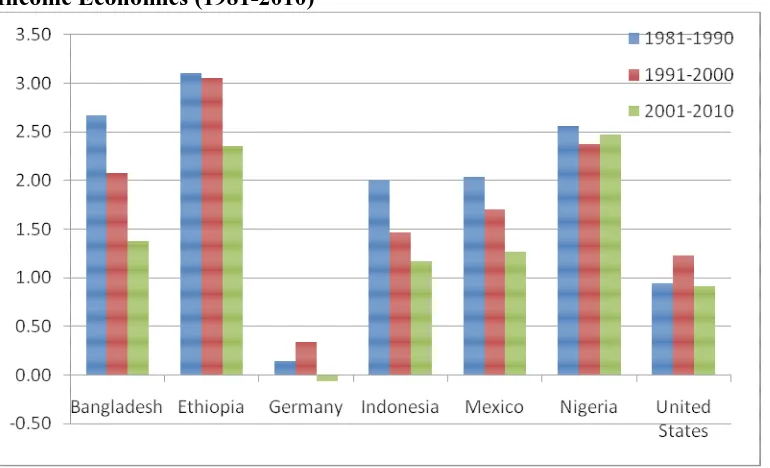
Figure 4: Plot of Average Population Growth Rate of Developing Countries and Higher Income Economies (1981-2010)
14
Table 3: Composition and Structure of Developing Economies Population Level (1981-2010)
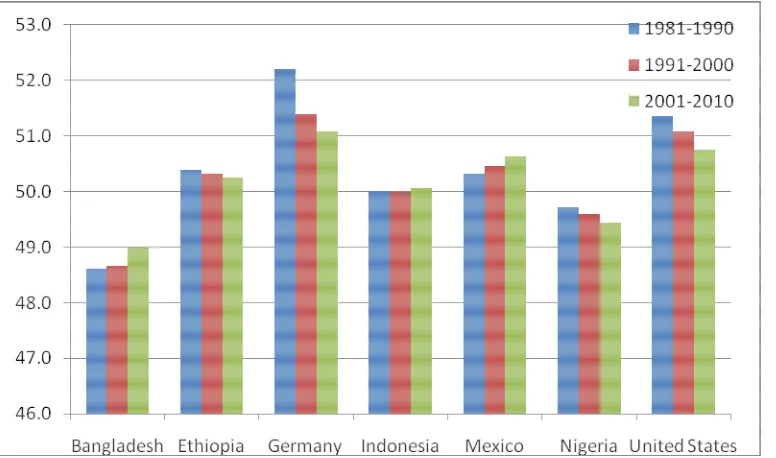
Population growth (annual %) Population, female (% of total) Urban population (% of total) Country Name 1981-1990 1991-2000 2001-2010 1981-1990 1991-2000 2001-2010 1981-1990 1991-2000 2001-2010 Bangladesh 2.67 2.08 1.37 48.6 48.7 49.0 17.7 21.9 26.0 Ethiopia 3.11 3.05 2.35 50.4 50.3 50.3 11.6 13.9 16.3 Germany 0.14 0.34 -0.06 52.2 51.4 51.1 72.8 73.2 73.5 Indonesia 2.01 1.46 1.17 50.0 50.0 50.1 26.7 36.5 48.6 Mexico 2.04 1.70 1.26 50.3 50.5 50.6 69.2 73.4 76.4 Nigeria 2.56 2.37 2.48 49.7 49.6 49.4 32.2 39.3 46.5 United States 0.94 1.23 0.91 51.4 51.1 50.8 74.6 77.4 80.9
Population ages 0-14 (% of total) Population ages 15-64 (% of total) Population ages 65 and above (% of total)
15
Figure 5: Plot of % Female Population of Developing Countries and Higher Income Economies (1981-2010)
[image:16.595.74.462.120.349.2]16
respectively. This indicates that most of the population of the low income developing countries dwells in the rural areas despite the high level of rural-urban migration.
Figure 7: Plot of Population Ages 0-14 of Developing Countries and Higher Income Economies (1981-2010)
[image:17.595.76.459.176.413.2]17
Figure 8: Plot of Population Ages 15-64 of Developing Countries and Higher Income Economies (1981-2010)
It observed from Figure 8 that the considered developing countries have majority of its population within the economic active or working group (15-64 years) in the last two decades and have also recorded a considerable increase but not to the peak that the developed
[image:18.595.74.459.114.345.2] [image:18.595.73.465.476.706.2]18
economies (Germany and United States) have maintained for the past three decades. Moreover, despite the rapid population growth of the economic active group in developing countries, there is still less that engages in productive activities as a result of high unemployment level, low industrial investment and low human capital investments.
Likewise, majority of the developing countries have less proportion of old age (65 and above) population group compared to developed nations (Germany and United States) that recorded over 12% of its population within the old age bracket in the last three decades. Comparatively, in the last three decades (1981-2010) Bangladesh, Ethiopia, Indonesia, Mexico, and Nigeria respectively have 3.9%, 3.0%, 4.3%, 4.9%, and 3.2% of its total population within the old age group in relative to United States and Germany as developed and higher income economies that recorded 12.3% and 16.4% respectively over the last three decades.
IV. MITIGATION STRATEGY AND OUTLOOK
The trend review has revealed the causes and consequences of rapid population growth rate in selected developing countries (Bangladesh, Ethiopia, Indonesia, Mexico, and Nigeria) compared to some selected developed nations with higher income such among which are Germany and United States.
19
V. REFERENCES
Easterlin, R. (1967). Effects of population growth on the economic development of developing countries. The ANNALS of the American Academy of Political and Social Science
Vol. 369, No. 1, Pg.98-108.
Todaro, M. P. and S. C. Smith (2011). Economic Development. 11th Edition. United kingdom: England. Pearson Education Limited.