Munich Personal RePEc Archive
High Technology Products Exports by
India and China: A Constant Market
Share Analysis
Chatterjee, Rittwik and Chattopadhyay, Srobonti
Centre for Studies in Social Sciences, Calcutta, Indian Institute of
Management, Calcutta
28 November 2013
Online at
https://mpra.ub.uni-muenchen.de/51800/
High Technology Products Exports by India and China: A Constant Market Share
Analysis
Rittwik Chatterjee
Assistant Professor, CSSSC, Kolkata
And
Srobonti Chattopadhyay
Post Doctoral Research Fellow, IIM, Calcutta
Abstract
With more and more globalization, international trade has expanded to a large extent. This is also
observable for trades in high technology products. India and China have emerged as two major exporters
of high technology products in the world today. This paper makes an attempt to understand the various
dimensions of high technology products exports from these two countries through constant market share
(CMS) analysis and also the policy implications by looking at the various components of export growth
from the CMS analysis.
1. Introduction
In the era of increased globalization, the world has also witnessed a surge in the growth of
mechanization in industrial as well as domestic activities which has resulted in the flourishing of
technology products all over the world leading to an obvious increase in the demand for these
products. In a globalized world, with increased scope for international exchange, some countries
can and indeed are specializing in producing and exporting high technology products. It has been
observed that over the years, high technology product exports are being majorly taken over by
developing countries. There are many supportive evidences confirming this phenomenon in the
economics literature.
Mani (2000) observes that the international trade is growingly becoming trade in hi-tech
products. Through an analysis of consistent time series data on hi-tech products, Mani (2000)
shows that having been exporters of primary products earlier, the developing countries are now
transforming into exporters of manufactured products. He also shows that the share of exports of
developing countries have recorded phenomenal increases from 8 per cent in 1998 to 23 per cent
in 1997. However, Mani (2000) subsequently, by looking at net export figures rather than gross
export, infers that this increase in hi-tech product exports by developing countries is not “really
real”. He argues that the developing countries merely assemble components of high technology
products from their developed counterparts by using labour-intensive techniques and thus
produces the finished hi-tech products that they eventually export.
According to Shrolec (2005), the empirical literature confirms hi-tech products to be the fastest
growing segment of international trade with developing countries growingly becoming the major
exporters of such products. Shrolec (2005) makes an attempt to assess the relationship between
growth of exports and level of development of indigenous technological capabilities of the
developing countries. He analyses intra-product imports and then infers that the bulk of hi-tech
exports are actually attributable to “effect of increasingly international fragmentation of the
propensity to import electronics components accounts for the largest proportion of cross-country
differences in specialization in electronics exports rather than domestic technological
capabilities.
Sara, Jackson and Upchurch (2012) analyse the relationship between the technological
innovation and high-tech exports of a nation. They discuss the role of exports in growth of some
fast developing countries in recent years and their expansion of high-tech products. They observe
that export has served as the engine of growth in many fast growing countries, e.g. Malaysia,
Taiwan, South Korea etc. In this current era of global competition, countries maintain as well as
expand their share of export markets by developing the capability for competing successfully in
new, high productivity segments of industries. As a consequence, fast growing countries have
enhanced their share of hi-tech products in total exports. Their paper establishes that innovative
capability of a country is a significant determinant of the share of hi-tech products in total
exports of a country. Therefore, they suggest that countries should concentrate on improving
innovative capabilities if they want to make use of exports as their engine of growth, since
hi-tech products will constitute an increasing proportion of manufactured exports.
It is agreed upon by many economists that among the developing countries, the two countries
leading in terms of their potential to emerge as future world powers are India and China1.In this
paper we concentrate on the trends in exports of hi-tech products of these two countries. There
are a number of papers which deal with the issue of hi-tech products exports of these two
countries. We look at a few of them here for our purpose.
1Harris (2005) observes that Brazil, India and China have become world economic powers. Also, Bhat, Guha and
According to an IIFT study (2011) India’s exports have over time reflected a shift towards
medium and high technology products over low technology products. This study uses the
technological classification of trade in terms of high, medium and low based on the Standard
International Trade Classification (SITC), Revision 3, as adopted by the United Nations
Industrial Development Organization (UNIDO). This study suggests that the share of low
technology exports have come down from 33 per cent in 2004 to 28 per cent in 2008, while the
shares of medium and high technology exports have increased from 14 to 17 per cent and from 5
per cent to 7 per cent respectively. In terms of composition of hi-tech exports, pharmaceutical
products constituted a large proportion. Other high and medium technology items that have
shown maximum dynamism include power generating machines, telecom and sound equipment
and scientific instruments in the first category and chemicals, machinery and equipment and
transport equipment in the second category. The study also suggests that India’s technology
intensive exports reflect increased investment in R&D.
Desai (2011) also observes that India’s technology intensive exports have experienced a rapid
growth over the last two decades. He makes an attempt to focus on India’s changing pattern of
technology intensive exports “in a systemic perspective and on increasing significance of the
linkages between National and International Systems of Innovation”. The paper tries to analyse
the structure of India’s technology intensive exports along with its innovation processes. It also
investigates whether structure of technology intensive exports bears any relationship with
economic development and whether low, medium and hi-tech products are affected differently
by technological learning. The paper argues that export performance can improve through
enhancement of technological capabilities which in turn develop by technological learning which
also through interactive learning processes of international S&T collaboration along with inward
and outward foreign direct investments.
Regarding China’s hi-tech product exports, however, there are different opinions. The trade
statistics reflect a rise in China’s hi-tech product exports. For example, a European Commission
report suggests that, China has recorded a higher amount of hi-tech exports than the U.S.A. or
the EU2 and thus emerged as the largest exporter of hit-tech products in the world. Also,
according to the U.S. Census Bureau data, the U.S.A. has consistently run a trade deficit with
China in advanced products since 2002 which reached a record high in 20103.According to
Frangos (2013)4 China has been increasing exports in industries as varied as computers, car
parts, high technology lamps and optical-surgical equipments. Frangos (2013) also quotes Royal
Bank of Scotland Economist Louis Kujis who states that Chinese employment in higher value
industries e.g. electrical and communications equipment production has leaped since 2008 now
exceeding employment in textiles, garments and leather making. Thus China’s shifting towards
production of hi-tech products which are fueling its export growth.
The observation of a surge in China’s hi-tech exports is criticized by Xing (2012). According to
Xing (2012) PRC (People’s Republic of China) Customs classifies trade into two major
categories e.g. processing trade and ordinary trade. Import of parts and components as
intermediate inputs, processing and assemblage of these intermediate inputs into finished
products and re-export of these finished products into global markets, constitute the processing
trade. Both imported as well as domestically produced parts and components are used in
2Xing (2012)
3ibid
processed exports. The domestic value added to exports is determined by the share of
domestically produced contents. Xing (2012) suggests that due to lack of technological
advantage, since 1990s, the processing trade has become the major form of hi-tech product
export from China. Assemblage of parts and components into finished products only requires
low-skilled labour and thus is no different from manufacturing or any other labour intensive
commodities. Therefore, Xing (2012) argues that the contribution of the Chinese workers is not
in advanced technology, but labour. Hence hi-tech products produced from majorly imported
components should be excluded from the hi-tech product category and be rather termed, as Xing
(2012) calls it, “assembled hi-tech” product category.
With this backdrop, this paper makes an attempt to examine whether India and China are indeed
experiencing a rise in their exports of hi-tech products and if so then what factors are
contributing to such a phenomenon. For this we resort to the constant market shares (CMS)
analysis. CMS analysis “is a technique for analysing trading patterns and trends for the purpose
of policy formulation.”5 It “compares the actual export growth performance of a country with the
performance that would have been achieved if the country had maintained its exports relative to
some standard”6.Thus this method intends to throw some light on the “reasons underlying a
country’s comparative export performances”7. For comparison, this method requires to have a
standard. This standard may be “the world or the set of similar or closely competitive
countries”8. Total exports are categorized in terms of product type and country of destination.
5Ahmadi-Esfahani (2006)
6Ahmadi-Esfahani and Anderson (2006)
7ibid.
This method is mostly used to understand whether a country’s export performance vis-à-vis other
countries is attributable to changing market shares or changes in the global trends in demand. A
country’s export share might grow in line with its major competitors or the country’s
comparative performance is might be attributable to its location in high growth regions or its
specialization in high growth products. The first effect is termed as the scale effect, while the
second and third are termed as the regional and product effects respectively. The CMS method
aims at answering whether a country’s comparative export performances is due to scale effects,
regional effects, product effects or competitive gains in individual markets.
The paper is organized as follows: section 2, 3 and 4 discuss the overall trade dynamics of the
world, India and China respectively in the high technology products sector, section 5 makes a
comparison between the overall trade dynamics of India and China for the high technology
products, section 6 briefly describes the Constant Market Share (CMS) analysis to understand the
dynamics of exports changes, section 7 elaborates the CMS analysis for the high technology
products exports for India and China, section 8 makes a comparison of the findings through
application of the CMS analysis on India and China and finally, section 9 concludes the paper
summarizing the findings briefly and discussing policy implications.
2. Overall Trade Dynamics
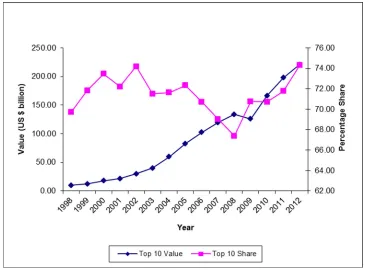
The following Figure 1 shows the total world export of high technology products during
1998-2012. As is evident, the total world export of high technology products has reflected a rising
trend over this period although it had declined in 2009 (possibly as an outcome of the financial
meltdown). The compound annual growth rate (CAGR) of world export of high tech products
during this period is 7.38. However, as reflected in Figure 2 that depicts the movement in share
note here that the trend in the share of high technology products exports in total exports depends
on both the levels of high technology products exports as well as total exports. As can be
observed from Figure 2, the share of high technology products export in total exports has
increased during 1998-2000 reaching a maximum in 2000. It is interesting to note that in 2009
the share of high technology products export in total exports has increased slightly; which is
indicating that the financial meltdown was unable to hit the export of high technology products
[image:9.612.104.512.307.532.2]as badly as it hit the exports of other commodities.
Figure 1: Trend in World’s Export of High Technology Products
Source: Calculated from data obtained from WITS database
Figure 2: Trend in the Share of World’s Export of High Technology Products in Total
Source: Calculated from data obtained from WITS database
3. India’s Trade Dynamics
In this section we look at India’s trade dynamics for the period 1998-2012. The following Figure
3 shows the trends in both total export as well as high technology products export for the
concerned period. It is observed that during 1998-2008, both the total and the high technology
exports reflect a rising trend. In 2009, although there is a slight decline in total exports, however,
the high technology products exports have sharply increased; this explains the sudden jump in
the year 2009 in the share of high technology products exports of India in Figure 4. Also in
contrast to the world economy, the export of high technology products from India has increased
in the time of financial crisis. But for high technology products exports, India experienced the
effect of the crisis after a year. Overall the high technology products export share of India shows
slightly upward trend during this period. During 2010, there is a decline in high technology
products exports while the total exports have increased. After that both reflect similar trends. The
for the export of high technology products for the same period is 18.24. Thus India reflects a
higher CAGR for exports of high technology products as compared to the CAGR for total
exports, and also, we observe that during 2009, the year of global financial meltdown, there has
been an increased demand for India’s high technology products exports. Both these factors
suggest that India should create incentives in order to boost its production and exports of high
technology products further in order to exploit its prospect in the high technology products sector
[image:11.612.123.490.304.569.2]in a better manner.
Figure 3: Trend in India’s Total and High Technology Export
Source: Calculated from data obtained from WITS database
Source: Calculated from data obtained from WITS database
The top ten destinations of high technology products exports for India are United States, United
Arab Emirates, Netherlands, Brazil, Germany, China, Singapore, Nigeria, Russian Federation,
and United Kingdom. From the following Figure 5 it becomes clear that although the total value
of high technology products export from India to its top ten destinations has increased over the
years, the same does not hold true for the share of high technology products exports in total
[image:12.612.114.484.82.328.2]exports.
Source: Calculated from data obtained from WITS database
The compound annual growth rates (CAGR) of exports for these countries during the concerned
period are United States 16.52, United Arab Emirates 29.93, Netherlands 15.55, Brazil 24.42,
Germany 13.99, China 19.60, Singapore 15.07, Nigeria 24.32, Russian Federation 25.65, and
United Kingdom 13.40. As can be observed from Figure 6, the US has consistently been the top
most export destination for high technology products followed by UAE as the second top most
destination. Observing the CAGR we find that India’s exports of high technology products is
increasing at a faster rate to destination countries like UAE, Russian Federation, Brazil and
Nigeria as compared to the other destinations; thus the UAE and the Russian Federation may
become the future top most destinations for Indian high technology products exports.
Considering the high technology products export figures for 2012, China is observed to be
holding the sixth rank among the top ten destinations for Indian high technology products
Figure 6: Trend in India’s High Technology Export to Its Top 10 Destinations
Source: Calculated from data obtained from WITS database
4. China’s Trade Dynamics
The following Figure 7 and Figure 8 capture China’s trade dynamics. For China, the directions
of movement in the values of high technology product exports and total exports are very similar
during 1998-2012. The CAGR for high technology products exports is 24.31 and that for total
exports is 18.79. Thus China reflects a higher CAGR for high technology products exports as
compared to total exports, thus implicating the high technology products sector to hold great
trade potential for China.
Source: Calculated from data obtained from WITS database
Source: Calculated from data obtained from WITS database
The top ten destinations for China’s high technology products exports consist of Hong Kong
(China), United States, Korea Republic, Japan, Netherlands, Germany, Mexico, India, Thailand
and Brazil. The CAGR of high technology products exports of China for these countries for the
concerned time period are Hong Kong (China) 27.49, United States 21.16, Korea Republic
32.04, Japan 18.69, Netherlands 23.79, Germany 20.70, Mexico 34.48, India 31.55, Thailand
26.60 and Brazil 29.78. As can be observed that India’s exports of high technology products
from China is increasing very rapidly, indicating that in future India may become one of the top
[image:16.612.123.492.376.646.2]importers of high technology products for China.
Figure 9: Trend in China’s Aggregate High Technology Export to Its Top 10 Destinations
Source: Calculated from data obtained from WITS database
Source: Calculated from data obtained from WITS database
5. Comparison of Overall Trade Dynamics of India and China
Looking at the overall trade dynamics for India and China, we observe that for China, the total
export and the high technology products exports move along very similar paths during
1998-2012, whereas for India, the same holds true except for the year 2009. For this year there has
been an increase in high technology products exports although overall exports have declined
over time. China’s value of exports (evaluated in US $) to the world, overall as well as high
technology products, is also substantially higher than that of India. Also, China reflects a higher
CAGR (24.31) as compared to India (18.24) for high technology products exports during
1998-2012 thus indicating that China can potentially outcompete India in the export of high
Looking at the top ten destinations for high technology products exports for these two countries
during 1998-2012, we find that United States, Netherlands, Brazil and Germany show up as the
common destinations, although with different rankings with respect to the concerned countries.
For example, the USA is consistently the top most export destination for high technology
products with respect to India and the volume of export to USA is significantly higher than that
to United Arab Emirates, which is the second top most destination for Indian high technology
products exports. But USA ranks second among the top ten destinations for Chinese high
technology products exports, with Hong Kong, China topping the list. With respect to India,
Netherlands, Brazil and Germany respectively hold third, fourth and fifth ranks among the top
ten destinations for high technology products exports, while with respect to China, the same
countries rank fifth, sixth and tenth respectively. However, looking at the CAGR for high
technology products exports to these common destinations, we observe that the CAGR of high
technology products exports from India to United States is 16.52, Netherlands 15.55, Brazil
24.42, Germany 13.99, and that from China to United States is 21.16, Netherlands 23.79, Brazil
29.78 and Germany 20.70. Thus, China has a higher CAGR for high technology products
exports as compared to India to the common destinations. This implies that in future India might
lose these markets to China.
One interesting observation is that each of China and India shows up in the list of top ten
destinations for high technology products exports of the other. China ranks sixth among the top
ten destinations for Indian high technology products exports during the concerned period, while
India holds the eighth rank among the top ten export destinations for Chinese high technology
products exports. However, growth in India’s high technology products export to China is much
concerned CAGR figures); this is indicating that in future China’s position as a high technology
products importer for India may decline whereas India may become one of the top most export
destinations for China. This implies that in case of trade in high technology products, China is
likely to enjoy a more favourable terms of trade against India in future.
6. Constant Market Share Analysis to Understand the Dynamics of Export
Changes
Constant Market Share (CMS) analysis9 is a very useful tool for understanding and assessing the
changes in exports of a country. A change in demand for imports is evaluated through the
comparison of a constant market share and a changing market share. Several economic factors
are then identified to which the change in market share is attributed. Finally, the residual effect
of the changing market share is identified as the effect of change in competitiveness. CMS has
become a popular tool of analysis since it uses a very simple model that involves very easy
calculations using only trade data. Data on price and cost are required for calculating
competitiveness. However, price and cost data are handled internally in the reduced form CMS
model. The direct application of price and cost variables is done away with in the final formula
thus making the estimation process simpler, since it is very difficult to obtain price and cost data
for international trade. So the effects of competitiveness can be captured through using the data
on imports and percentage change in imports for a country.
The fundamental assumption of this analysis is that a country’s export share in a given market
should remain invariant over time. Three factors account for the difference between the actual
export growth from a country into a given market and the unchanging export share implied by
9The description of the CMS model in this section is inspired by and closely follows the description of CMS
the “constant market share” norm. These three factors are first, the effects of a general increase
in demand for imports in the given market; second, commodity composition; and third, effects of
competitiveness.
This model expresses the competitiveness term as negative or positive in order to make
adjustments for actual change in market share. In the CMS model, the competitiveness effect
calculates, to what extent, the macro share gain or loss of the country can be attributed to the sum
of gains and losses of market shares of individual products.
Where
: Exports of country A to country B
: Commodity exports of country A to country B
: Percentage increase in country B’s total imports from period to period
: Percentage increase in country B’s imports of commodity between period 0 and period
and
The right hand side can be divided into three components:
1. The general rise in country B’s total imports;
3. And unexplained residual indicating the difference between country A’s actual exports
increase to country B and the hypothetical increase if country A maintained its share of
exports of each commodity group in country B.
7. CMS India and China
In this section the CMS model has been experimented using the data on high tech product trade
for India and China. It evaluates the change in competitiveness comparing three periods, e.g.
1998-2002, 2002-2007 and 2007-2012 (treating the years 1998, 2002 and 2007 as period 0
respectively). If for a particular country in a specific year the data of import of high tech product
is not available then we substitute it by taking world export of that commodity in that particular
year to that country, assuming the import from World is equal to export of the world.
7.1CMS India
The calculated percentage values of the three components from the CMS model for India are
presented in the following Tables 1-11, for the world as a whole and the top ten destination
countries for high technology products exports. Table 1 shows that for the world as a whole the
components General Increase in Demand for Imports and Effects of Competitiveness have
remained positive for all the three periods, 1998-2002, 2002-2007 and 2007-2012, although its
value has declined during 2007-2012. The decline in general demand is likely to be a
consequence of the financial meltdown during 2008-2009. The effects of this meltdown have not
disappeared for many countries even after three years. Another reason for this decline may be
that either the World market is becoming saturated for India or some other countries have started
exporting similar products. So India needs to figure out the reasons for this decline and formulate
group. Both the Change in Commodity Composition component and the Effects of
Competitiveness component have declined during 2002-2007 and increased after that. The
Change in Commodity Composition component, however, remains negative throughout our
period of analysis. From the dataset used for our analysis we find that certain high technology
products, which India used to export in or till 2007 were no longer exported by this country in
2012, although it has started exporting some new high technology items in 2012. Thus the
negative sign may be due to the fact that the changes in India’s export items did not work
favourbaly for the country. The Effects of Competitiveness component, however, has remained
positive throughout and has reflected a continuous increase in its value thus indicating that India
[image:22.612.77.425.394.462.2]is quite competitive in the world market for high technology products exports.
Table 1: CMS India World
2002 2007 2012
General increase in demand for imports 39.67 68.36 8.38
Change in commodity composition -4.26 -22.94 -6.90
Effects of competitiveness 64.59 54.58 98.51
Source: Calculated from data obtained from WITS database
Table 2 shows that the component, General Increase in Demand for Imports, is negative for
1998-2002, but is positive for both 2002-2007 and 2007-2012 for Brazil, although it has declined
during 2007-2012. Looking at the growth rate figures for Brazil10, we find that during
1998-2002, Brazil’s growth rate had been quite low. During 2002-2007, the growth rate figures are
higher, reaching 6.1 per cent in 2007. During 2007-2012 growth rate declined again reaching 0.9
per cent in 2012. Thus the negative sign of the component General Increase in Demand for
Imports during 1998-2002 is very likely to be due to lower demand for imports arising from low
10 The growth rate figures for all the countries considered in this and the subsequent sections are available at
growth rates of Brazil’s GDP. The subsequent rise in the value of this component during
2002-2007 also can be linked to the higher levels of GDP growth rate during this period and the
following decline during 2007-2012, to the fall in growth rates during this period. The
component Change in Commodity Composition remains positive throughout, marking a decline
during 2002-2007 and then increasing during 2007-2012. The dataset used for our analysis here
suggests that certain high technology items that India used to export to Brazil in 2002, were not
exported in 2007 although some new high technology items India started exporting since 2007
which it never exported before. The decline in the Change in Commodity Composition
component suggests that this change in the export items did not contribute favourably to the level
of exports during 2002-2007. However, for many of the items that India started exporting since
2007, the level of exports increased remarkably by 2012. This is one possible reason for the
increase in the value of the Change in Commodity Composition component during 2007-2012.
The third component, Effects of Competitiveness remains positive during 1998-2002 and
2002-2007, although declining drastically during 2007-2012, and turns negative during 2007-2012
hence implying further decline in competitiveness of Indian high technology products for this
period. This implies that India is facing competition from other countries which export high
technology products to Brazil. The very fact that certain items which India started exporting to
Brazil from 2007 do not show up in India’s list of high technology items exported to Brazil in
2012, reflects that those items could not survive in the competition with the same type of
products exported by other countries. So India needs to address this issue and formulate policies
to make its high technology products exports more competitive in Brazil.
Table 2: CMS India Brazil
General increase in demand for imports -15.14 68.37 52.06
Change in commodity composition 24.88 14.84 58.42
Effects of competitiveness 90.26 16.80 -10.48
Source: Calculated from data obtained from WITS database
In Table 3 we observe that General Increase in Demand for Imports from China remains positive
throughout for all the concerned periods, though recording an increase during 2002-2007
followed by a substantial decline during 2007-2012. The growth rate figures for China show that
during 1998-2002, China’s GDP had been growing consistently reaching 9.1 per cent in 2002
from 7.8 per cent in 1998. This increasing trend continues during 2002-2007 reaching 14.2 per
cent in 2007. After that, however, there is a decline during 2007-2012, and the growth rate
reaches 7.8 per cent in 2012. Thus the increase in the General Increase in Demand for Imports
component during 2002-2007 and the subsequent decline in it during 2007-2012 are likely to be
the direct consequences of the respective increase and decline in China’s GDP growth rate
during 2002-2007 and 2007-2012. However, Change in Commodity Composition is positive for
1998-2002, remains negative during both 2002-2007 and 2007-2012, although recording a
substantial increase 2007-2012. Looking at the list of high technology items that India exports to
China from our dataset, we find that certain items India exported to China in 2002 those were not
exported during 1998 or 2007. A few of such items, however, have been exported during 2012.
A few high technology products were exported in 1998, but not in 2002, and again were exported
both during 2007 and 2012. There are a number of high technology items that India started
exporting to China since 2007 and continued to export them even during 2012. Thus the changes
in the high technology export items to China during 2002-2007 did not contribute positively to
India’s exports, but the changes during 2007-2012 did have a positive impact on Indian high
technology products exports to China. The Effects of Competitiveness component is negative
remains almost at the same level during 2007-2012. This implies that India’s competitive
strength as opposed to the other countries who export high technology products to China
improved during 2002-2007 and India has been able to maintain it more or less at the same level
[image:25.612.74.423.228.297.2]during 2007-2012.
Table 3: CMS India China
2002 2007 2012
General increase in demand for imports 123.02 138.06 61.61
Change in commodity composition 0.74 -79.83 -3.40
Effects of competitiveness -23.76 41.77 41.79
Source: Calculated from data obtained from WITS database
For Germany, as reflected by Table 4, the General Increase in Demand for Imports component
remains positive recording a substantial increase during 2002-2007 followed by a decline during
2007-2012. The GDP growth rate figures for Germany show that during 1998-2002, Germany’s
growth rate had been low never exceeding 2 per cent except for reaching 3.1 per cent in 2000.
During 2002, Germany’s growth rate was zero per cent, which increased to 3.3 per cent in 2007,
but again declined to 0.7 per cent during 2012. Thus the direction of the changes in the General
Increase in Demand for Imports component is quite similar to the direction of changes in the
growth rates of GDP during the concerned period. Therefore the changes in this component are
very likely to be directly resulting from the changes in GDP growth rates of Germany during our
period of analysis. The Change in Commodity Composition component declines continuously
thus turning negative during 2007-2012. Our dataset shows that there are some high technology
products which India has exported to Germany in 1998, 2002, 2007 and 2012. In most cases,
India has exported the high technology products either in 1998 and then again in 2012, but not
India has changed the high technology export items to Germany quite often. From the direction
of change in the Change in Commodity Composition component we can infer that such changes
has not helped India’s exports to grow in the German market. An underlying implication of this
is that India needs to understand the requirement of the German market more appropriately and
serve it accordingly by selecting the right kind of high technology export items. The Effects of
Competitiveness component declined during 2002-2007, but increases during 2007-2012 and
stays positive throughout. This implicates that the competitive strength of Indian high technology
exports as compared to other countries who export high technology products to Germany
[image:26.612.75.422.366.435.2]although had declined in between but has recovered to some extent also.
Table 4: CMS India Germany
2002 2007 2012
General increase in demand for imports 6.13 57.64 43.59
Change in commodity composition 3.77 2.68 -4.75
Effects of competitiveness 90.10 39.68 61.16
Source: Calculated from data obtained from WITS database
As suggested by Table 5, for Netherlands, General Increase in Demand for Imports remains
positive throughout although it continuously declines during both 2002-2007 and 2007-2012.
The growth rate figures for this country indicate that GDP growth rate had been higher in 1998
(3.9 per cent) than in 2002 (0.1 per cent), again rose to 3.9 per cent in 2007, but declining to -1
per cent in 2012. This suggests that decline in GDP growth rate for Netherlands might have
resulted in decline in its import demand during 1998-2002 and 2007-2012, which has also led to
a decline in India’s high technology products exports to the country. However, during
2002-2007, when Netherland’s GDP growth rate had improved, demand for Indian high technology
export potentials to Netherlands. The Change in Commodity Composition component increases
substantially to reach from a negative value during 1998-2002 to a positive value in 2002-2007,
but declines during 2007-2012 although remaining positive still. The number of high technology
products which India exports to Netherlands is not very large (as observed from our data set).
Moreover, in case of most of these export items, there is no definite pattern in the level of
exports over the concerned period, i.e. India has exported certain items in certain specific years
and never before or after, for some items, abruptly there is export from India to Netherlands
during two or three years in our considered time period. The direction of changes in the Change
in Commodity Composition component indicates that changing the export items to Netherlands,
India has gained during 1998-2002 and 2002-2007, but the same does not hold true during
2007-2012. To prevent it from further declining and enhancing its value would require India to identify
the nature of high technology products that the Dutch market requires and select its high
technology export items accordingly. The Effects of Competitiveness declines drastically during
2002-2007 thus turning negative and then increasing substantially during 2007-2012 turning
positive again. This indicates that India’s competitive strength as compared to other countries
who export high technology products to the Dutch market had diminished during 2002-2007 but
[image:27.612.70.424.587.654.2]has recovered again during 2007-2012.
Table 5: CMS India Netherlands
2002 2007 2012
General increase in demand for imports 269.33 124.68 7.33
Change in commodity composition -262.61 61.00 3.75
Effects of competitiveness 93.28 -85.68 88.92
For Nigeria, as observed from Table 6, the General Increase in Demand for Imports is positive
throughout marking an increase during 2002-2007 followed by a decline during 2007-2012. If
we look at the growth figures for this country, we find that the rate of growth of GDP had been
rising at a slow pace during 1998-2000 and declined during 2000-2002, thus reaching 1.5 per
cent during 2002. However, it has increased substantially during the following two years, 2003
and 2004, being more than 10 per cent during both these years followed by a decline after that. In
2007 the growth rate was 6.4 per cent, and after that it has remained at more than 6 per cent
level, reaching 6.6 per cent in 2012. Thus the rise in demand for Indian high technology products
in the Nigerian market during 2002-2007 is likely to result from the surge in its GDP growth rate
in the intermediate years. But since during 2007-2012, GDP growth rate for Nigeria had been
through both up and down in its level, the decline in the demand for Indian high technology
products is difficult to be explained solely in terms of its rate of growth of GDP. There are likely
to be other factors responsible for this phenomenon. The Change in Commodity Composition
component increases drastically during 2002-2007 thus acquiring a high positive value, from a
negative value during 1998-2002 and declines substantially during 2007-2012, although still
remains positive. Our dataset suggests that there have been changes in the composition of Indian
high technology exports to Nigeria both during 2002-2007 as well as 2007-2012. The changes in
the direction of the Change in Commodity Composition component suggests that the changes in
high technology export composition during 2002-2007 had been favourable for India while that
during 2007-2012 was not so. The Effects of Competitiveness component falls substantially
during 2002-2007 turning negative from a positive value during 1998-2002, and then increases
although still remains negative during 2007-2012. This suggests that India’s competitive strength
relatively during 2007-2012. But to fare better in the Nigerian market and to retain this market
India needs to make its high technology products exports more competitive, since the Effects of
[image:29.612.75.423.201.266.2]Competitiveness component stays negative even during 2012.
Table 6: CMS India Nigeria
2002 2007 2012
General increase in demand for imports 33.35 133.61 9.01
Change in commodity composition -25.67 791.56 280.30
Effects of competitiveness 92.32 -825.18 -189.32
Source: Calculated from data obtained from WITS database
For Russian Federation, as we observe from Table 7, the General Increase in Demand for
Imports component is positive throughout, recording a drastic increase during 2002-2007,
followed by a decline during 2007-2012. The growth rate figures for the Russian Federation
suggests that there had been a significant improvement in the rate of growth for this country
during 2002-2007, in 2002 the growth rate was 4.7 per cent while in 2007, it was 8.5 per cent.
However, most likely due to the financial crisis during 2008, the growth rate of GDP declined
after that turning negative in 2009. Though there is a recovery, but still after that till 2012, the
growth rate has never gone above 5 per cent. Thus the enhancement and decline in the demand
for Indian high technology products by the Russian Federation is quite likely to be a direct
consequence of the changes in the growth rates of its GDP. A substantial decline in the Change
in Commodity Composition component occurs thus turning it negative during 2002-2007,
followed by a marked improvement thus turning it positive again during 2007-2012. There are a
number of high technology products that India used to export to the Russian Federation during
2002 but not during 2007 while some new high technology products it exported during 2007
The changes the directions of the Change in Commodity Composition component suggests that
the changes in the composition of high technology exports had been adverse to India during
2002-2007 while the opposite holds for such changes during 2007-2012. The Effects of
Competitiveness component improves substantially during 2002-2007 thus turning positive from
a high negative value and then declines although still remains positive during 2007-2012, thus
implying that India needs to adopt appropriate policies to maintain competitiveness in the high
tech products sector. This reflects that India’s competitive strength as against other contenders in
case of high technology products exports had substantially improved during 2002-2007, followed
by a decline. Thus India needs to pay attention to improve its competitive strength to retain its
[image:30.612.73.422.395.463.2]position in the Russian market or to improve it further.
Table 7: CMS India Russian Federation
2002 2007 2012
General increase in demand for imports 3.79 145.88 29.14
Change in commodity composition 426.23 -86.56 52.09
Effects of competitiveness -330.02 40.68 18.77
Source: Calculated from data obtained from WITS database
Table 8 shows that for Singapore, the General Increase in Demand for Imports component stays
positive throughout, declines slightly during 2002-2007 and remains almost at the same level
thereafter. The growth rate figures for this country reflect a lot of fluctuations during 1998-2012.
Therefore the changes in the direction of the General Increase in Demand for Imports
component are likely to have been caused by some additional factors and not just the growth rate
of GDP. Since Singapore has full capital account convertibility (which was a major factor behind
this economy being so hard hit by the South-East Asian financial crisis during 1997), some level
fluctuating nature of demand for high technology products. The Change in Commodity
Composition component stays positive throughout, recording an increase during 2002-2007 and
then a decline during 2007-2012. India exports a large number of high technology products to
Singapore. Most of these products are being exported throughout our period of analysis.
However, there are a few of these products which are exported only in specific years and not
always. So the directions of changes in the Change in Commodity Composition component
suggest that the changes in the composition of high technology products exports acted
favourably for India during 2002-2007 but not during 2007-2012. Therefore India needs to
recognize the specific needs of the Singapore market and target it in a better way in order to
improve its export performances in that market. The Effects of Competitiveness component
remains negative throughout, declining during 2002-2007 and increasing during 2007-2012. This
clearly suggests that India needs to be really careful in making its high technology products
exports in Singapore more competitive as compared to its contenders. Although the direction of
changes in the Effects of Competitiveness component reflects some moves in this direction, but
unless India can improve its competitiveness in case of high technology items substantially, it
[image:31.612.74.425.559.628.2]might lose this market in future.
Table 8: CMS India Singapore
2002 2007 2012
General increase in demand for imports 60.33 56.81 56.18
Change in commodity composition 79.86 137.11 56.51
Effects of competitiveness -40.19 -93.92 -12.69
Source: Calculated from data obtained from WITS database
The General Increase in Demand for Imports component for UAE remains positive throughout,
9. The GDP growth rates for this country had been above 8 per cent during 2003, 2004 and 2006.
Thus the increase in the General Increase in Demand for Imports component may be a result of
high GDP growth between 2002 and 2007. After 2007, especially during the years immediately
following the crisis, the growth rates for this country are negative. The Change in Commodity
Composition component declines and turns negative during 2002-2007 and increases but still
stays negative during 2007-2012. Although UAE is the second top most destination for Indian
high technology export items, our dataset shows that there are only a number of high technology
products that India exports to UAE consistently during all the years considered for our analysis.
Improvement in the value of the Change in Commodity Composition component during
2007-2012 indicates that the high technology products that India had been exporting during this period
are the ones more appropriate for the UAE market. But since it is still negative, India needs to
study the UAE market more deeply to understand its specific requirements for high technology
products and select the export items accordingly. The Effects of Competitiveness component
remains positive throughout, declining during 2002-2007 and then increasing markedly during
2007-2012. This implies that India had been lagging in terms of competitiveness in high
technology products exports behind its contending exporters to UAE during 2002-2007, but has
[image:32.612.70.425.588.654.2]been able to improve her position during the next five years.
Table 9: CMS India UAE
2002 2007 2012
General increase in demand for imports 29.58 97.45 11.66
Change in commodity composition 20.53 -32.06 -4.89
Effects of competitiveness 49.89 34.61 93.22
For UK, as observed from Table 10, the General Increase in Demand for Imports component
increases substantially during 2002-2007 but declines drastically during 2007-2012. The GDP
growth rates for this country are never very high during 2002-2007, always staying below 4 per
cent per annum, but the growth rate has been more or less steady during these years. However,
both during 2008 and 2009 the growth rate has been negative owing to the financial crisis.
Although it has recovered after that, it has never crossed 2 per cent. Thus the reduction in the
General Increase in Demand for Imports component during 2007-2012 is likely to be a direct
consequence of the financial crisis during 2008 and its aftermath during the following years. The
Change in Commodity Composition component remains negative throughout but improves
continuously during 2002-2007 and 2007-2012. Observing the list of India’s high technology
export items to the UK it is found that most of the commodities in this list India has been
exporting consistently during the time period considered, although some few new commodities
have entered the list while some other commodities have dropped out. The gradual improvement
in the value of the Change in Commodity Composition component indicates that India is over the
time addressing the needs of the UK market better. But since the value of this component is still
negative, this implies that India needs to reflect more on this and target the market with more
appropriate types of high technology items. The Effects of Competitiveness component is
positive throughout showing a decline in 2002-2007 and an increase during 2007-2012 thus
reflecting an improvement in India’s competitive strength during 2007-2012 vis-à-vis other
contenders in the UK market.
Table 10: CMS India UK
2002 2007 2012
General increase in demand for imports 23.73 71.64 13.91
Effects of competitiveness 111.47 50.75 103.42
Source: Calculated from data obtained from WITS database
From Table 11, we find that, the General Increase in Demand for Imports component is positive
throughout remaining almost at the same level during 2002 and 2002-2007. During
1998-2007, the GDP growth rates for this country has varied between 1per cent and 5 per cent, but has
never changed very drastically in any direction. Since the US had been the country where the
financial crisis of 2008 originated, it GDP growth turned negative during the same year and even
in 2009 it stayed negative. It has recovered after that, but the GDP growth rates are still not very
high (the growth rates have never exceeded 3 per cent till 2012). So the onset of the crisis and its
aftermath is likely to be the major reason behind the reduction in the General Increase in
Demand for Imports component during 2007-2012. The Change in Commodity Composition
component declines and turns negative during 2002-2007 and increases drastically thereafter
acquiring a high positive value during 2007-2012. From our dataset it emerges that though most
of the high technology items that India exports to the USA have been exported consistently, there
are many new items, which India started exporting since 2007 or 2012 and some items it has
exported in 2002, but not during 2007 or 2012. The direction of the changes in the Change in
Commodity Composition component suggests that the selection of the high technology export
items during 2007-2012 addresses the requirements of the US market more appropriately. The
Effects of Competitiveness component increases during 2002-2007 and then declines drastically
turning negative during 2007-2012. So an obvious policy implication is to adopt measures for
enhancing competition in the high technology products sector in order to make its exports more
competitive in the US market as compared to other contending exporters. Otherwise India might
Table 11: CMS India USA
2002 2007 2012
General increase in demand for imports 35.95 35.31 23.98
Change in commodity composition 10.67 -5.24 101.96
Effects of competitiveness 53.38 69.93 -25.94
Source: Calculated from data obtained from WITS database
7.2CMS China
The following Tables 12-22 provide the percentage values of the three components as mentioned
in Section 6 from the CMS model for China. Table 12 below suggests that for the world as a
whole General Increase in Demand for Imports component increases during 2002-2007 and
declines during 2007-2012 although stays positive throughout. . Just like India, for this country
also the major reason for the reduction in the General Increase in Demand for Imports
component during 2007-2012 for the whole world is the global financial meltdown during 2008.
This financial meltdown has led to an overall reduction in demand for imports from the world
and therefore for the high technology products as well. The Change in Commodity Composition
component remains low throughout, even acquiring a negative value during 2007 and then
recovering to a positive value during 2012. The Effects of Competitiveness component remains
positive throughout although declining during 2002-2007 and then recovering to its previous
level during 2007-2012 thus reflecting China’s competitive strength in the high technology
products sector as opposed to other countries who export high technology products.
Table 12: CMS China World
2002 2007 2012
General increase in demand for imports 15.05 34.77 15.11
Change in commodity composition 0.37 -10.55 0.17
Effects of competitiveness 84.58 75.77 84.71
[image:35.612.79.421.644.701.2]Brazil’s demand for imports of high technology products from China has experienced a sustained
increase as reflected through the steady rise in the General Increase in Demand for Imports
component throughout during 1998-2012. Brazil GDP growth rate has gone through many ups
and downs during the concerned period. However, it fell only very drastically to turn negative
during 2009. Despite that, since the demand for Chinese high technology products has been
continuously rising, it indicates that Chinese high technology products satisfy the requirements
of the Brazilian market quite appropriately. Thus even during the years recording low growth
rates there is no impact on the demand for Chinese high technology imports. The same pattern is
observed for the component Change in Commodity Composition. . Our dataset suggests that
China started exporting some new items during 2002, 2007 and 2012. Observing the directions
of change in the component Change in Commodity Composition, we can make out that it worked
favourably for China. However, the Effects of Competitiveness component marks a continuous
decline throughout 1998-2012 and finally turns negative during 2012 indicating a reduction in
China’s competitive strength vis-à-vis its contenders for the Brazilian market for high technology
products. So China needs to adopt measures to prevent the decline in its competitive strength in
[image:36.612.78.423.560.628.2]context of Brazil.
Table 13: CMS China Brazil
2002 2007 2012
General increase in demand for imports -52.13 13.58 72.87
Change in commodity composition -68.64 13.18 50.27
Effects of competitiveness 220.77 73.24 -23.14
Source: Calculated from data obtained from WITS database
For Germany, as reflected in table 14, the General Increase in Demand for Imports component
Germany’s growth rate of GDP has moved upward and downward many a time during our
concerned period of analysis. It has turned negative once during 2003 and another time during
2009. After 2009, however, there has been a recovery. But still the demand for imports of high
technology products from China declines substantially as reflected from the calculated values of
the General Increase in Demand for Imports component. It appears that during 2002-2007 the
German market had a demand for Chinese high technology items, but possibly due some changes
in consumers’ preferences this is not so any more during 2007-2012. The Change in Commodity
Composition component declines continuously during 1998-2012, turns negative during 2007
and acquires a very high negative value during 2012. During the period of analysis, as observed
from our dataset, there have been some changes in the list of high technology export items from
China to Germany in terms of new products being included; products exported earlier being
dropped from the list and some products being exported in certain years but not always. It
appears that none of these changes have acted in favour of China for which we observe the
continuous decline in the Change in Commodity Composition component. The Effects of
Competitiveness component has increased throughout and quite substantially during 2007-2012
[image:37.612.79.425.561.628.2]thus reflecting China’s growing competitive strength.
Table 14: CMS China Germany
2002 2007 2012
General increase in demand for imports 1.64 35.95 -193.35
Change in commodity composition 22.75 -22.57 -228.18
Effects of competitiveness 75.61 86.63 521.53
Source: Calculated from data obtained from WITS database
Table 15 suggests a continued rise in the demand for Chinese exports to Hong Kong, as reflected
1998-2012. Despite experiencing fluctuations in growth rates of GDP and even recording a
negative growth rate during 2009, the continuous increase in the General Increase in Demand
for Imports component indicates Hong Kong’s strong preference towards Chinese high
technology products. The Change in Commodity Composition component records a marked
increase during 2002-2007 followed by a decline during 2007-2012. There are certain products
that China has stopped exporting to Hong Kong after 2002 and some products it has started
exporting since 2007. The direction of changes in the value of the Change in Commodity
Composition component suggests that China has gained from the changes in the list of high
technology export items to Hong Kong during 2002-2007 and lost from such changes during
2007-2012. The Effects of Competitiveness component declines drastically during 2002-2007,
turning negative, but improves again during 2007-2012, turning positive again during 2012
indicating that China has recovered during 2007-2012 from the loss in competitive strength in
the high technology products sector as opposed to other contenders in the Hong Kong market
[image:38.612.74.423.505.573.2]during 2002-2007.
Table 15: CMS China Hong Kong
2002 2007 2012
General increase in demand for imports 4.53 21.42 58.93
Change in commodity composition 26.13 964.63 19.91
Effects of competitiveness 69.34 -886.05 21.15
Source: Calculated from data obtained from WITS database
India reflects a continued rise in demand for Chinese imports as indicated by the sustained
increase in the General Increase in Demand for Imports component in Table 16. If we look at the
growth rate figures for India during 1998-2012, we find that India has experienced high growth
2008, India’s growth rate had declined to the level of 3.2 per cent, in 2009 in stark contrast to
many countries, India experienced a growth rate of 8.5 per cent followed by a growth rate of 10.5
per cent during 2010. But then in 2011 there had been a lower growth rate of 6.3 per cent,
followed by an even lower growth rate of 3.2 per cent in 2012. Thus India’s more or less
consistently high growth rate compounded by the fact that this country was relatively more
insulated than many other countries from the adverse impact of the financial meltdown of 2008
is likely to have contributed to a sustained increase in the import demand for high technology
products from China. However, the Change in Commodity Composition and the Effects of
Competitiveness components decline throughout turning negative during 2012. Observing our
dataset we find that the list of high technology export items has changed a number of times
during our period of analysis which as it appears has not contributed to the growth of Chinese
imports in the Indian market. India herself is a large exporter of high technology products and
looking at the lists of high technology products exported by both India and China, we find that
there are many common items between these two lists. Therefore it might very well be the case
that India is able to produce and sell in its own market such common high technology items at
cheaper rates as compared to their Chinese counterparts. If this is indeed the case then China is
[image:39.612.75.422.587.654.2]very likely to lose its competitive strength.
Table 16: CMS China India
2002 2007 2012
General increase in demand for imports 8.93 47.57 346.74
Change in commodity composition 6.90 6.08 -59.77
Effects of competitiveness 84.16 46.35 -186.97
Japan’s demand for Chinese imports has increased during 2002-2007, and then declined during
2007-2012 as reflected in the fluctuations in the General Increase in Demand for Imports
component in Table 17. This is likely to arise from the slight increase in GDP growth rate during
1998-2002, followed by a steady growth rate during 2002-2007, and the subsequent decline in
this growth rate during and after 2008. The Change in Commodity Composition component
declines both during 2002-2007 and 2007-2012, thus suggesting that China has not benefited
from the changes in the list of exports of its high technology products to Japan (as observed from
our dataset, a number of high technology items have been exported to Japan during certain years
but not consistently throughout). The Effects of Competitiveness component declines during
2002-2007 and then increases during 2007-2012 indicating that China has been able to regain its
[image:40.612.75.424.423.488.2]competitive strength in context of the Japanese market during 2007-2012.
Table 17: CMS China Japan
2002 2007 2012
General increase in demand for imports 25.31 43.42 39.38
Change in commodity composition 5.77 5.43 2.34
Effects of competitiveness 68.92 51.15 58.28
Source: Calculated from data obtained from WITS database
From Table 18 we observe that the General Increase in Demand for Imports component
increases during 2002-2007 and then declines substantially though still remaining positive during
2007-2012. The average growth rate of Korea during 2007-2012 is lower during 2007-2012 as
compared to 2002-2007 and this is a very likely reason for the lower value of the General
Increase in Demand for Imports component during this period. The Change in Commodity
Composition component falls, acquiring a negative value during 2002-2007 but then improves
gained through starting to export some new high technology items to Korea Republic since 2007
and also from stopping the export of a few other commodities. The Effects of Competitiveness
component increases during 2002-2007 and then declines to reach a negative value during 2012
thus indicating a reduction in China’s competitiveness in the high technology products sector in
context of its exports to the Korea Republic as compared to other contending exporters to the
[image:41.612.74.422.285.351.2]same country.
Table 18: CMS China Korea Republic
2002 2007 2012
General increase in demand for imports 30.24 33.13 0.47
Change in commodity composition 14.62 -4.61 110.67
Effects of competitiveness 55.15 71.49 -11.14
Source: Calculated from data obtained from WITS database
Demand for China’s exports to Mexico rises continuously during 1998-2012 as observed from
the movement in the percentage value of the component General Increase in Demand for
Imports in Table 19. Although the GDP growth rate for Mexico declined substantially during
2009 (turning negative) and was not so high even after that, still the sustained increase in the
demand for imports from China is likely to be caused by other factors, e.g. strong preferences for
Chinese high technology products among the Mexican consumers. The Change in Commodity
Composition component declines during 2002-2007 turning negative during 2007 and then
increasing to acquire a positive value during 2012. China has, as can be found from our dataset,
started exporting some high technology since 2007 and discarded certain earlier export items and
it has gained from such changes. The Effects of Competitiveness component increases during
2002-2007 and declines during 2007-2012 indicating China’s receding competitive strength in