Munich Personal RePEc Archive
Land Access and Youth Livelihood
Opportunities in Southern Ethiopia
Bezu, Sosina and Holden, Stein T.
Norwegian University of Life Sciences, Norwegian University of Life
Sciences
16 September 2013
Online at
https://mpra.ub.uni-muenchen.de/49860/
1
Land Access and Youth Livelihood
Opportunities in Southern Ethiopia
Sosina Bezu and Stein T. Holden
School of Economics and Business
Norwegian University of Life Sciences
P.O.Box 5003, 1432 As, Norway
E-mail: sosic@umb.no
2
Land Access and Youth Livelihood Opportunities in Southern Ethiopia:
Sosina Bezu and Stein T. Holden
Abstract
This study aims to examine current land access and youth livelihood opportunities in Southern Ethiopia. Access to agricultural land is a constitutional right for rural residents of Ethiopia. We used survey data from the relatively land abundant districts of Oromia Region and from the land
scarce districts of Southern Nations, Nationalities and Peoples’ (SNNP) Region. We found that youth in the rural south have limited potential to obtain agricultural land that can be a basis for viable livelihood. The law prohibits the purchase and sale of land in Ethiopia. We found that land access through allocation from authorities is virtually nonexistent while land that can be obtained from parents through inheritance or gift is too small to establish a meaningful livelihood. The land rental market has restrictions, including on the number of years land can be rented out. Perhaps as a result of limited land access, the youth have turned their back on agriculture. Our study shows that only nine percent of youth in these rural areas plan to pursue farming. The majority are planning non-agricultural livelihoods. We also found a significant rural-urban migration among the youth and especially in areas with severe agricultural land scarcity. Our econometric analyses show that youth from families with larger land holding are less likely to choose non-agricultural livelihood as well as less likely to migrate to urban areas. We suggest here some measures to improve rural livelihood such as creation of non-farm employment opportunities and improvement of land rental markets. We also argue that as a certain level of rural-urban migration is unavoidable, investigating youth migration is essential to design policies that help the migrating youth as well as the host communities.
Key words: Youth unemployment, youth livelihood, rural livelihood, migration, Ethiopia
3
Acknowledgements
This research has been funded by UNHABITAT and Norwegian University of Life Sciences. Useful comments have been received from Toril Iren Pedersen. We would like to thank people at the Land Administration offices in the Oromiya and SNNP regions and districts where we
4 1 Introduction
Youth unemployment and lack of livelihood has become a major global concern following the global economic crisis that trigger a sharp rise in youth unemployment in 2008-2009. The
current youth unemployment rate is estimated to be 12.6% and is expected to remain high for the next five years (ILO 2013). Although predominantly agricultural economies may not be hit as hard by the global financial crisis, there is still significant unemployment. And those reportedly employed have vulnerable livelihood. Sub-Saharan-Africa has a regional unemployment rate of 11% but the rate of working poverty is by large the highest in the world, estimated at 40.1 per cent in 2012 at the US$1.25 per day level (ILO, 2013).
Ethiopia’s current population is estimated to be more than 86 million (CSA 2013) .The populations is predominantly rural with 84% employed in agriculture. A recent nationally
representative survey shows that the majority of Ethiopia’s population is young with the youth
and adolescent population alone accounting for 40.6% the total population in 2011(CSA and ICF 2012). At least for now, access to agricultural land is likely to be the most important determinant
of Ethiopia’s youth livelihood.
Access to agricultural land is a constitutional right in Ethiopia where it has also served as a safety net in rural areas. But increasingly it has become difficult to fulfill this right for the young generation. Ethiopia faces land scarcity in parts of the highlands where population densities have become very high and farm sizes very small. As a result, land as a safety net is eroding and landlessness emerging among the youth who are unable to stay on their parents’ land. This is particularly true for Southern Ethiopia where farm size is the smallest in the country. New land laws also add complication as the minimum farm size is now set at 0.5 hectare while many farms are already smaller than this. The children therefore either have to co-manage the land with their parents or leave the farm. The institutional responses to the challenge include distribution of communal land to youth and voluntary resettlement.
Land is traditionally inherited by the sons who marry and stay on the farm while girls typically
marry and move to the husband’s village. Unmarried girls would, however, get land from their
5
Ethiopia and how it determines their livelihood strategies and welfare outcomes. More specifically we aim to answer the following research questions:
1) What livelihoods strategies do the youth choose when land scarcity becomes very high? Are the youth aiming to obtain land for agriculture or are they looking for alternative livelihood options outside agriculture?
2) How is land scarcity and land certification affecting the access to land and land tenure security of youth?
3) How does extreme land scarcity affect the intra-household competition for land? Who are leaving and who remain behind and why?
4) How is land scarcity affecting,
a. The nutritional status of children and youth that stay on the farm? b. The education decisions of the children?
c. The gendered land distribution among children in the household?
5) To what extent are the youth organized and demand land as a source of future livelihood? 6) How and to what extent are the local governments and communities responding to the
youth needs and demands?
7) What are the complementary constraints and needs that the youth face in accessing and efficiently utilizing land resources to secure their livelihood and improve their welfare? 8) What are the best practices used to improve access to land for youth, to mobilize and
empower them in relation to land utilization?
6 2 Background and data
2.1
Land Laws and regulationsThe Derg regime that had come into power in 1975 through a military coup abolished the feudal system in Ethiopia and declared all land, rural or urban, property of the state. The Marxist government tried to create an egalitarian land access through distribution of the existing farm land to peasants and through subsequent redistributions of land to accommodate young farmers. This state ownership of land has not changed with the change in political leadership in 1991 and the introduction of a more pro-market policy post 1991 that was in fact inscribed in the 1995 Ethiopian Constitution. Land is owned by the state and holders have only user rights. Peasants obtain land free of charge. While their land use rights have an indefinite duration, the land itself cannot be subject to sale or other means of exchange.
The 1995 constitution implies entitlement to agricultural land use to residents in rural areas. The recent federal and regional legislations that deal with rural land administration and land use enshrine this entitlement in the law. Section 5 of the Rural Land Administration and Land Use Proclamation of 2005 states that:
Peasant farmers/pastoralists engaged in agriculture for a living shall be given
rural land free of charge (Land Use Law, Section 5, No. 1-A)
Any citizen of the country who is 18 years of age or above and wants to engage in
agriculture for a living shall have the right to use rural land; children who lost
their mothers and fathers due to death or other situation shall have the right to
use rural land through legal guardians until they attain 18 years of age (FDRE,
2005).
The law also gives women equal right to use agricultural land.
Women who want to engage in agriculture shall have the right to get and use
7
This law appears to ensure young people’s right to use rural land. But the most important issue
especially in the face of increasing land scarcity is how they obtain the land. The 2005 legislation identify inheritance, donation and authorities as the source of rural land. Inheritance is the most common source of land acquisition for young people in Ethiopia and the right of parents to bequeath land to their children is clearly stated in the 2005 legislation. The Federal land use law states that:
Any person who is member of a peasant farmer, Semi pastoralist and pastoralist
family having the right to use rural land may get rural land from his family by
donation, inheritance or from the competent authority (Section 5, NO. 2).
Any holder shall have the right to transfer his rural land use right through
inheritance to members of his family (Section 8, No.5)
There are some variations in regional laws that may constrain or relax this access. In Oromia region for example priority in inheritance is given for those that depend on the holding or do not have other source of living. In Tigray region land can be taken from households that have been away from their farm for two years or more without any compensation.
With regard to obtaining land from a competent authority there are three ways this can happen. Land administrators may distribute unoccupied land, convert community land into individual farm land or redistribute existing farm lands. It has been argued that the fear of redistribution has been an important source of insecurity in the past and had negative impact on farmers’
investment on land (Alemu 1999, Holden and Yohannes 2002, Deininger and Jin 2006). As a result regular land redistribution has been suspended. The 2005 land use law stipulates special conditions under which land can be taken over and redistributed to the landless or land-poor farmers (FDRE 2005).
In accordance with land administration laws of the regions farmlands whose
holders are deceased and have no heirs or are gone for settlement or left the
locality on own wish and stayed over a given period of time shall be distributed to
peasant farmers, semi-pastoralist and pastoralist who have no land and who
8
Another condition where land may be redistributed is through a popular vote and request by residents of the locality.
Upon the wish and resolution of peasant farmers, semi pastoralists and
pastoralists where land distribution becomes the only alternative, it shall be
undertaken in such a way that it shall not be less than the minimum size of
holding and in a manner that shall not result in fragmentation of land and
degradation of natural resources(Section 9, No.3).
The regional governments design their land law and regulations in line with the Federal law with small variations and specific regulations to suit the conditions of their region. For example, in Amhara region, land redistribution takes place only if 80% of land holders in the kebelle1 ask for
it in writing. Resettlement to less densely populated areas is another option that is being explored and tested in some parts of Ethiopia.
While the Rural Land Use law stipulates that any citizen who wishes to engage in agriculture has
a right to use rural land, there are not enough tools on the ground to ensure that access. The law
recognizes inheritance as a legitimate source of land access but does not specify whether one is entitled to obtain land from authorities if the individual could not inherit from parents or relatives because of land shortage. Given the abolition of land redistribution, it is not also clear what options local authorities have if there are no more unoccupied arable land in that community.
The youth may secure temporary land access through land rental markets. Land access through rent is likely to increase in importance as less and less parents are able to bequeath land to all their children. In fact, the recent restriction on minimum land holding sizes of 0.5 ha in cereal-based farming systems and 0.25 ha in perennial cropping systems is likely to leave most heirs without land from their parents. But with the 2005 land use law, farmers were allowed to rent out their land to other farmers or investors as long as this transaction does not displace the original holder. This may provide a good opportunity for young people to access land through rent.
1
9
2.2
Land registration and certificationThe land registration and certification in Ethiopia which started in 1998/99 in Tigray region followed by Amhara, Oromia and SNNP regions in the early 2000s, is expected to improve tenure security of farmers, including young land holders. Beside the tenure security of current holders, the registration may also improve the security of young inheritors. The land certification involves registration of the names of all family members of the household on the certificate. This allows inheritors to document their entitlement in case of conflict after death of original holders. It is important to note that the names of both male and female children of the household head are registered on the certificate and a record of it kept at the district level. Traditionally land
inheritance in Ethiopia is patrilineal and girls do not often inherit land from their parents. They are expected to access land through their husband who will be inheriting land from own parents.
Whether or not this official registration of girls’ names in their parents’ land certificate will
change the inheritance culture is an empirical question but it can be argued that their position to claim land share in case of death of parents is strengthened through this.
2.3
Study locationsThe locations and households that were included in the study were identified using stratified random sampling. Stratification was based on agro-ecosystem variation, market access, population density (urban expansion pressure), and regional differences in land laws and implementation of land registration and certification. The sample included three major ethnic groups (with different languages). We built on a baseline study of 615 households in 2007 that focus on gender and land rights (Holden and Tefera 2008). The study is carried out in sixteen peasant associations in five districts in Southern Ethiopia; three in Oromia region and two in the Southern Nations, Nationalities and Peoples (SNNP) region. The study areas are;
a) Wondo Genet in SNNP region: A cash-crop and perennial zone with very high
10
second stage land certification that provide households parcel based land certificates with maps of the plots. Most of the population is Protestant.
b) Wollaita in SNNP region: A subsistence oriented perennial zone with very high
population density (67% of farms were below 0.5 ha in 2007). Enset, maize, and root and tuber crops are the main food crops. Many of the youth migrate to other areas for
employment, e.g. work as shoe-shiners, lottery ticket sellers and maids in urban areas. Resettlement programs also try to resettle people, including youth, in other less populated areas of the region. Most of the population is Protestant.
c) Sashemene in Oromia region: A cereal producing area and growing trading centre (small town development) where farm sizes are relatively larger (22% of farms were below 0.5 ha). Youth may here combine on-farm (on their family farm or on land inherited from their parents) and off-farm activities. Most of the population is Muslim.
d) Arsi Negelle in Oromia region: A cereal producing area with relatively larger farm sizes (12% of farms were below 0.5ha). Youth may primarily engage in farming but also in off-farm activities. Arsi Negelle was also selected because tenure insecurity has been identified in earlier surveys to be particularly acute in this district (Holden and Yohannes, 2002). Most of the population is Muslim
e) Wondo Genet in Oromia region: This location capture Oromo people that have settled in the Wondo Genet area and where a referendum has been held which decided to include some communities with majority of Oromo people under the Oromia region. Agro-ecological conditions are similar to those in Wondo Genet in SNNP region.
Within each of these we selected peri-urban communities (kebelles, also called peasant
associations) in addition to communities that are located further away from the district centre.
11
Map of Survey areas
2.4
Conceptual frameworkTo show the link between land access and rural youth livelihood, we borrow concepts from the livelihood approach which define livelihood as a combination of capabilities, assets and
12
Rural livelihoods depend heavily on natural capital. Natural capital in the livelihood framework includes natural resource stocks such as land, water, genetic resources and environmental services such as pollution sinks (Scoones 1998). Land is particularly important in rural livelihoods as it is the vital input in agricultural production. Access to land is therefore an important determinant of livelihood strategies. Individuals who could not access agricultural land will not be able to engage in agriculture and will need to diversify into non-farm activities or migrate to other areas. In this study we assess youth land access in rural Ethiopia and examine its impact on their livelihood strategies.
This study examines land access and livelihood strategies for rural youth in Ethiopia. But most of the youth live in an extended family where they are neither the only nor the primary decision maker in the household. To explore this issue further, we build on theories of household
behavior (Manser and Brown 1980, Becker 1981, Lundberg and Pollak 1993) where households may work as one decision-making unit with a household head taking the final decisions or where bargaining takes place and outcomes based on the bargaining power of individual household members and solutions can be cooperative or non-cooperative solutions. Non-cooperative
behavior may result in non-cooperative solutions within households (Lundberg and Pollak 1993). Individual household members may be more or less selfish and more or less generous towards other family members and towards other people in their community (Bezu and Holden 2013). They may also be more or less trustful and more or less trustworthy and these characteristics may affect the social relations within families and within communities which again affect the degree of cooperation among family members and other community members. These characteristics are likely to affect the degree of competition or cooperation in relation to utilization of land
Livelihood resources
Natural Capital (includes land)
Human Capital Social Capital
Economic/Financial capital Physical capital
Livelihood strategies
Agricultural intensification/ extensification
Livelihood diversification
13
resources within households as well as migration decisions and other livelihood-related decisions.
Fafchamps and Quisumbing (2005) studied marriage, bequest and assortative matching in rural Ethiopia using household data from 1997 for the four main regions of the country. They found that most of the land is passed on to the sons at time of marriage while daughters received very little or no land and that the distribution of wealth at time of marriage was very inequitable both for grooms and brides. They also found assortative matching such that more wealthy grooms marry more wealthy brides thus strengthening the tendency of inequitable distribution of
resources across generations. The inequitable distribution also continued at time of inheritance as the majority of women inherit nothing. They found sibling competition among sons. The
explanation for this pattern may be that sons who stay at home also take responsibility for their parents as they grow old. They did not find the same sibling competition for land at the time of marriage, possibly because such marriages do not take place at the same time and because at the time of their study young married couples may have been more able to obtain land through allocation from the community (kebelle). Our study 10-15 years later may involve more such
sibling competition because there is no or very little land available from the kebelle and family
land has also become scarcer. The new land proclamations in OR and SNNPR emphasise that land should be transferred to those children that depend on the land and have no alternative sources of income. This shows the pro-poor aspect of the land proclamation which emphasises that land still has a role as a safety net. However, with the increasing land scarcity and
landlessness, this role of land can only support some of the children if family planning and birth control is not implemented.
2.5
Data and methods14
survey to select youth from the same households. In addition to the land related data we collected on the full sample in 2007 and 2012, we administer a separate survey for households that have youth members. Using questionnaires we separately interviewed youth and the household head concerning land access and livelihood issues. In addition we carried out social field experiments to study generosity and trust among youth.
2.5.1 Survey data
The survey for this youth study was carried out in February-March 2013. The household heads are typically the fathers unless it is a female-headed household. The questions posed for household heads deal with past and future land inheritance to children, land registration and certification status and schooling decisions for children. In addition detailed demographic data was collected, including information on the household members who left the household. The youth interview addresses youth involvement in agriculture; land inheritance expectations; trust and cooperation with siblings and parents; preferences and expectations in relation to marriage; and livelihood options and choices. In addition to structured questionnaires we carried out social field experiments that explored the sharing behavior and trust among siblings and with other youth in the village. The data were entered in Excel and cleaned and transferred to Stata for analysis. Descriptive analyses and regression analyses are used to answer our research questions.
2.5.2 Social field experiments
We played dictator games2 and trust games3 with youth in our sample. A public place in the village was identified for the experiments (such as an office in the health station, agricultural extension office or school) and all sample youth in the village were handled in one session to minimize communication and leakage of information before all sample respondents in the village had played the games. Pairs of siblings (the eldest two youth if we have three or more youth in the family) were asked to come together as two household members should participate in the game. For polygamous households we included one pair of youth from each mother whenever possible. The pairs were first invited into ‘play room one’. The ‘first player’ identified through a
2
See: http://en.wikipedia.org/wiki/Dictator_game for an introduction to dictator games.
3
15
coin toss remains in this room with ‘interviewer one’ while the loser from the coin toss is taken
to another room to play the game with another interviewer. The rooms are arranged in such a way that the players cannot see or hear each other. But the rooms are close enough to allow swift movement by the facilitator between the two rooms during the experiment. The players play the dictator game simultaneously in the two rooms, while the trust game is necessarily played sequentially afterwards.
2.5.2.1 Dictator game
We placed 30 ETB4 in front of each player in the respective rooms. Each player was then asked how s/he shares this money between him-self/her-self and three different persons that s/he may be paired with. Out of the three choices one will be real through lottery after s/he has decided how much to share in each case. The player is told that giving nothing or everything is also an option. The three persons s/he is asked to share with are: 1) a sibling who is also playing the
game in the other room; 2) the respondent’s own father or other household head if no father; 3)
another anonymous youth in the village from the sample. After registering whether and how much the player will share in each case, a lottery is drawn to determine the real recipient and the amount due to the recipient is registered and set aside. The player is then given the amount of money s/he should keep in the selected choice. The players in each room do not know what is going on in the other room including whether or not their sibling is playing a similar game or get any money.
2.5.2.2 Trust game
After the dictator game is completed, the table is cleared for another game. 30 ETB is put in front of the first player but it is explained that this game is different. Again s/he should decide about possibly sharing part of the money with the same three alternative persons as in the previous game. But in this case we triple the amount given such that the receiver will get an amount which is three times higher than what s/he gives. Following that the other player (second player) can also chose to give back part of the amount received from the first player. The second player is free to decide how much s/he will give back to the first player. The second player will be
4
16
informed about the instruction given to the first player and that the amount given by the first player was tripled by the researchers. Based on that s/he will decide whether to give something back and how much to give back. The first player is also free to give nothing or to give up to 30 EB to the second player. If s/he gives 30 EB the second player will get 90 EB and is then free to keep it all or can return part or all of it to the first player.
To avoid causing possible conflict among siblings we did not reveal the real receiver of the trusted amount to the first player. After the first player decides how much money to send in each of the three cases (father/household head, sibling, and anonymous youth) the player is taken to a waiting place while a coin is tossed to determine whether the receiver will be the sibling or the anonymous youth from the same village. The parent/head of household is dropped from the
payout as the game is among youth but this is not told to the player until after s/he has decided
the allocation for each case. The second player is also asked hypothetically what s/he would give back if s/he received ETB 45 (15*3 ETB) from the brother/sister, the father/household head, or an anonymous youth in the village. After this is recorded the envelope with money which may be from the brother/sister or an anonymous youth is opened. The second player is told that if the giver was the brother/sister that person will not be told what s/he decides to do. S/he is then asked to decide whether and how much to give back to the first player and can retain the rest for her/himself. The second player is also asked to give an assessment of how the brother/sister would react to her/his decision if they knew of her/his decision. The game protocols for these games are attached in Appendix 2.
17
3 Land access and youth livelihood opportunities: Analyses
In this section we will provide descriptive analyses based on our survey data. We also include some tables and statistics at regional and national levels to put our data into a broader
perspective. Furthermore, we run a variety of regression models to help provide a better basis for answering our research questions.
3.1
Assessing land availability, current land regulations and youth land access18
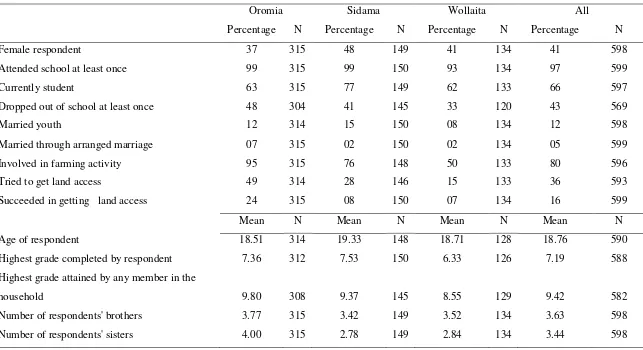
Table 3.1. Main characteristics of youth sample by survey sites (three zones)
Oromia Sidama Wollaita All
Percentage N Percentage N Percentage N Percentage N
Female respondent 37 315 48 149 41 134 41 598
Attended school at least once 99 315 99 150 93 134 97 599
Currently student 63 315 77 149 62 133 66 597
Dropped out of school at least once 48 304 41 145 33 120 43 569
Married youth 12 314 15 150 08 134 12 598
Married through arranged marriage 07 315 02 150 02 134 05 599
Involved in farming activity 95 315 76 148 50 133 80 596
Tried to get land access 49 314 28 146 15 133 36 593
Succeeded in getting land access 24 315 08 150 07 134 16 599
Mean N Mean N Mean N Mean N
Age of respondent 18.51 314 19.33 148 18.71 128 18.76 590
Highest grade completed by respondent 7.36 312 7.53 150 6.33 126 7.19 588 Highest grade attained by any member in the
household 9.80 308 9.37 145 8.55 129 9.42 582
Number of respondents' brothers 3.77 315 3.42 149 3.52 134 3.63 598
Number of respondents' sisters 4.00 315 2.78 149 2.84 134 3.44 598
19
There is also a big variation in youth access to land and participation in farming. A higher proportion of youth participated in farming and tried to access agricultural land in Oromia than Sidama and Wollaita. Their success rate is also higher in Oromia. We will discuss the land access issues in more detail in the next sections.
3.2
Agricultural land holding pattern in EthiopiaBefore we examine land access to the youth, it is imperative to review the current agricultural land holdings in Ethiopia. As Table 3.2 shows the average household farm size in Ethiopia is 1.22 hectares but 57% of the households hold less than one hectare. Oromia and SNNP have quite different farm sizes. The average farm size of 1.6 hectares in Oromia is more than twice the average farm size of 0.7 ha in SNNP.
Table 3.2. Household farm size and household size from national level survey
Average land holdings per
household
Household size Percentage of households with land holdings <1
hectare
Ethiopia 1.22 N.A 57
Oromia sample 1.6 5.49 46
SNNP sample 0.7 5.33 78
Source: Compiled from the 2011/2012 Agricultural Sample Survey report (CSA 2012)
20
Table 3.3. Household farm size by household size in Ethiopia
Farm size (ha)
Household size
Ethiopia Oromia SNNP
1 6--9 1 6--9 1 6--9
Under 0.1 10% 6% 7% 4% 9% 7%
0.1--0.5 27% 26% 20% 15% 46 45%
0.51—1 23% 23% 23% 20% 25% 27%
1.01—2 24% 25% 26% 28% 15% 15%
2.01—5 15% 18% 21% 27% 5% 6%
5.01--10 1% 2% 3% 4% - 1%
Over10 - - - 1% - -
Total 100% 100% 100% 100% 100% 100%
Source: Compiled from the 2011/2012 Agricultural Sample Survey report (CSA 2012)
The mean land holding size in our sample is 0.86 hectares sustaining an average household size of 7 people but most households have less than that as the median holding is 0.5 hectares. What is more, there are currently on average two youth per household for whom the family land is often the only land they have access to.
Table 3.4. Household land holding and demographic character in the sample
Mean N
Household land holding (in hectares) 0.86 609
Household size (current members) 7.05 610
Number of own children (of all age) currently living with the
household 4.88 610
Number of own children ( age 15-29 years) living with the
household 1.72 610
Number of own children alive (including currently non-resident) 6.70 597
[image:22.612.71.494.453.629.2]21
Table 3.5. Household land holding and demographic character by marriage type
Monogamous married
Polygamous married
Female-headed Household farm size (in hectares) 0.77 1.34 0.79 Household size (current members) 6.68 11.04 4.70 Number of own children (of all age) currently
living with the household 4.58 8.09 3.12
Number of own children ( age 15-29 years)
living with the household 1.58 2.71 1.57
Number of own children alive (including
currently non-resident) 6.00 11.02 5.71
Source: Own survey data
Table 3.5 shows farm size and household size disaggregated by the type of family and district, respectively. Polygamous households (accounting for 15% of the households) have bigger farm size but also significantly larger household size and more children.
Table 3.6 disaggregates the farm size and demographic characteristics by district. Shashemene and Arsi Negelle, both districts in Oromia have bigger farm size than Wondo Genet and Wollaita (districts in SNNP). In fact the farm sizes in these Oromia districtsare more than twice as big as in the districts in SNNP. Wondo-Oromia is geographically close to Wondo Genet district
22 Table 3.6. Land holding and demographic characteristics by district
Shashemene Arsi Negelle Wondo Genet Wollaita Wondo-Oromia
Variable Mean Median Mean Median Mean Median Mean Median Mean Median Household farm size (hectares) 1.1 1.0 1.4 1.3 0.5 0.5 0.5 0.5 0.8 0.8 Household size (current
members) 7.9 7.0 7.5 7.0 7.3 7.0 6.1 6.0 7.2 7.0
Number of own children (of all
age) living with the household 5.7 5.0 5.5 5.0 5.0 5.0 3.9 4.0 4.9 5.0 Number of own children ( age
15-29 years) living with the
household 1.7 1.0 2.0 2.0 2.3 2.0 1.2 1.0 1.5 1.0
Number of own children alive
(including currently non-resident) 7.3 7.0 7.3 6.5 6.6 6.0 6.3 6.0 5.4 5.0
23
Although Wollaita households have the same number of children as those in Wondo Genet and higher than those in Wondo-Oromia, the number of youth living with the households is the smallest in the sample, indicating the limited livelihood opportunities for youth in this very densely populated area with subsistence-oriented rain-fed agriculture creating pressure on the youth to look for livelihood outside of the household and community.
3.3
Youth and landholding in EthiopiaThe population in Ethiopia is predominantly young. The youth and adolescent populations together account for 40.6% of the total population in 2011 (CSA and ICF 2012). However, the majority of young people in rural Ethiopia do not have access to land despite their constitutional right to access land in the community they live. The 2012 national level land use survey shows that the youth (18-29 years old in this case) accounts for 21% of rural land holders in Ethiopia. Young female land holders are even rarer with only 3% of land holders identified as women aged 18-29 years. Table 3.7 shows youth land holders in Ethiopia and the two regions where our survey sites are located. The average age of the household heads (which is the same as the land holder in majority of the cases) in our sample is 43 years old. Only 15% of the household heads are in the age range 15-29.
Table 3.7. Young land holders in Ethiopia 2012
Male Female All
Ethiopia 18% 3% 21%
Oromia
22% 3% 24%
SNNP 16% 3% 19%
24
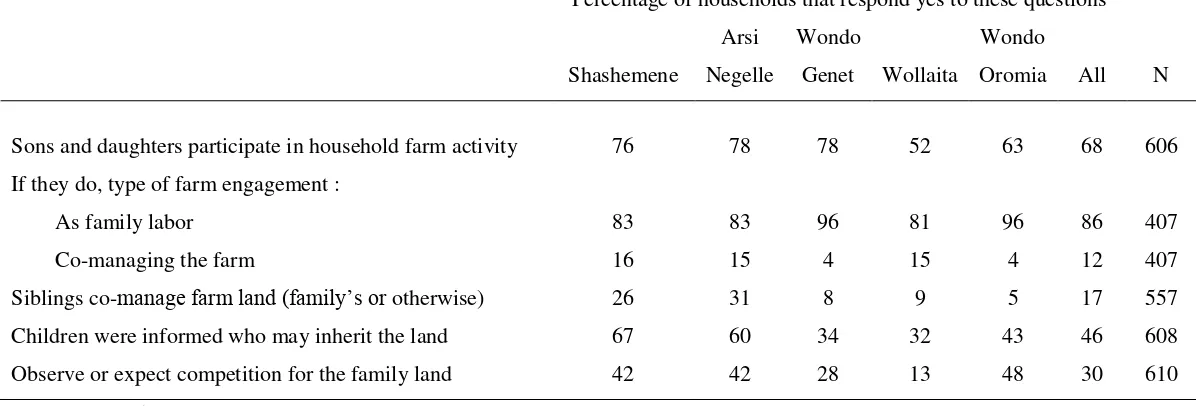
Table 3.8. Youth involvement in household agricultural production and information on inherence by district
Percentage of households that respond yes to these questions
Shashemene
Arsi Negelle
Wondo
Genet Wollaita
Wondo
Oromia All N
Sons and daughters participate in household farm activity 76 78 78 52 63 68 606 If they do, type of farm engagement :
As family labor 83 83 96 81 96 86 407
Co-managing the farm 16 15 4 15 4 12 407
Siblings co-manage farm land (family’s or otherwise) 26 31 8 9 5 17 557 Children were informed who may inherit the land 67 60 34 32 43 46 608 Observe or expect competition for the family land 42 42 28 13 48 30 610
25
In the majority of the households the sons and daughters participate in agriculture in some capacity. The least participation of own children in household farm activity is observed in Wollaita where only half of the household heads reported such participation followed by Wondo-Oromia (63%). For the other districts about three-fourth of the households reported children participation in own agricultural activities. For 86% of the households this participation is mainly in the form of family labor while in 12% of cases children co-manage farm with parents. The rate of co-management with parents in Shashemene and Arsi Negelle is about 16% against only 4% for Wondo Genet and Wondo-Oromia. Wollaita, although similar in land size to Wondo Genet, has the fewest youth participating in own agriculture It has comparable percentage of children-parent co-management of land as Shashemene and Arsi Negelle. Given the larger land holding in the two Oromia districts and a proportionately smaller participation of youth in farming in Wollaita, it appears that youth that engage in co-managing the land with parents may be the ones who intend to make agriculture a livelihood. The livelihood issue and its relation with land access are explored in more detail in section 3.7.
3.4
Land access options for the youthAs land cannot be bought or sold in the market in Ethiopia, there are only two sources of long term land access for youth. The first one is land allocation from the authorities and the second one is inheritance from parents or other relatives.
3.4.1 Land allocation from authorities
26
Most rural communities have a long waiting list of youth that have applied to get land in the community. In many places they have started to give them a small plot for building a house but too small to be used for farming purposes.
In our sample, a total of 95 youth reported to have secured some kind of access to farm land. However, only 6 obtained land from the land administrative authorities. This demonstrates that land access no longer serves as a safety net for youth.
3.4.2 Inheritance from parents
Household heads were asked if they have transferred any land to their children so far. Table 3.9 shows that 35% of the households reported that they have done so. Consistent with their larger land holding size, proportionately more households in Shashemene and Arsi Negelle bequeathed land to their children than household in other sites. The proportion of households in Wollaita that bequeathed land to their children is the lowest of the five districts. Only 24% of households in Wollaita had transferred some land to their children while in Arsi Negelle 47% have done so. But the average farm size in Arsi Negelle is also almost three times that of Wollaita.
27
Table 3.9. Past land bequeath and current farm sizes by district
District Gave to children part of farm in the past (%)
Average farm size
(hectares) Total
Shashemene 46 1.15 102
Arsi Negelle 47 1.38 145
Wondo Genet 33 0.55 122
Wollaita 24 0.52 197
Wondo Oromia 30 0.84 40
All 35 0.86 603
[image:29.612.73.502.308.482.2]Source: Own survey data
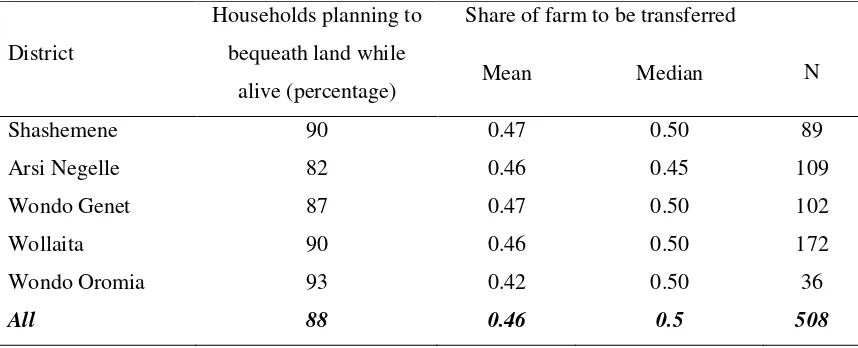
Table 3.10. Future land bequeath by district
District
Households planning to bequeath land while
alive (percentage)
Share of farm to be transferred
N
Mean Median
Shashemene 90 0.47 0.50 89
Arsi Negelle 82 0.46 0.45 109
Wondo Genet 87 0.47 0.50 102
Wollaita 90 0.46 0.50 172
Wondo Oromia 93 0.42 0.50 36
All 88 0.46 0.5 508
Source: Own survey data
28
Table 3.11. Plots household heads prefer to bequeath to their children
Type of plot Respondent (%)
Plots further from homestead 30
Plots closer to homestead 40
The less fertile land 3
The more fertile land 13
No particular choice 12
Other criterion 2
Total 100
Source: Own survey data
It appears that parents have to hold on to their land to maintain their family and transfer part of their land as the need arises. With the new legal restrictions on farm sizes of 0.5 hectares in the annual cropping systems (Shashemene, Arsi Negelle and Wondo-Oromia) and 0.25 hectares in the perennial zones (Wollaita and Wondo Genet) this may imply only informal land transfers to children in case of very small farm sizes.
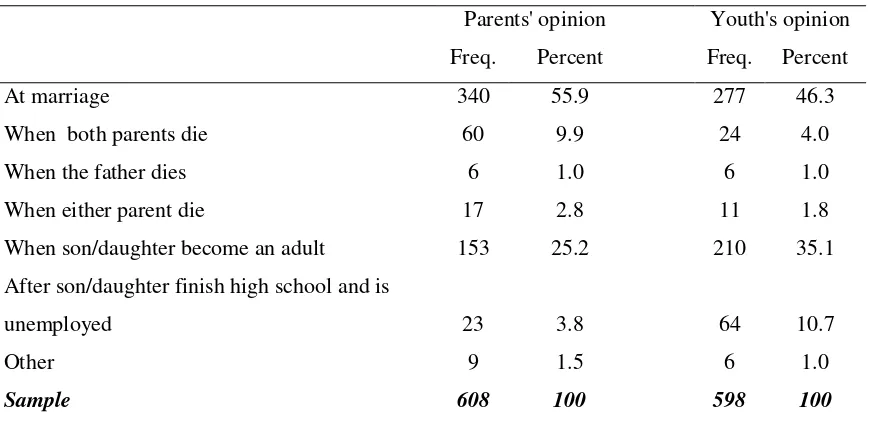
We asked the parents and the youth for their opinion on the most appropriate ‘time’ to transfer
land from parents to children. Table 3.12 summarizes the responses for both parties. Most of the parents and youth believe that marriage is the most appropriate occasion for a transfer of land from parent to children. However, proportionately more parents (60%) than youth (46%) choose marriage as the most appropriate time for land transfer. On the other hand, the percentage of youth who elected adulthood as the most appropriate time for land transfer is 35%, 10 percentage points higher than parents that elected the same. In general while marriage seems to be the accepted time that most parents and children expect the land transfer to happen, the youth prefer
29
Table 3.12. Appropriate time to transfer land from parents to youth
Parents' opinion Youth's opinion
Freq. Percent Freq. Percent
At marriage 340 55.9 277 46.3
When both parents die 60 9.9 24 4.0
When the father dies 6 1.0 6 1.0
When either parent die 17 2.8 11 1.8
When son/daughter become an adult 153 25.2 210 35.1 After son/daughter finish high school and is
unemployed 23 3.8 64 10.7
Other 9 1.5 6 1.0
Sample 608 100 598 100
Source: Own survey data
3.5
Land bequeath to female children30
Table 3.13. Households who intend to bequeath land to female offspring
District Percentage
Shashemene 34.7
Arsi Negelle 43.8
Wondo Genet 30.9
Wollaita 6.1
Wondo Oromia 42.5
All households 27.2
Source: Own survey data
We expected that land certification increases the probability of daughters inheriting land from
parents as their names are typically registered in relation to households’ land holding and on the
land certificates. However, this does not seem to make any difference in the study areas. The proportion of household heads who intend to bequeath land to their daughters does not differ by their land certificate status. Similarly, female-headed households are not more likely to bequeath land to their daughters. In fact, the proportion of female-headed households is smaller in the inheritors group, although the difference is significant only at 10%. But it seems that education has better impact on land inheritance to daughters. Household heads in daughter inheriting households have on average 4 years of education while those who will not inherit have an average of 2.8 years of education and the difference is statistically significant at 1% level of significance. Daughter inheriting households also have higher per capita land holding indicating that land scarcity may contribute to households excluding their daughters from inheritance.
Table 3.14. Household characteristics by decision to inherit female children in the future
Will daughters inherit? Significant
test
Household character No Yes Total
Education of household head(yrs) 2.80 4.10 3.16 ****
Age of household head 43.44 44.30 43.67
Female headed household (yes=1) 0.12 0.08 0.11 * Per capita land holding (hectares) 0.13 0.18 0.14 **** Household have land certificate 0.82 0.84 0.83
31
But what do the female youth themselves think about this? Table 3.15 provides some evidence. Young women have lower expectation regarding land inheritance than their brothers/male counterpart, but their expectation is certainly higher than their parents are ready for. While 74% of young men who have not previously received land from their parents expect to inherit in the future, only 41% of young women do. Young women are also less likely to engage in
[image:33.612.72.495.333.456.2]agricultural activity on the family farm. While 89% of young men engage in household farm activity in some capacity, only 67% of young women do. The lower farm involvement is perhaps due to the gender division of labor in Ethiopia where women are typically primarily responsible for household chores. But the lower expectation to inherit land may contribute to disinterest on the part of the female youth and their parents to engage them in agriculture. These differences are highly statistically significant.
Table 3.15. Male and female youth land expectation and farm participation
Male Youth
(%) N
Significant test
Female Youth
(%) N
All sample (%) Participate in household farming 89 353 **** 67 242 80 Try to get land access 45 350 **** 23 242 36 Expect land from parent 74 310 **** 41 235 60
Source: Own survey data
3.6
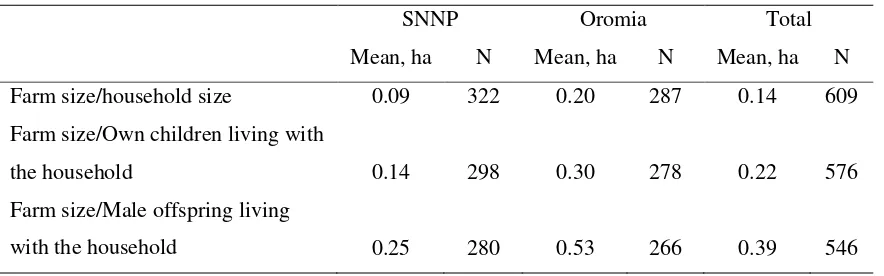
Small land, many inheritorsAs we have seen so far, farm sizes in our study areas are small relative to their household size. Table 3.16 shows how much land each offspring may receive if land was to be divided equally after the death of their parents or in the event that parents choose to transfer all land and retire.
The 2005 land law states that “where rural land is transferred by succession, it shall be made in such a way that the size of the land to be transferred is not less than the minimum size holding”
32
Table 3.16. Farm size in relation to potential inheritors
SNNP Oromia Total
Mean, ha N Mean, ha N Mean, ha N
Farm size/household size 0.09 322 0.20 287 0.14 609 Farm size/Own children living with
the household 0.14 298 0.30 278 0.22 576
Farm size/Male offspring living
with the household 0.25 280 0.53 266 0.39 546
Source: Own survey data
What is clear from Table 3.16 is that if all sons and daughters of the household inherit, there is not enough land to meet the minimum holding size requirement or to make a meaningful livelihood out of it. Even if farmers are to bequeath all land only to their male children, the average land that each receives will still be below the minimum size for a large share of the households. Under these circumstances one option of maintaining land access for all the children will be co-management where the land is registered as a single unit with all inheritors’ names listed as holders on the land certificate. This will solve the problem with minimum legal holding size but not necessarily the concern for household food security unless supplementary sources of income can be found.
To make a meaningful livelihood out of the small farm sizes some of the inheritors may also willingly give up their entitlement on the land or the parents may decide to bequeath the land to only some of their children. Our survey indicates that such options have been adopted by some of the households. Interview with the youth indicated that 40% of the youth who have not received land from their parents do not expect to inherit in the future (see Table 3.15) and proportionately fewer women expect to inherit land. For both male and female youth the
33
factors could affect the level of trust, generosity and willingness to cooperate on land
management within families. Better off-farm employment opportunities due to rapid economic growth in the country may reduce the pressure and facilitate that youth can find other livelihood opportunities outside their family farm.
3.7
Land co-management with siblings and parentsAs we have indicated earlier co-management of land is likely to increase in importance as further land division violates the minimum land holding legislated in the land laws. Already we observe significant management of land in our sample. 36% of youth reported that they have managed land with their parents and 21% with their siblings. The percentage of youth that co-managed land with their siblings is not much different across the different zones but
proportionately more youth co-managed land with their parents in Western Oromia than in the two SNNP zones Sidama and Wollaita.
34
Table 3.17 Land co-management and conflict experience with siblings and parents
Youth land co-management experience
Percentage of youth respondent
Oromia Sidama Wollaita All
Co-managed land with siblings 21 24 20 21
Conflict experience during co-management
frequent 5 0 3 3
Sometimes/rarely 18 15 59 27
Never 77 85 38 70
Co-managed land with parents 49 18 23 36
Conflict experience during co-management
frequent 5 0 3 4
Sometimes/rarely 17 18 59 23
Never 78 82 38 73
Source: Own survey data
3.8
Land scarcity and youth livelihood strategiesMost of the youth from the rural areas we studied do not plan to follow the footsteps of their parents. Table 3.18 summarizes what the youth reported as their planned or preferred future livelihood strategy.
35
Table 3.18. Summary of preferred livelihood choices by youth in Southern Ethiopia
Livelihood Choice Freq. Percent
Farming 56 9.4
Non-farm wage employment 17 2.9
Non-farm self-employment and business 177 29.9
Urban salaried employment 343 57.8
Total 593 100
Most of those who intend to engage in farming either plan to take over the farm from parents or farm together with parents. Although resettlement has been considered a way out of the land scarcity problem particularly in SNNP, only 1 person in our sample plans to resettle. It may be because resettlement is not something that they can plan on as the authorities are the ones that decide whether to have a resettlement program, the place of resettlement and who should be allowed to resettle. But this may also be an indication of lack of interest in or knowledge of the resettlement opportunity. Urban salaried employment includes those who want to work in government offices or private companies. About half of these want to go for higher education as the first step.
36
Table 3.19. Land holding and wealth of parents of the youth by livelihood choice
Livelihood Choice
Landholding (in hectares)
Current and durable
assets (in’000 EB5)
Livestock holding (in TLU)
Median Std. Dev Median Std. Dev Median Std. Dev
Farming 1.25 0.92 1750 27.87 2.19 3.65
Off-farm wage employment 0.50 0.88 720 1.02 2.57 2.23
Non-farm self-employment
and business 0.75 0.80 1845 23.60 2.10 4.23
Urban salaried employment 1.00 0.88 2025 67.62 2.80 5.31
Total 0.88 0.86 1901 16.23 2.40 4.81
This statistics seem to be in line with earlier studies of nonfarm employment in Ethiopia where unskilled off-farm wage employment is shown to be the least paying of the nonfarm employment opportunities and attracts the most desperate ones because it does not have an entry barrier (Woldenhanna and Oskam 2001, Bezu and Barrett 2012). However, entry barriers may even exist for unskilled off-farm wage employment in Ethiopia due to search costs, seasonality in access, and risk/uncertainty related to finding such employment (Holden et al. 2004).
To analyze the factors driving a livelihood choice in more detail, we estimated a multinomial model where we explore the correlation between individual and household characteristics and livelihood choices. The result from the multinomial model is reported in table 3.20. We
estimated two models progressively including more variables to assess the correlations. The first model includes individual characteristics of the youth, per capita landholding and household characteristics. These factors are expected to influence how one views farming and the potential success in agricultural and non-agricultural livelihood. The second model includes siblings’
involvement in business, migration and nonfarm employment in rural areas since these also may affect the youth information, network, experience and motivation. The second model also includes district dummies to test if livelihood choice differs by the place of residence in rural areas. The district dummies also control for different access to infrastructure, information and agro-ecological conditions. Because we have more than one youth per household, the standard
5
37
errors are corrected for clustering at household level. The likelihood statistics show that inclusion of the additional factors improves the explanatory power of the models. The results are otherwise largely consistent across the two models. The reference livelihood category in the reported model is farming.
First we discuss the coefficient on the farm size variable. The magnitudes of coefficients in a multinomial model are difficult to interpret directly (Wooldridge 2002), but we are most
interested in the direction of correlation between livelihood choice and the covariates. Looking at the magnitudes should be enough to evaluate the relative importance. Farm size has a
consistently negative and statistically significant correlation with choice of livelihood outside of agriculture. An increase in the per capita farm size of the household decreases the likelihood of young men and women to choose livelihood outside of agriculture. This indicates that an important factor driving rural youth away from farming is lack of land access. The marginal effect on farm choice (given in Appendix 2) shows that farm size has the highest marginal effect on the probability of the farming choice.
Moving to other covariates, we see that young women are more likely to choose urban salaried employment relative to farming. This is perhaps the cultural influence since in most parts of Ethiopia agriculture is typically men’s domain. Controlling for the age factor younger
respondents who are currently studying are more likely to choose the urban salaried employment than those who are not students anymore. This may be because they have yet a higher hope of achieving their objective through education than those who are not studying anymore. More education in terms of number of years of successfully completed grades increases the likelihood of choosing urban salaried employment. This is perhaps because in addition to the impact of
information on one’s interest, increase in educational achievement increases one’s expectation of
38
Married people have family responsibilities and are therefore more likely to settle for what is available in the village. Marital status also has a negative correlation with off-farm business but is statistically significant only at 10%.
Household characteristics have little effect on livelihood choice except assets owned. The value of assets owned by the household to which the young person belongs was negatively correlated with the likelihood of choice of off-farm wage employment as a livelihood. This may indicate that better-off households prefer agriculture to off-farm wage employment. We also found that having brothers and sister who are engaged in business was positively correlated with the likelihood of choosing off-farm business.
Compared to Shashemene, young people from Arsi Negelle and Wollaita were more likely to choose off-farm business and salaried employment than agriculture. This may be an indication that farming activity in Shashemene is more rewarding than in these other two districts. Farming in Wollaita is subsistence oriented and farm size in the area is very small. And, while farms in Arsi Negelle are on average larger, some of the villages have been food insecure over the past indicating poor performance of agriculture.
Youth in Wondo Genet were less likely to choose off-farm wage employment than farming. This is to be expected since Wondo Genet is a cash crop production area where agriculture perhaps yields higher returns than off-farm wage employment. On the other hand young people in
39
Table 3.20. Multinomial model of determinants of livelihood choice by female and male youth in Southern Ethiopia
Off-farm wage employment Off-farm self
employment and business Urban salaried employment
Variables Model 1 Model 2 Model 1 Model 2 Model 1 Model 2
Female youth -0.333 0.087 0.306 0.491 0.740* 0.950**
(0.70) (0.74) (0.41) (0.43) (0.40) (0.43)
Age -0.108 -0.144 -0.013 -0.031 -0.087 -0.100
(0.11) (0.11) (0.06) (0.06) (0.06) (0.07) Education (years) 0.265 0.362* 0.067 0.116* 0.229**** 0.274****
(0.18) (0.19) (0.05) (0.06) (0.06) (0.07) Currently student 0.930 1.303 -0.108 0.131 1.872**** 2.298****
(0.92) (1.06) (0.43) (0.44) (0.44) (0.46) First born -14.213**** -15.475**** -0.416 -0.283 -0.175 -0.087
(0.48) (0.52) (0.42) (0.44) (0.42) (0.44)
Married -0.927 -0.650 -0.661 -0.459 -1.384*** -1.159**
(1.02) (0.96) (0.45) (0.45) (0.50) (0.53) Farm size -5.329* -7.559* -2.691*** -2.616*** -2.205*** -2.703***
(2.99) (4.35) (0.86) (0.86) (0.70) (0.91) Age of household head -0.019 -0.005 0.003 0.007 0.007 0.013 (0.02) (0.02) (0.01) (0.01) (0.01) (0.01) Education of household head(years) 0.127 0.072 -0.080 -0.112* -0.010 -0.054
40
Number of sibling migrated -0.362 -0.112 -0.175
(0.34) (0.17) (0.16)
Number of siblings in business -0.173 0.739** 0.568
(0.86) (0.37) (0.38)
Number of sibling in nonfarm employment 0.436 0.054 -0.088
(0.59) (0.17) (0.18)
Arsi Negelle 1.825 1.088** 1.654***
(1.39) (0.54) (0.51)
Wondo Genet -14.682**** 0.448 0.349
(1.30) (0.59) (0.64)
Wollaita 2.408** 1.701*** 2.030***
(1.14) (0.60) (0.65)
Wondo-Oromia 3.618* 0.527 1.598**
(2.09) (0.63) (0.64)
Constant 8.005** 6.141 0.502 -1.929 0.804 -1.884
(3.57) (4.15) (1.62) (1.93) (1.77) (2.06)
Prob > chi2 0.000 0.000 0.000
Loglikelihood -472.458 -407.336 -400.825
Number of Obs. 566 535 535
41
In summary it appears that young people choose unskilled off-farm wage employment as a result of desperation because of lack of land access and viable livelihood opportunities (push factors), while the urban salaried employment seems to be an attractive opportunity for those with resources, education and flexibility to explore such opportunities (pull factors). This is in line with findings in the income diversification literature which documents that
participation in unskilled off-farm wage employment is driven by poor performance and risk in the agricultural sector (see Reardon 1997).
3.9
Land scarcity and migrationWe will now assess factors associated with the recent migration of youth from our study areas. We distinguish between the different locations to which household youth members have migrated. Table 3.21 gives an overview by sample origin and destinations. The values in the table represent the percentage of youth population in the sample that has migrated to different locations. We see that 15% of the youth and adolescent in 2007 have migrated by 2012.
Table 3.21. Overview of youth migration from study areas
District Name
Migration by destination (% of youth who migrated)
Abroad Addis Ababa Other city Other Rural
Areas All N
Shashemene 1.2 0 1.2 2.1 4.6 241
Arsi Negelle 2.5 1.2 6.2 1.2 11.2 401
Wondo Genet 0.6 2.5 3.4 0 6.5 325
Wollaita 0.2 5.1 21.6 4.4 31.3 450
Wondo Oromia 0 0 1.6 0 1.6 64
Total 1.1 2.4 9.3 2 14.8 1481
Note: Percentage of youth and adolescent (10-30 years old) who migrated between 2007 and 2013 Source: Own data
We see that Wollaita has the largest migration rate, 31%, of the 10-30 year-olds in2007 have migrated by 2012. The majority migrated to urban areas other than Addis Ababa. From informal discussions we learned that youth from Wollaita has in the recent years ‘taken over the shoe shiner market’ in Addis Ababa indicating that the high level of migration in our
42
of migration can really explode when the internal population pressure in a subsistence
community has reached a level beyond its carrying capacity. With continued rural population growth more and more rural communities will soon reach similar and comparable situations for their youth populations.
Arsi Negelle is the district with second most outmigration of youth with 11% youth migration in our sample households. This is an area with less population pressure but it is favorably located along the main road between Addis Ababa and Awassa and pull factors may here be more important than push factors. The entry barrier may also be lower here for the youth due to the favorable location reducing their search and travel costs related to exploring the off-farm opportunities. Overall, we see that most of the youth migration is rural-urban, as only 2% of the youth have migrated to other rural areas while total migration was 15% of the youth.
To further assess the various individual, household and district factors associated with youth migration we ran probit models for the decision to migrate. We report in Table 3.22 results from probit model on all migration and a separate estimation for the dominant type of migration- rural-urban migration.6 The first models include individual and household level determinants while the second model further incorporate the district dummies as they capture meso-level determinants such as infrastructure, market access, population pressure and agro-ecology.
Table 3.22 shows that education is a strong driver of youth migration. Education level was strongly positively associated with all kinds of migration. Education brings information about
opportunities outside of one’s immediate surrounding and raises expectation for better life
there by encouraging youth to explore new opportunities.
We see that the farm size variable has a negative sign and show statistical significance in the rural- urban migration and all migration models. This indicates that households with smaller farm sizes are more likely to see their youth members migrate. However, the farm size variable becomes insignificant when we include district dummies. This is perhaps because farm sizes are strongly correlated with the district dummies. Particularly, the Wollaita
dummy is likely to capture the farm size effect. An alternative aspect and interpretation of the
6
43
vanishing significance after including the district dummies is that youth may not migrate alone and this may be a wise strategy when they go to unexplored territory. Smaller individual farm size variation within communities may then not be as important for the migration decision as whether individual youth have other youth in the community that s/he may coordinate migration with.
Overall, we see that livestock-poor households are more likely to have migrating youth members. This seems to be another push factor as livestock keeping may be a youth
[image:45.595.68.499.305.766.2]livelihood opportunity or looking after family livestock is one of the things that link youth to the land.
Table 3.22. Factors associated with household member migration decisions
All migration Migrate to urban areas
Model1 Model 2 Model1 Model 2
Female youth -0.024 0.010 -0.053 -0.037
(0.090) (0.090) (0.090) (0.100)
Age -0.016 -0.037 0.024 0.012
(0.070) (0.070) (0.070) (0.070)
Age, squared 0.001 0.001 0.000 0.000
(0.000) (0.000) (0.000) (0.000) Education level 0.103**** 0.110**** 0.104**** 0.109****
(0.020) (0.020) (0.020) (0.020) Ln(Farm size), ha -0.165*** -0.030 -0.230**** -0.063 (0.060) (0.070) (0.070) (0.090)
Female headed -0.256 -0.243 -0.212 -0.194
(0.180) (0.180) (0.200) (0.190) Age of Household head -0.007 -0.003 -0.009 -0.005 (0.010) (0.010) (0.010) (0.010) Education household head -0.008 -0.005 -0.009 -0.007 (0.020) (0.020) (0.020) (0.020)
Male work force -0.016 0.011 0.008 0.039
(0.040) (0.040) (0.050) (0.050)
Female work force -0.033 -0.022 -0.049 -0.030
(0.050) (0.050) (0.060) (0.060)
44
(0.020) (0.030) (0.030) (0.030) Livestock (in tlu) -0.048*** -0.029** -0.061*** -0.037 (0.020) (0.010) (0.020) (0.020)
District dummies: Baseline=Sashemene
Arsi Negelle 0.365** 0.805**
(0.180) (0.390)
Wondo Genet -0.073 0.493
(0.240) (0.380)
Wollaita 1.102**** 1.620****
(0.180) (0.350)
Wondo Oromia -0.428 0.283
(0.400) (0.510)
Constant -1.206* -1.731** -1.688** -2.726****
(0.630) (0.680) (0.680) (0.790)
Prob > chi2 0.000 0.000 0.000 0.000
Loglikelihood -541.32 -486.03 -448.72 -395.69
Number of observations 1393 1393 1393 1393
Note: Probit estimates of migration decision for adolescents and youth (age >10 & <30) 2007-2013. Standard errors corrected for clustering at household level. Significance levels: *: 10%, **: 5%, ***: 1%, ****: 0.1%.
3.10
Land scarcity and nutritional outcome for youthWe wanted to assess how land scarcity affects the nutritional status of youth staying on the farms and whether the nutritional status is poorer for youth staying on very small farms. Such a finding could signal a kind of Malthusian effect and a poverty trap. We have regressed the Body Mass Index (BMI) of youth on individual, household and district dummy variables. The results are presented in Table 3.22. BMI captures the current nutritional situation in the communities and is thus a short-term measure.
45
vent for the population pressure. BMI is higher for older youth.Table 3.23. Factors
associated with Body Mass Index (BMI) of youth staying on their family farm
Coefficient Robust st. err.
Female, dummy 0.366 0.551
Age of youth 0.115 ** 0.049
Age of household head 0.005 0.013
Education household head -0.08 0.121
Female headed household -1.375 1.394
Farm size per capita -0.369 0.379
Total household size -0.051 0.085
District dummies: Baseline=Sashemene
Arsi Negelle -1.662 *** 0.513
Wondo Genet -1.646 *** 0.48
Wollaita 0.646 1.615
Wondo Oromia -2.097 *** 0.507
Constant 19.57 *** 2.023
Prob > F 0.000
R-squared 0.0237
Number of observations 584
Note: OLS of BMI, controlling for clustering at household level. Significance levels: *: 10%, **: 5%, ***: 1%, ****: 0.1%.
As an additional test we have assessed factors correlated with the probability that youth are underweight where underweight is identified as individuals with BMI<18.5. The results of a probit model are presented in Table 3.24.
[image:47.595.79.458.136.461.2]The results are quite consistent with those in Table 3.23. Land holding was not correlated with short term nutritional status of the youth in our sample. Table 3.24 shows in addition that female youth on the farm has a lower likelihood of being underweight than male youth. Older youth are also less likely to be underweight than younger youth. Both these variables were significant at 1% level. For the district dummies it appears that youth in Sashemene (the baseline district) were less likely to be underweight than those in other districts.