ISSN Online: 2329-8448 ISSN Print: 2329-843X
Evaluation of TB Patients Characteristics Based
on Predictive Data Mining Approaches
Farzad Firuzi Jahantigh
1, Hakimeh Ameri
2*1Industrial Engineering Department, University of Sistanand Baluchestan, Zahedan, Iran 2Industrial Engineering Department, Khaje Nasir Toosi University of Technology, Tehran, Iran
Abstract
According to the World Health Organization, Tb is the biggest cause of death among the infectious diseases. Due to the high percentage of people with tu-berculosis infection and the high number of death among these patients, this study is a prospective study aimed to categorize and find the relationship be-tween different clinical and demographic characteristics. The study was con-ducted on 600 patients from Masih-e-Daneshvari tuberculosis research center during 2015-2016. The K-Means clustering data mining algorithms and deci-sion trees are used to perform the categorization and determine common in-dicators among patients. 2 clusters according to Dunn index were chosen as the optimal clusters. Common factors between clusters are provided in detail in the findings section. According to the results of this study, the most impor-tant factors identified by the clustering include hemoglobin, age, sex, smok-ing, alcohol consumption and creatinine. The RBF neural network tree has 98% accuracy. According to the results of this study, the most important fac-tors identified are sex, smoking, alcohol consumption and WBC, albumin.
Keywords
TB Patients, Clustering, Decision Tree, Neural Network
1. Introduction
Almost a third of the world population (around 2 billion people) are infected by TB and at the risk of infection by this fatal disease. According to the World Health Organization report, 9 million people have been infected by active TB and about 1.5 to 2 million people lose their lives annually due to this disease. TB which is the biggest cause of death among uni-factorial infectious disease (even more than AIDS, malaria and measles), ranks the tenth among global disease and it is projected that maintain its current position by 2020 (or rise to the se-How to cite this paper: Jahantigh, F.F. and
Ameri, H. (2017) Evaluation of TB Patients Characteristics Based on Predictive Data Mining Approaches. Journal of Tuberculo-sis Research, 5, 13-22.
https://doi.org/10.4236/jtr.2017.51002
Received: August 1, 2016 Accepted: February 13, 2017 Published: February 16, 2017
Copyright © 2017 by authors and Scientific Research Publishing Inc. This work is licensed under the Creative Commons Attribution International License (CC BY 4.0).
venth place) [1]. Tuberculosis is one of the oldest human diseases with the high-est mortality rate among infectious diseases which has attracted the attention of the world. The death rate from tuberculosis since 1990 has decreased by 41% and the goal of achieving a 50% reduction by 2015 is determined about that. However, the global burden of tuberculosis is still great. In 2011, there was an estimation of 8.7 million new TB cases (13% infection with HIV). TB contri-buted to one third of the 1.2 million deaths from HIV/AIDS and HIV was re-sponsible for 25% of the 1.5 million TB deaths and 1.4 million people had lost their lives due to tuberculosis.
Data mining is one of the new fields which can extract useful information and patterns using statistical data. Data mining represents a significant advance in a variety of available analytical tools and is considered as a reliable, sensitive and valid method to discover patterns and relationships between data [2]. One of the fields that we can use this knowledge effectively and achieve remarkable results is medical data. Enhancing accuracy, reducing costs and human resources have been proven by Khajavi and Jayalakshy [3] [4] as the benefits of data mining in medical analysis. Classification of data mining in medicine includes investigat-ing the effect of the drug on the disease, identifyinvestigat-ing the side effects of medica-tions, specifying the type of treatment, the analysis of data available in Electronic Health Records (EHR), diagnosis and prognosis of diseases such as cancer, anal-ysis of medical images such as mammography, ultrasonic, X-ray and MRI, pro-viding descriptive models based on medical data, controlling the hospital infec-tion and utilizainfec-tion of health services [5]. Alizadeh et al. (2014) for example, have identified and introduced most influential factors on osteoporosis using the C.5.0, CHAID algorithms and artificial neural network. The effective characte-ristics of the disease have been identified using data mining and its methods. Some rules are derived using decision tree that can be used as a model to predict the patient’s status. The precision of built models using C.5.0, CHAID algo-rithms and artificial neural network is compared with each other. The results of this comparison show that all of these algorithms have shown better perfor-mance in group predicting of people [6].
Many studies on lung diseases, particularly tuberculosis were conducted using data mining techniques. The conducted studies can be divided to 3 main groups. The first group is categorized as forecasting the TB type. Nagabhushanam et al. (2013) used multi-layer Neural Networks and ANFIS with 97% precision to pre-dict tuberculosis, which is in this group [7]. The second category is TB diagnosis. Tamer et al. (2012) created a method using ANFIS and hard sets algorithm to di-agnose the TB with 97% and 92% precision level of the model respectively, which is in the second category [8]. And the last group is categorizing TB patients. Ka-rahuka et al. (2011) classified TB patients based on the laboratory and demo-graphic characteristics using neural networks and ANFIS with 97% precision [9].
identify these people with the hope that it can be possible to diagnose the TB disease faster and more accurately with the proper patterns, so that as a result the number of patients with multidrug-resistant tuberculosis bacilli (MDR-TB) is reduced.
2. Proposed Classification Methodology
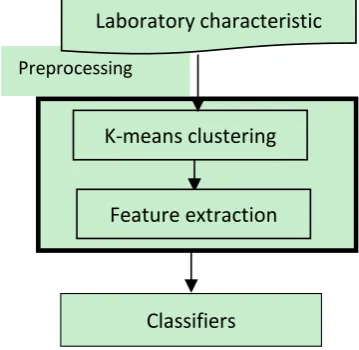
Our proposed method consists of two main steps: preprocessing phase and clas-sification phase, as illustrated in Figure 1. In the first phase, preprocessing steps are performed in order to find most important characteristics; these steps consist of applying Kmeans algorithm to cluster features. In the second phase, different Artificial Neural Networks algorithm is used as a classification algorithm to clas-sify those informative characteristics.
2.1. Materials and Methods
In addition to relevant data, an appropriate process and data mining methods should also be used to have an effective data mining process. The way includes all the data mining steps, from data collection, data preparation, modelling and evaluation [10]. Therefore, based on the CRISP (Cross Industry Process for Data Mining) methodology, the data mining process of the current study is com-pleted.
2.2. Data Pre Processing
[image:3.595.282.462.541.716.2]We conduct collecting data, describing and reviewing them, inspecting and va-lidating the quality of the data in this phase. The required data is collected from Masih-e-Daneshvari TB research center of Tehran during 2015-2016. There were 600 primary records from patients; after filtering and removal of records that they didn’t consist of primary information, we achieved 525 final records. The average age of patients was 53 years. 50 percent of patients were men and the rest were women. 83 percent of patients had contact with TB patients. La-boratory characteristics of patients were investigated and identified in this stage.
Figure 1. The proposed model.
Preprocessing
Laboratory characteristic
K-means clustering
Feature extraction
The data processing is used to remove a number of inconsistencies and in-complete data associated with the data. Many data processing techniques are developed by Chin et.al and Hen et al. [10] [11] [12]. In this study, the items with zero value for laboratory and demographic characteristics are removed. Chen et al. [13] demonstrated that the wise removal is an efficient method in-stead of replacing values with techniques such as mean, random assignment, the regression assignment and Bayesian model.
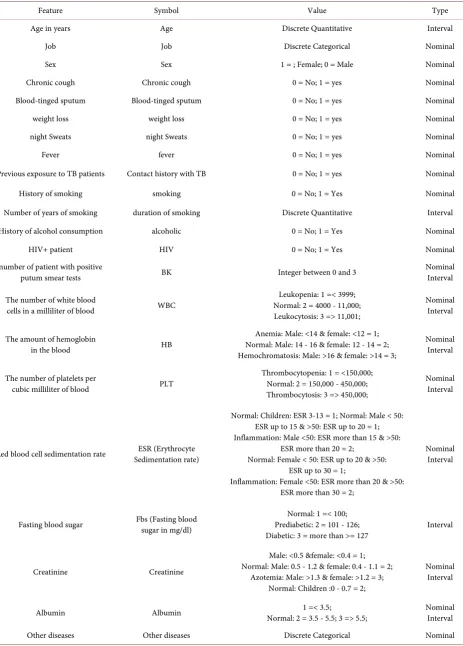
the number of white blood cells (WBC), the amount of hemoglobin in blood (HB), platelet count (PLT), erythrocyte sedimentation rate (Erythrocyte sedi-mentation rate), fasting blood sugar (FBS), Creatinine and Albumin variables with numerical values as range are used and coded based on scientific valid re-sources and sites [14] [15] [16] [17] and approval by a physician. As a result, af-ter refining the data records we got the records with the characaf-teristics in Table 1.
2.3. Modeling and Assessment
There are many data mining methods for modeling. Clustering medical data into small yet meaningful clusters can aid in the discovery of patterns by supporting the extraction of numerous appropriate features from each of the clusters there-by introducing structure into the data and aiding the application of conventional data mining techniques. In this phase, we find the model and optimum pattern using data mining techniques. Clustering is an unsupervised method that groups the similar samples in terms of the data volume. Data are entered into the K-means model to perform the clustering. The clustering is a form of learning by observation. With clustering, similar samples are placed in the same group [10]. Here, k-means algorithm assumes that each data point has a single comparable numeric value. Otherwise, when the data points have multi-attribute values, as it is the case in our patient data, distance between data points are calculated using Euclidian distance. Assume that two data points d1 and d2 have n attribute values
each: d1 (a11, a12, …, a1n) and d2(a21, a22, …, a2n). Then, the distance between these
two points is calculated as follows:
(
)
(
(
) (
2)
2(
)
2)
1 2 11 21 12 22 1 2
dist d d, =sqart a −a + a −a +…+ an−an (1)
We obtain the optimal clustering using Dunn index from different clusters that we entered as input to the model. The indicator is used to obtain focused clusters with fixed boundaries. Dunn index is calculated as follows:
(
)
( )
(
)
1.. 1..
1..
, max
min m
dia in
m
i j
k nc k
i nc j i nc
d c c D
c
= = +
=
=
(2)
where d (ci, cj) and diam (ci) are calculated as follows:
(
i, min)
x ci y cj€ , €{
(
,)
}
D c cj = d x y (3)
( )
, €{
( )
}
Table 1. Data and corresponding values after preprocessing.
Feature Symbol Value Type
Age in years Age Discrete Quantitative Interval
Job Job Discrete Categorical Nominal
Sex Sex 1 = ; Female; 0 = Male Nominal
Chronic cough Chronic cough 0 = No; 1 = yes Nominal
Blood-tinged sputum Blood-tinged sputum 0 = No; 1 = yes Nominal
weight loss weight loss 0 = No; 1 = yes Nominal
night Sweats night Sweats 0 = No; 1 = yes Nominal
Fever fever 0 = No; 1 = yes Nominal
Previous exposure to TB patients Contact history with TB 0 = No; 1 = yes Nominal
History of smoking smoking 0 = No; 1 = Yes Nominal
Number of years of smoking duration of smoking Discrete Quantitative Interval
History of alcohol consumption alcoholic 0 = No; 1 = Yes Nominal
HIV+ patient HIV 0 = No; 1 = Yes Nominal
number of patient with positive
putum smear tests BK Integer between 0 and 3 Nominal Interval
The number of white blood
cells in a milliliter of blood WBC
Leukopenia: 1 =< 3999; Normal: 2 = 4000 - 11,000; Leukocytosis: 3 => 11,001;
Nominal Interval
The amount of hemoglobin
in the blood HB
Anemia: Male: <14 & female: <12 = 1; Normal: Male: 14 - 16 & female: 12 - 14 = 2; Hemochromatosis: Male: >16 & female: >14 = 3;
Nominal Interval
The number of platelets per
cubic milliliter of blood PLT
Thrombocytopenia: 1 = <150,000; Normal: 2 = 150,000 - 450,000; Thrombocytosis: 3 => 450,000;
Nominal Interval
Red blood cell sedimentation rate Sedimentation rate) ESR (Erythrocyte
Normal: Children: ESR 3-13 = 1; Normal: Male < 50: ESR up to 15 & >50: ESR up to 20 = 1; Inflammation: Male <50: ESR more than 15 & >50:
ESR more than 20 = 2;
Normal: Female < 50: ESR up to 20 & >50: ESR up to 30 = 1;
Inflammation: Female <50: ESR more than 20 & >50: ESR more than 30 = 2;
Nominal Interval
Fasting blood sugar Fbs (Fasting blood sugar in mg/dl) Prediabetic: 2 = 101 - 126; Normal: 1 =< 100;
Diabetic: 3 = more than >= 127 Interval
Creatinine Creatinine
Male: <0.5 &female: <0.4 = 1; Normal: Male: 0.5 - 1.2 & female: 0.4 - 1.1 = 2;
Azotemia: Male: >1.3 & female: >1.2 = 3; Normal: Children :0 - 0.7 = 2;
Nominal Interval
Albumin Albumin Normal: 2 = 3.5 - 5.5; 3 => 5.5; 1 =< 3.5; Nominal Interval
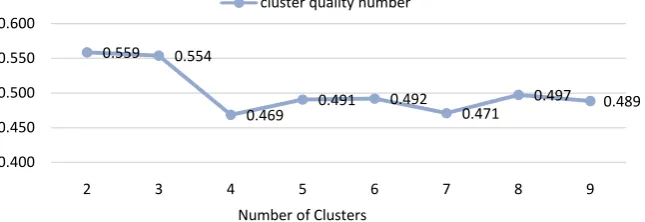
This aims of the indicator is to maximize the within-cluster distance while minimizing inter-cluster distance. It is more favorable that the values of the in-dex are bigger. The number of clusters that increases the value of the inin-dex is the optimal number of clusters [18]. The optimum number of clusters using Dunn index is 2 clusters (Figure 2).
After modeling we should evaluate the results of the modeling. Assessment results are used to improve the model and make it usable. According to the Dunn index, 2 clusters have been chosen as the optimal number. The most im-portant factor in clustering is similarity. This means that objects within a cluster are similar. The similarity of each cluster is evaluated based on the average ob-jects of that cluster. When the obob-jects in each cluster have placed in separate categories and do not interfere with each other, the clustering process is known as optimal. The more focused the clusters are, the more efficient clustering oper-ation is performed. After clustering, most important features are extracted then fed to classifier model.
The model composition is not the end of a project and the aim of the data mining projects is knowledge discovery and applying the discovered knowledge in the future. The discovered Knowledge should be organized and usable for others. The main objective of this project is to find the common features be-tween tuberculosis patients and categorize these patients.
2.4. Findings
The goal of data mining is to extract knowledge from information stored in the database and create a clear and understandable description of patterns. Factors that are recognized in 2 optimum clusters as important factors using the K-Means clustering method include: the number of sputum test, ESR, hemoglo-bin, night sweats, the white blood cells, albumin, age , alcohol consumption, smoking and its duration, fever, AIDS, type of job, weight loss and gender.
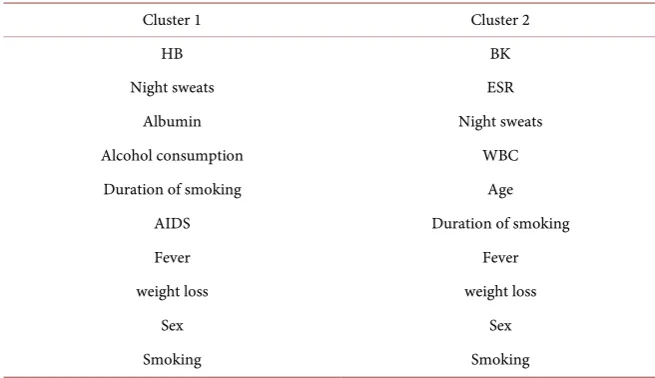
[image:6.595.214.537.605.716.2]Each feature depends on the amount and scope of the changes within the cluster is introduced as an important, not-important or marginal feature. For example, in cluster 1, 264 records include 262 women and 2 men, cluster 2 with a total of 260 records include 257 men and 3 women. So the “sex” feature in all 2 clusters is determined as important factor. Importance factors for each cluster are shown in Table 2. It is obvious from clusters that men and women shows different behaves.
Figure 2. Determining the optimal number of clusters using Dunn index.
0.559 0.554
0.469 0.491 0.492 0.471 0.497 0.489
0.400 0.450 0.500 0.550 0.600
2 3 4 5 6 7 8 9
Table 2. Important features by clusters.
Cluster 2 Cluster 1
BK HB
ESR Night sweats
Night sweats Albumin
WBC Alcohol consumption
Age Duration of smoking
Duration of smoking AIDS
Fever Fever
weight loss weight loss
Sex Sex
Smoking Smoking
After extract important features, the cluster filed added as an output filed. The data set partitioned into two parts, 70% as training and 30% for testing the mod-el. Different decision trees are used and their accuracy is compared in Table 3.
The accuracy of a classifier refers to the ability of a given classifier to correctly predict the class label of new or previously unseen data [12].
Table 3 shows that neural network model with prune method has the highest
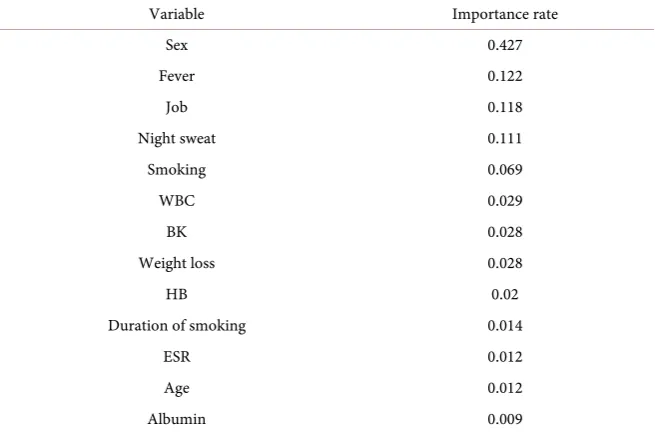
accuracy. Mathematically, neural nets are nonlinear. Each layer represents a non-linear combination of non-linear functions from the previous layer. Some of the more important parameters in terms of training and network capacity are the number of hidden neurons and have the higher importance rate. A method proposed by Garson 1991 identifies the relative importance of explanatory va-riables for specific response vava-riables in a supervised neural network by decon-structing the model weights. The basic idea is that the relative importance (or strength of association) of a specific explanatory variable for a specific response variable can be determined by identifying all weighted connections between the nodes of interest. That is, all weights connecting the specific input node that pass through the hidden layer to the specific response variable are identified. This is repeated for all other explanatory variables until the analyst has a list of all weights that are specific to each input variable. Table 4 shows the variable im-portance and its rates.
3. Discussion
In this study we tried to extract communications between the different characte-ristics of patients with tuberculosis using data mining algorithms. For this pur-pose, we used the K-Means non-supervisory clustering algorithm and decision trees. The most important factors identified by using of neural network include sex, fever, job, night sweat, smoking and WBC.
Table 3. Compare the accuracy of different decision trees.
Model Training accuracy Testing accuracy Average
C 5.0 98.91% 95.54% 97.9%
CHAID 96.46% 94.27% 95.8%
CART 97.28% 95.54% 96.76%
QUEST 96.46% 96.18% 96.37%
Neural network- Quick-method 97.55% 99.36% 98.09%
Neural network- Dynamic-method 97.82% 99.36% 98.28%
Neural network- Multiple-method 98.09% 98.73% 98.28%
Neural network- Prune-method 98.91% 98.73% 98.85%
Table 4. Variable importance of TB patients.
Variable Importance rate
Sex 0.427
Fever 0.122
Job 0.118
Night sweat 0.111
Smoking 0.069
WBC 0.029
BK 0.028
Weight loss 0.028
HB 0.02
Duration of smoking 0.014
ESR 0.012
Age 0.012
Albumin 0.009
clinical and demographic characteristics of TB patients using data mining tech-niques, there was no full report available to us. So we tried to investigate some works closer to our effort.
[image:8.595.211.539.276.493.2]According to the conducted research, most of the factors that have been stu-died include age, cough, sputum, fever, night sweats, weight loss and AIDS. In this study, we have tried to examine these factors as well as clinical and labora-tory factors. The results are approved by physicians.
Our proposal for future work is examining the relation of these characteristics and comorbidities of TB patients with the aim of controlling risk factors and helping to reduce the incidence of these diseases in people with tuberculosis.
References
[1] Nasehim, M.L. (2008) National Guidelines TB. 2nd Edition, Andishmand Publica-tion, Tehran. (Persian)
[2] Al Jarullah, A.A. (2011) Decision Tree Discovery for the Diagnosis of Type II Di-abetes. International Conference on IEEE Innovations in Information Technology (IIT), 25-27 April 2011, 303-307. https://doi.org/10.1109/innovations.2011.5893838 [3] Khajehei, M. and Etemady, F. (2010) Data Mining and Medical Research Studies.
Cimsim. 2nd International Conference on Computational Intelligence, Modelling and Simulation, 28-30 September 2010, 119-122.
https://doi.org/10.1109/CIMSiM.2010.24
[4] Jayalakshmi, T. and Santhakumaran, A. (2010) A Novel Classification Method for Diagnosis of Diabetes Mellitus Using Artificial Neural Networks. International Conference on IEEE Data Storage and Data Engineering (DSDE), 9-10 February 2010, 159-163. https://doi.org/10.1109/dsde.2010.58
[5] Ameri, H. (2013) Using Data Mining in Diabetes. Master of Science Seminar in In-formation Technology (Ecommerce), K. N. Toosi University of Technology. (Per-sian)
[6] Ameri, H., Alizadeh, S. and Hadizadeh, M. (2014) Assessing the Effects of Infertility Treatment Drugs Using Clustering Algorithms and Data Mining Techniques. Jour-nal of Mazandaran University of Medical Sciences, 24, 26-35. (Persian)
[7] Nagabhushanam, D., Naresh, N., Raghunath, A. and Praveen Kumar, K. (2013) Prediction of Tuberculosis Using Data Mining Techniques on Indian Patient’s Data. IJCST, 4, 262-265.
[8] Uçar, T., Karahoca, A. and Karahoca, D. (2012) Tuberculosis Disease Diagnosis by Using Adaptive Neuro Fuzzy Inference System and Rough Sets. Neural Computing & Applications, 23.
[9] Uçar, T. and Karahoca, A. (2011) Predicting Existence of Mycobacterium tubercu-losis on Patients Using Data Mining Approaches. Procedia Computer Science, 3, 1404-1411. https://doi.org/10.1016/j.procs.2011.01.022
[10] Han, J. and Kamber, M. (2006) Chapter 1: Introduction: Data Mining: Concepts and Techniques. 2nd Edition, Morgan Kaufman Publisher, San Francisco.
[11] Rusdah, E.W. (2013) Review on Data Mining Methods for Tuberculosis Diagnosis. Information Systems International Conference (ISICO), Bali, 2-4 December 2013, 563-568.
[12] Newman, D.S., Hettich, J., Blake, C.L.S. and Merz, C.J. (1998) UCI Repository of Machine Learning Databases. University of California, Department of Information and Computer Science, Irvine.
[14] Burris, C.A., Ashwood, E.R. and Burns, D.E. (2006) Tietz Textbook of Clinical Chemistry and Molecular Diagnostics. 4th Edition, Elsivier Saunders, St. Louis, 962-967.
[15] McPherson, R.A., Mattew, R. and Princus, M.R. (2011) Henry’s Clinical Diagnosis and Management by Laboratory Methods. 22th Edition, Elsivier Saunders, Phila-delphia, 254-255.
[16] McPherson, R.A. and Pincous, M.R. (2011) Henry’s Clinical Diagnosis and Man-agement by Laboratory Methods: Expert Consult-Online and Print. 22th Edition, Saunders, Philadelphia.
[17] Lujambio, I., Sottolano, M., Luzardo, L., Robinia, S., Krul, N., Thijs, L., et al. (2014) Estimation of Glomerular Filtration Rate Based on Serum Crystain C versus Creati-nine in Uruguayan Population. International Journal of Nephrology, 2014, Article ID: 837106.https://doi.org/10.1155/2014/837106
[18] Alizadeh, S., Ghazanfari, M. and Teimorpour, B. (2011) Data Mining and Know-ledge Discovery. 2nd Edition, Publication of Iran University of Science and Tech-nology, Tehran. (In Persian)
[19] Asha, T., Natarajan, S. and Murthy, K.N.B. (2011) A Data Mining Approach to the Diagnosis of Tuberculosis by Cascading Clustering and Classification. Journal of Computing, 3.
[20] Bakar, A.A. and Febriyani, F. (2007) Rough Neural Network Model for Tuberculosis Patient Categorization. Proceedings of the International Conference on Electrical Engineering and Informatics, Vol. 1, Bandung, 17-19 June 2007, 765-768.
[21] Abdallah, T.M. and Abdel, A.A. (2012) Epidemiology of Tuberculosis in Eastern Sudan. Asian Pacific Journal of Tropical Biomedicine, 2, 999-1001.
https://doi.org/10.1016/S2221-1691(13)60013-1
Submit or recommend next manuscript to SCIRP and we will provide best service for you:
Accepting pre-submission inquiries through Email, Facebook, LinkedIn, Twitter, etc. A wide selection of journals (inclusive of 9 subjects, more than 200 journals)
Providing 24-hour high-quality service User-friendly online submission system Fair and swift peer-review system
Efficient typesetting and proofreading procedure
Display of the result of downloads and visits, as well as the number of cited articles Maximum dissemination of your research work
Submit your manuscript at: http://papersubmission.scirp.org/