Munich Personal RePEc Archive
Trading Puzzle, Puzzling Trade
Erdem, Orhan and Yüksel, Serkan and Arık, Evren
Borsa İstanbul
6 February 2013
Online at
https://mpra.ub.uni-muenchen.de/46804/
1
Trading Puzzle, Puzzling Trade
1Orhan Erdem
a,*, Evren Arik
a,b, Serkan Yuksel
a,ca
Borsa Istanbul, Research Department
b
Ph.D. candidate, Department of Business, Galatasaray University
c
Ph.D. candidate, Department of Economics, Istanbul Bilgi University
*
Corresponding author. Tel: (+90)2122982220: Fax: (+90)2122982189 email: orhan.erdem@borsaistanbul.com
Abstract
We explore the return performance of individual investors with respect to various factors such as portfolio size, turnover ratio and also demographic factors: gender and age. Concerning that Borsa
İstanbul has one of highest share turnover ratio worldwide (141.8% as of 2012), it is an ideal
candidate to do this analysis. We examine the daily trades in Borsa İstanbul (formerly Istanbul Stock Exchange) of 20,000 individual investors over two year period from 2011 to 2012. The main finding which contradicts other studies and the contribution of the paper is that, the return of the individual portfolio is positively correlated with the portfolio size. Other findings are: Almost 70% of all individual investors cannot beat the market. Investors who have high turnover underperform compared to those who have lower turnover. Male investors trade more and lose more vis-à-vis the female and older investors have higher returns.
Key words: Turnover, Overconfidence, Portfolio Size, Stock Returns, Individual Investor
[May 2013]
Disclaimer: The views expressed in this study are those of the authors and do not necessarily reflect those of the Borsa Istanbul or its members.
1
2
I. Introduction and Literature Review
Stock market movements are consequences of human judgment, interactions and behavior. Hoffman et al. (2013) noted that investor perceptions and fluctuations are important drivers of investor behavior. Many studies provide extensive evidence that individual traders are imperfectly rational and prone to psychological biases that lead to costly investment mistakes2. For example the high trading level of the stock market was claimed to be inconsistent with the rational expectation models (Shiller (1981)). Glaser et al. (2007) concluded that the rational motives for trade were not sufficient to explain the high trading volume in the stock markets. Even though there are few contrary results (see Ivkovich and Weisbenner (2005) as an example), many studies showed also that individuals underperform the market (see Blume and Friend (1995), Odean (1999), Barber and Odean (2000), Grinblatt and Keloharju (2000), and Hirshleifer (2001)). The reasons of this performance have been attributed to many factors.
Overconfidence seems to be among the most discussed ones. In a pioneering study, using a monthly aggregated dataset Barber and Odean (2000) found that as investor’s turnover increase, their respective portfolio return decreases. They relate high turnover to overconfidence.
Several studies attributed individual investors’ performance to demographics too. Goetzmann and Kumar (2008) found that individual investors who are younger and poorer tend to hold more under-diversified portfolios, suggesting that they may exhibit stronger cognitive biases due to their demographic characteristics. In another related study, Korniotis and Kumar (2009) showed that cognitive abilities decline with age and they have found evidence to support the notion that investment performance declines with age. Another line of study investigates the gender differences on the return performance and trading behavior. Barber and Odean (2001) showed that men underperform women in stock trading with higher tendency to trade more and significantly inferior return performance. Choi et al. (2002), Agnew et al. (2003) are among the other studies supporting the same result. However, Felton et al. (2003) and Feng and Seasholes (2008) found no significant
evidence for the effect of gender characteristics on the return performance. Following Odean’s
study, Hamacher (2001) found a contrary result concluding “gender matters less than personal style,
age and education when it comes to rendering good planning advice.” Grinblatt et al. (1995) found that home bias, culture and demographic characteristics may have combined effect on the return performance.
Moreover, this study will contribute to the understanding of behavioral-cultural differences across the various stock markets. Huang, Heian and Zhang (2011) noted that Asian markets differ in significant dimensions to the Western markets especially for the cultural pattern as individuals are more prone to cognitive biases. Also, individual investors dominate the market for the small size stocks. Their study concludes that the fundamental differences in culture can spur the overtrading in
2
3
the stock market (See also Chen et al. (2007), Kim and Nofsinger (2003) and Yates et al. (1997)). Chen et al. (2009) found that foreign investors in Taiwan interpret public information better than domestic investors so that their return performance is better than domestic investors. Barber et al. (2008, 2010) and Gao and Lin (2010) analyzed the individual investors in Taiwan, and Feng and Seasholes (2004, 2005, 2008) studied the individual investors in China; both studies have found supporting evidence for the cultural characteristics on the return performance. This study is unique with its
regional data and the individual investors’ gender and age characteristics analysis can be inferred as
the indicator for cultural patterns, which have significant effects on the portfolio returns. Hence, we do not only contribute to the overconfidence literature but also add an important analysis of an emerging country data to the behavioral finance literature.
In this study, we aim to focus on the potential factors of individual investors that are correlated with their return performance. We explore the correlation of return performance of individual investors with respect to several factors such as portfolio size, turnover ratio, gender and age. Here we improve the work of Barber and Odean (2000) by using a weekly aggregated data where the returns of individual portfolios are calculated weekly.Profitability of the trades of individual investors can switch when the analysis is conducted on weekly data rather than monthly. Barber and Odean (2001) noted that individuals, who trade frequently, make substantial benefits from intra-month trading. We think that Borsa Istanbul (formerly Istanbul Stock Exchange) may provide useful insight on this issue since it has 4th highest share turnover ratio in the world3. Since individuals have psychological biases and these cognitive biases affect their return performance (Kaniel, Saar and Titman (2008)); the correlation of age, gender, turnover and portfolio characteristics with the return performance of individual traders have been studied.
Before starting the main findings and discussions, we present that investors in general underperform the market. Our results support the former papers that the return performances individual investors are inferior to the market index returns, ceteris paribus.
Our main finding: We posit that effect of the portfolio characteristics on the return performance can give important information on the general structure of the stock market. Therefore we analyzed the return performance based on the portfolio size and conclude third and the main result of this paper: the bigger size portfolios have higher returns in general.
Our second finding is on the relationship between turnover and return performance of the individual investors. As a high turnover stock market, analysis of the turnover of individual investors in Borsa Istanbul can give important insights about the investment practices. Even though only 37% of market capitalization belongs to domestic investors, 83% of all trades are executed by these investors. They generally hold on to their purchases for a very short period of time compared to the other institutional investors (Kaniel, Saar, Titman (2008)). Chuang and Susmel (2011) compared institutional to individual inventors on their return performances and found that individual investor trades even more aggressively in bearish markets whereas institutional investors trade relatively conservatively. This paper also contributes to the literature with the weekly performance analysis of individual investors. Our results indicate that as the turnover individual investors’ portfolio increases, the return of the portfolio decreases. This result can be considered as a supporting evidence for
3
4
overconfidence hypothesis. (For further study on relation to the overconfidence hypothesis see Barber and Odean (2000), Yeoh and Wood (2011))
Lastly, we explored whether age and gender characteristics of individuals have an effect on their return performance. Since there are numerous characteristics for individual investors, in sake of simplicity and to keep track of significant characteristics of the individual investors, we only document the effect of age and gender on the return performance. With vast literature developed for the effect of gender characteristics on the aggressive trading strategies, we study both age and gender characteristics of individual investors. Here, we find that on average women have better performances than men. Likewise, age has a positive effect on the portfolio performance of individual investors. We also find that the coefficient “Age*Gender” has a negative and significant sign suggesting that females earn less compared to men when they get older. This interesting evidence implies that behavioral characteristics of individual investors need more attention and interaction effects of these characteristics should be studied before any conclusive intuition is asserted.
To the best of our knowledge, this study is one of the few studies with individual data. Also, this is among the few studies that focus only on characteristics of individual investor in an emerging market stock exchange4. Only study that uses individual data from Turkey beside ours is Fuertes et al. (2012), which tracked brokerage house tracking accounts of 59,951 individual investors between 2008-2010. They investigated the behavioral reasons for the under diversified portfolio in Borsa
İstanbul. Here, we rather study on the relationship between turnover and returns whereas their study concentrates on the relationship between portfolio size and returns.
The rest of the paper is organized as follows. We explain the data and methodology in Section 2. Section 3 gives the empirical results and Section 4 concludes.
II. Data and Methodology
Our dataset, provided by the central security depository (MKK), covers the transactions in Borsa
İstanbul. Borsa İstanbul is one of the most important and liquid markets in the Eastern Europe and MENA region with being the world’s 4th largest bond market on electronic order book. Equity market has 405 listed companies with $273 billion traded value and $301 billion market capitalization as of December, 2012. Even though only 37% of market capitalization belongs to domestic investors, their traded value is quite high, making 83% of the whole trade. There are 1,090,059 domestic individual investors that capture 21% the market capitalization. For this study, individuals who traded at least once in the two-year period and held portfolios more than 1,000 TRY (approx. $560) as of the end of 2012 are selected which amounts to 250,827 investors (See also Barber and Odean (2001) and Statman et al. (2006) for data selection criteria). We randomly select 20,000 investors from these investors and used weekly aggregated daily trades for them. That is, the portfolio returns of the individuals are calculated weekly contrary to most the literature which uses monthly aggregated data. Higher frequency is preferred with aim of having clearer picture for the performance of
4
5
individuals since the turnover of the Borsa İstanbul is higher than most other markets (4th highest turnover in the world5).
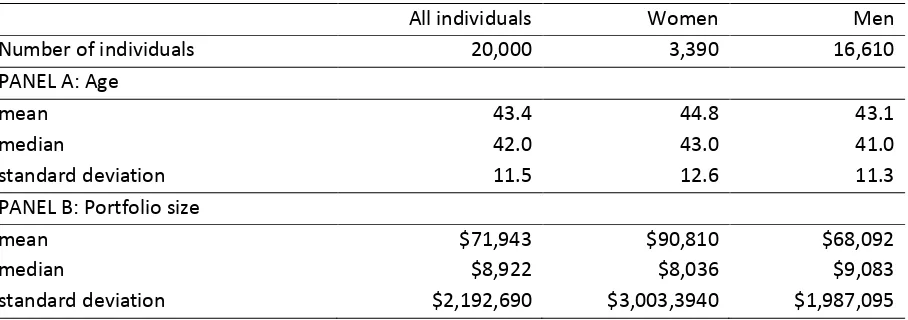
[image:6.595.72.526.296.456.2]The descriptive statistics of the sample is reported in Table 1. 83.1% of the individual investors are male (Percentage dominance of men was similar in Lease at al. (1974) as 80%, Barber and Odean (2001) as 78.7%). The average age of our sample individuals is 43 and average age of women is higher than that of men. Panel B shows that women have higher average portfolio size than men. Descriptive statistics indicate that distributions of the portfolio sizes are clearly positively skewed: the median portfolio size is $8,922, whereas the average of the portfolio size is $71,943. Although median of the portfolio sizes are close to each other for males and females, the averages of the portfolio sizes greatly differ for different genders.
Table 1
Descriptive Statistics by age, gender and portfolio sizes of individual investors in the Borsa İstanbul
All individuals Women Men
Number of individuals 20,000 3,390 16,610
PANEL A: Age
mean 43.4 44.8 43.1
median 42.0 43.0 41.0
standard deviation 11.5 12.6 11.3
PANEL B: Portfolio size
mean $71,943 $90,810 $68,092
median $8,922 $8,036 $9,083
standard deviation $2,192,690 $3,003,3940 $1,987,095
This table reports the descriptive statistics by investor’s age, gender and portfolio size on Borsa İstanbul. The values are as of the end of 2012. Portfolio size values are in USD dollars. Portfolio sizes are taken from MKK in Turkish Lira (TRY and converted to USD dollar by CBRT effective average exchange rate). The source of the raw data is MKK.
To begin the analysis, we first define the turnover as follows6:
j jt jt
PSize
TradeValue
Turnover
2
1
(1)
where TradedValue is calculated as 0.5 times the average of weekly total trades in terms of market
value for the each investor j, and PSizej represents the average of end-of week portfolio holdings in
terms of market value for the each investor. Hence, PSizej is a constant number for the sample
period. Weekly aggregated trade data includes number of shares and values whereas the position data includes only number of shares. Therefore, prices are calculated from trade data and these prices used to obtain end-of-week portfolio values. Then, we calculate weekly turnovers as the
market value of stocks traded in each week divided by thePSizej. The second step is to estimate
5
According to WFE Statistics as of 2012.
6
6
weekly returns of the investors using the positions data and adjusted stock prices, which are obtained from Bloomberg. We first calculate weekly returns of each stock and then calculate weighted weekly raw returns of portfolios:
jt s i it ijt rawjt
p
r
r
1
(2)
where
r
itis the weekly return for stock i in week t, pijtrepresents the weight that was calculated bydividing the end-of-week market value for stock i to the end-of-week market value of portfolio held
by investor j, and sjtis the number of stocks held by investor j. Weekly market adjusted returns are
calculated as follows:
m t raw jt jt r r
r (3)
where m t
r denotes corresponding weekly rate of return on IMKB 100 index, main broad
value-weighted stock index of Borsa Istanbul’s equity market. Having calculated market adjusted weekly returns in (3) and turnover in (1) for each investor, we calculate the average return rj and average
turnover Turnoverj for each individual j over T=104 weeks from January 2011 to December 2012 as
T t jt jr
T
r
11
(4)
T i jt jTurnover
Turnover
1 (5)Note that the “average return” is market adjusted by subtracting the market index from raw returns as in (3). Next, to analyze return differences between investors with respect to turnover ratios, investors are sorted into quintiles based on weekly turnover. Also, investors are sorted on the basis of portfolio size. To extend the analysis on the effect of portfolio size, we employ CAPM in addition to market adjusted returns:
f
t m t f
t
t
r
r
r
r
(6)We further analyze the effects of turnover and portfolio size as well as gender and age on average return for each investor in the following cross sectional regression:
j j
j j
j
j Turnover Gender Age GenderXAge PSizeh
r
0
1
2
3
4
5 (7)7
j
PSizeh is a dummy variable indicating that the investor has a portfolio higher than the median. The gender is also a dummy variable which equals to 1 if the investor is female. The variable “Age” is the
value of investor’s age divided by 10 (following Barber and Odean (2001)).
III. Results
First, we present our results by giving the the return performance of individual investors. As
Panel B of Table 2 indicates, the average return is negative (rj= - 0.29%) which shows that in this
high-turnover market, the individuals cannot beat the market on average. Kramer (2012) and Coval, Hirshleifer and Shumuay (2005) showed that only informed individuals can beat the market. Our results give supportive evidence for the fact that individual investors with limited information or limited skill set such as IQ, underperform the market (Grinblatt, Keloharju and Linnainmaa (2011, 2012). Women significantly outperform men in terms of average returns (0.16% compared to -0.31%), which is consistent with the findings of Barber and Odean (2001), Choi et al. (2002) and Mitchell et al. (2006).
[image:8.595.65.516.466.597.2]As Panel A of Table 2 shows, turnover for the whole sample is 113%. This result is significantly higher than 8.8% reported by Barber and Odean (2000), 2.52% reported by Kaniel et al. (2008) and 4.7% reported by Foucault et al. (2011)7. Moreover, the results indicate that both the mean and the median turnover are significantly lower for women than men on the average. That is women trade less than men.
Table 2
Turnover and Return Performance of Individual Investors
All individuals Women Men Gender Difference
Number of individuals 20,000 3,390 16,610 -
Panel A: Average Turnover
mean 113.0% 73.3% 121.2% -47.9%*
median 38.4% 31.2% 39.9% -8.7%***
Panel B: Average Return
mean -0.281%*** -0.163%*** -0.311%*** 0.148%***
median -0.221%*** -0.109%*** -0.247%*** 0.138%***
Average Turnover is calculated as in equation (5), average return is calculated as in equation (4).
*, ** and *** denote statistical significance at the 10%, 5% and 1% levels, respectively. Tests for differences in medians are based on Wilcoxon signed rank and Wilcoxon/Mann-Whitney test statistics
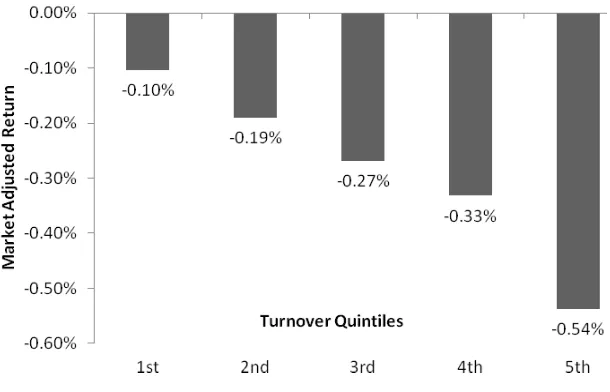
We further analyze the relationship between returns and turnover in more detail. In order to highlight the effect of turnover on the return performance, we sort the individuals according to their turnover ratios and divide them into quintiles. As Figure 1 clearly indicates there is an inverse relationship between turnover and average return (The exact numerical results can be found in Appendix). That is, average return decreases as turnover increases. Consistent with Barber and
7
8
Odean (2000, 2001), Kramer (2012) and Statman, Thorley and Vorkink (2006); higher trading activity results in inferior return performance for individual investors. Note that, highest turnover quintile has almost four times higher turnover than the average individual investor and sixty times higher than the lowest quintile. This high turnover has mainly been attributed to overconfidence by many studies (Odean (2000, 2001), Statman, Thorley and Vorkink (2006)). However some other studies claim that high turnover is due to information asymmetry (Kramer (2012)), private information
(Kaniel, Saar, Titman (2012)) or rather individual’s assessment of the firm characteristics (Hoffman,
[image:9.595.159.464.270.466.2]Shefrin, Pennings (2012)). Though these studies in the literature focus more on the reasons for overtrading, our study rather concentrates on the overtrading puzzle rather than the behavioral foundations of overtrading.
Figure 1
Relationship between Turnover and Return
[image:9.595.141.452.562.761.2]There is also a positive relationship between average return and portfolio size. Figure 2 shows that, as portfolio size increases, the average return of the investor increases (see Panel B of Table 3 in Appendix for numerical details).
Figure 2
9
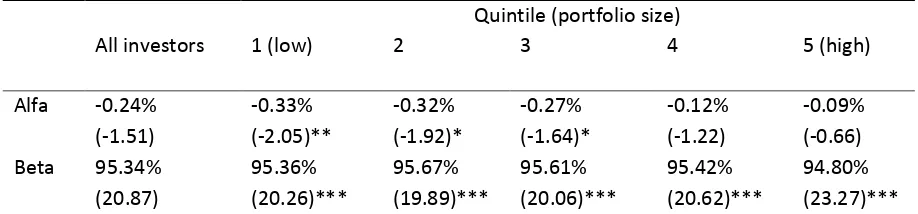
[image:10.595.64.523.158.265.2]CAPM analysis across the quintiles of portfolio size provided in Table 3 confirms the positive relationship. The excess return (α), negative in all quintiles, is significant in the lowest three quintiles and decreases consistently as portfolio increases.
Table 3
Relationship between Portfolio Size and Return: CAPM Results
Quintile (portfolio size)
All investors 1 (low) 2 3 4 5 (high)
Alfa -0.24% (-1.51) -0.33% (-2.05)** -0.32% (-1.92)* -0.27% (-1.64)* -0.12% (-1.22) -0.09% (-0.66) Beta 95.34%
(20.87) 95.36% (20.26)*** 95.67% (19.89)*** 95.61% (20.06)*** 95.42% (20.62)*** 94.80% (23.27)***
This table presents the results of the time series regression analysis performed in equation (6). Alfa is the CAPM intercept and beta is the coefficient on ( ). t-statistics in parentheses and *, ** and *** denote statistical significance at the 10%, 5% and 1% levels, respectively.
High returns for bigger portfolios may be attributed to lower liquidity constraints for wealthy investors, e.g., they may not be forced to sell their stocks in hard times. They may also benefit more from professional investment services of the industry. As Kramer (2012) and Chang et al. (2009) noted that the individual investors who are superior informed or have better financial advice earn higher returns compared to uninformed high turnover traders. However, Barber and Odean (2000) have found that, small portfolios perform better though the return performance difference is not significantly different than zero.
Final analysis is performed via a cross section regression of the returns on the before mentioned variables: turnover, portfolio, gender together with age. This regression is done in order
10
Table 4
Cross Sectional Regression of Return
Dependent variable Market adjusted return (%)
Intercept -0.656
(-36.99)***
Turnover -0.012
(-6.46)***
Gender dummy 0.314
(8.18)***
Age/10 0.066
(17.83)***
Gender X Age -0.039
(-5.16)***
Portfolio size high 0.166
(20.18)***
R2 6.7%
Adjusted R2 6.7%
F-value 287.57
This table presents the results of the cross-sectional regression analysis performed in equation (7).
Reported are the estimated coefficients with their t-statistics in parentheses. *, ** and *** denote statistical significance at the 10%, 5% and 1% levels, respectively. Standard errors are corrected for heteroscedasticity.
IV. Conclusion
Concerning the high volume of trade in stock markets, one can ask whether these trades generate high returns or not. As Glaser et al. (2004) suggested, the rational motives for trade are not sufficient to explain the high trading volume in financial markets. Here, we investigated the individual investors in Borsa İstanbul from a behavioral perspective. With the important specialty of the Borsa
İstanbul which is having one of highest turnover ratio in the world (141.8% as of 2012), we used weekly aggregated daily trades of 20.000 individual investors from January 2011 to December 2012. Regarding the limited number of individual data sets utilized in the literature, we expand the data covered in this line of research to a new market, which has one of the highest turnovers throughout the world. This study first documents the turnover and return performances of individual investors and analyzes the relationship between the two. This analysis is repeated for the return and portfolio size. A regression analysis is carried out to find the effects of several variables such as turnover, portfolio size, age and gender on the portfolio returns of the individuals. Our analysis provides five important results:
The main result of the study is that there is a positive relationship between portfolio size and returns. That is the bigger the portfolio size, the higher the returns.
The other results are:
First, the individual investors underperform the market.
Second, there is a reverse relationship between turnover and returns.
11
Fourth, age has a positive effect on the portfolio returns.
These results are consistent with the behavioral finance literature which suggests that individuals (mainly due to their overconfidence) that trade aggressively have lower returns compared to the average investor. We contribute to the literature by putting evidence on the reverse relationship between portfolio size and returns. One of the important aspects of our study is that, different from the general tendency in the literature, the analysis is performed with weekly aggregated portfolios. Moreover, we present important evidence for high trading activity from an emerging market which can have some different behavioral patterns compared to the most of the studies in the literature. Any further studies that elaborate more on the behavioral aspects of these individuals from emerging markets can give important inferences to the understanding of the
12
[image:13.595.64.530.134.320.2]APPENDIX
Table 5
Returns for Investor Quintiles Based on Mean Turnover and Portfolio Size
Quintile
All investors 1 (low) 2 3 4 5 (high)
Panel A: by turnover
Mean turnover 113.0% 7.3% 20.8% 38.8% 71.5% 427.8%
Raw return -0.051% 0.089% 0.020% -0.038% -0.077% -0.251%
Market adj. return -0.286% -0.103% -0.190% -0.269% -0.332% -0.538%
Panel A: by portfolio size
Mean portfolio size $71,943 $1,653 $4,647 $9,644 $21,651 $298,316
Mean turnover 113.0% 197.6% 94.5% 92.8% 81.5% 98.9%
Raw return -0.051% -0.138% -0.121% -0.080% -0.011% 0.093%
Market adj. return -0.286% -0.444% -0.365% -0.301% -0.217% -0.104%
Records of 20,000 investors are sorted into quintiles based on weekly turnover. Quintile 1 contains investors with the lowest turnover; quintile 5 contains investors with the highest. Raw return is the average weekly return for the average investor. Market adjusted return is calculated as subtracting benchmark market index from raw return. The values are as of the end of 2012. Mean Portfolio size values are in USD dollars. Portfolio sizes are taken from MKK in Turkish Lira (TRY and converted to USD dollar by CBRT effective average exchange rate for 2011 to 2012). The source of the data is MKK.
REFERENCES
Anderson, A. (2008), “Trading and Under-Diversification, working paper, Institute for Financial Research, Stockholm.
Andrade, S.C., C. Chang, and M.S. Seasholes (2008), “Trading Imbalances, Predictable Reversals, and
Cross-Stock Price Pressure,” Journal of Financial Economics, 88:406- 423.
Agnew, J., Balduzzi, Sundén (2003), "Portfolio Choice and Trading in a Large 401(k) Plan", American Economic Review, 93: 193-215
Ajzen, I. (1985), “From intentions to actions: A theory of planned behavior. In: J. Kuhl & J. Beckmann (Eds.), Action Control: From Cognition to Behavior”, NY: Springer Verlag 11-39
Ajzen, I. (1991), “The theory of planned behavior”, Organizational Behavior and Human Decision Processes, 50: 179-211.
Baker, M. P., and J. C. Stein, 2004, “Market liquidity as a sentiment indicator”, Journal of Financial Markets 7, 271–99.
Barber, B.M., Y. Lee, Y. Liu, and T. Odean (2007), “Is the Aggregate Investor Reluctant to Realize Losses? Evidence from Taiwan”, European Financial Management 13:423-447.
Barber, B.M., Y. Lee, Y. Liu, and T. Odean (2009), “Just How Much Do Individual Investors Lose by
Trading?”,Review of Financial Studies, 22:609-632.
Barber, B.M., Y. Lee, Y. Liu, and T. Odean (2011), “The Cross-Section of Speculator Skill: Evidence
from Taiwan,” working paper
Barber, B.M. and T. Odean (2000), “Trading Is Hazardous to Your Wealth: The Common Stock
13
Barber, B.M. and T. Odean (2001), “Boys Will Be Boys: Gender, Overconfidence, and Common Stock
Investment”, Quarterly Journal of Economics, 116:261-292.
Barber, B.M. and T. Odean (2004), “Are Individual Investors Tax Savvy? Evidence from Retail and Discount Brokerage Accounts”, Journal of Public Economics, 88, 419-442.
Barber, B.M. and T. Odean (2008), “All that Glitters: The Effect of Attention on the Buying Behavior of
Individual and Institutional Investors,” Review of Financial Studies, 21: 785-818.
Barber, B.M., T. Odean, and N. Zhu (2009b), “Systematic Noise,” Journal of FinancialMarkets, 12:547 -469.
Barberis, N. and R.H. Thaler (2003), “A Survey of Behavioral Finance,” in G. Constantinides, M. Harris,
R. Stultz eds., Handbook of the Economics of Finance.
Banz, W. (1981), “The relationship between return and market value of common stocks”, Journal of Financial Economics, 9, 1:3-18
Benos, A.V. (1998), “Overconfident Speculators in Call Markets: Trade Patterns andSurvival”, Journal of Financial Markets, 1:353-383.
Blume, M. E., and I. Friend. “The Asset Structure of Individual Portfolios and Some Implications for Utility Functions”” Journal of Finance, 30 (1975), 585–603.
Campbell, J.Y. (2006), “Household Finance”, Journal of Finance, 61:1553-1604.
Carhart, M. M., 1997, “On persistence in mutual fund performance”, Journal of Finance, 52: 57–82.
Chen, G., K. Kim, J. Nofsinger, and O. Rui (2007), “Trading Performance, Disposition Effect,
Overconfidence, Represenativeness Bias, and Experience of Emerging Market Investors”, Journal of Behavioral Decision Making, 20:425-451.
Chen, L., Johnson S., Lin J., Liu Y. (2009), “Information, sophistication, and foreign versus domestic
investors’ performance”, Journal of Banking & Finance, 33:1636-1651.
Choi, J. J., D. Laibson, and A. Metrick (2002), “How Does the Internet Affect Trading? Evidence from Investor Behavior in 401(k) Plans”, Journal of Financial Economics, 64: 397-421
Chuang, W. I. and Susmel, R. (2011), “Who is the more overconfident trader? Individual versus institutional investors”, Journal of Banking & Finance, 35: 1626-1644.
Cooper, C. Woo, W. Dunkelberg, (1988), “Entrepreneurs' perceived chances for success”, Journal of Business Venturing, 3, 2: 97-108
Coval, Hirshleifer and Shumuay (2005), “Do Behavioral Biases Affect Prices?” Journal of Finance, 2:1-34.
DeBondt, W. F. M. and Thaler, R. H. (1985), “Does the stock market overreact?”, Journal of Finance, 40:793–808.
DeBondt, W. F. M. and Thaler, R. H. (1987), “Further evidence on investor overreaction and stock market seasonality”, Journal of Finance, 42: 557–81.
Fazio, R. (1983), “Multiple Process by which Attitudes Guide Behavior: The Mode Model as an Integrative Framework”, Advances in Experimental Social Psychology, 23: 75-89
Felton, J., Gibson, B., Sanbonmatsu, D. M. (2003), “Preference for risk in investing as a function of
trait optimism and gender”,Journal of Psychology and Financial Markets, 4: 33-40
Feng, L. and M. Seasholes (2004), “Correlated Trading and Location,” Journal of Finance, 59:2117-2144
Feng, L. and M. Seasholes (2005), “Do Investor Sophistication and Trading Experience Eliminate
14
Feng, L., and M. Seasholes (2008), “Individual Investors and Gender Similarities in an Emerging Stock Market”, Pacific-Basin Finance Journal, 16:44-60.
Frazzini, A. (2006), “The Disposition Effect and Underreaction to News”, Journal of Finance, 61:2017-2046.
Foucault, Sraer D., Thesmar DJ. (2011), “Individual Investors and Volatility”, The Journal of Finance, 66(4): 1369–1406
Fuertes, Muradoglu A.G., Ozturkkal, B., (2012) “A Behavioural Analysis of Investor Diversification” The European Journal of Finance, 1-25
Gao and Lin (2010), “Do Individual Investors Trade Stocks as Gambling? Evidence from Repeated
Natural Experiments”
Gervais, S. and T. Odean (2001), “Learning to Be Overconfident”, Review of Financial Studies, 14:1-27.
Glaser, M. and M. Weber (2007), “Overconfidence and Trading Volume”, Geneva Risk and Insurance Revue, 32:1-36.
Glaser, M., and M. Weber, (2009), “Which past returns affect trading volume?”, Journal of Financial Markets, 12, 1–31.
Goetzmann, W. and A. Kumar (2008), “Equity Portfolio Diversification”, Review of Finance, 12:433-463.
Griffin, J. M., J. H. Harris, and S. Topaloglu (2003), “The dynamics of institutional and individual trading”, Journal of Finance, 58: 2285–2320.
Grinblatt, S. Daniel, K., M. Titman, and R. Wermers (1995), “Measuring Mutual Fund Performance with Characteristic-Based Benchmarks”, Journal of Finance, 52: 1035-1058.
Grinblatt, M. and M. Keloharju (2000), “The Investment Behavior and Performance of Various
Investor Types: A Study of Finland's Unique Data Set”, Journal of Financial Economics, 55:43-67. Grinblatt, M. and M. Keloharju (2009), “Sensation Seeking, Overconfidence, and Trading Activity”, Journal of Finance, 64:549-578.
Grinblatt, M. , M. Keloharju, J. Linnainmaa (2011), “IQ and Stock Market Participation”, Journal of Finance, 66: 6, 2121:2164
Grinblatt, M. , M. Keloharju, J. Linnainmaa (2012), “IQ, trading Behavior and performance”, Journal of Financial Economics,104: 2, 339:362
Grossman, S.J. and J.E. Stiglitz (1980), “On the Impossibility of Informationally Efficient Markets", American Economic Review, 70:393-408.
Hamacher, T., (2001), “He invests, she invests”, Financial Planning, 152
Hirshleifer, D. (2001), “Investor Psychology and Asset Pricing,” Journal of Finance, 56:1533-1597.
Hoffman, T. Post, J.M.E., Pennings (2013), “Individual investor perceptions and behavior during the financial crisis”, Journal of Banking & Finance, 37:60-74
Hong, H., and J. C. Stein, (2003), “Differences of opinion, short-sales constraints and market crashes”, Review of Financial Studies, 16, 487–525.
Hong, H., and J. C. Stein, (2007), “Disagreement and the stock market”, Journal of Economic Perspectives, 21:28.
Huang, Z., Heian, JB and Zhang, T. (2011), “Differences of Opinion, Overconfidence and the High
-Volume Premium”, Journal of Financial Research, 34: 1–25
15
Kaniel, R., S. Liu, G. Saar, and S. Titman (2012), “Individual Investor Trading and Return Patterns around Earnings Announcements,” Journal of Finance
Kaniel, R., G. Saar, and S. Titman (2008), “Individual Investor Trading and Stock Returns,” Journal of
Financ,e 63:273-310.
Kim, K., Nofsinger, J., “Institutional Herding, Business Groups, and Economic Regimes: Evidence from Japan”, The Journal of Business, 78: 213-242
Koestner, Meyer, Hackethal (2012), “Do Individual Investors Learn from Their Mistakes?”, Goethe University Frankfurt Working Paper Series.
Korniotis, G.M. and A. Kumar (2009), “Do Older Investors Make Better Investment Decisions?" Review of Economics and Statistics, 93:244-265.
Kumar, A. (2009), “Hard-to-Value Stocks, Behavioral Biases, and Informed Trading," Journal of Financial and Quantitative Analysis, 44:1375-1401.
Ivkovic, Z., and S. (2005), Weisbenner. “Local Does as Local is: Information Content of the Geography of Individual Investors’ Common Stock Investments” Journal of Finance, 60: 267–306.
Lo, A.W., and J.Wang, (2006), “Trading volume: Implications of an intertemporal capital asset pricing model”, Journal of Finance, 61: 2805–2840.
Miller, (1977), “Risk, Uncertainty and Divergence in Option”, Journal of Finance, 32,4:1151-1168
Odean, T. (1998), “Volume, Volatility, Price, and Profit When All Traders Are Above Average," Journal
of Finance 53:1887-1934.
Odean, T. (1999), “Do Investors Trade too Much?" American Economic Review 89:1279-1298.
Russo, J. E. and Schoemaker, P. J. H., "Managing Overconfidence," Sloan Management Review, Winter, 1992, pp. 7-18.
Scheinkman, J. and W. Xiong (2003), “Overconfidence and Speculative Bubbles," Journal of Political Economy, 111:1183-1219.
Seasholes, M.S., and G. Wu (2007), “Predictable Behavior, Profits, and Attention," Journal of
Empirical Finance, 15:590-610.
Seasholes, M.S. and N. Zhu (2010), “Individual Investors and Local Bias," Journal of Finance, 65:1987-2010.
Schlarbaum, G.G., W.G. Lewellen, and R.C. Lease (1978), “Realized Returns on Common Stock
Investments: The Experience of Individual Investors," Journal of Business, 51:299-325.
Seru, A., T. Shumway, and N. Stoffman (2010), “Learning by Trading," Review of Financial Studies, 23:705-839.
Shefrin, H. and Statman, M. (1984), “Explaining investor preference for cash dividends”, Journal of Financial Economics, 13: 253–82
Shefrin, H.M. and M.S. Statman (1985), “The Disposition to Sell Winners too Early and Ride Losers too
Long: Theory and Evidence,” Journal of Finance, 40:777-790
Shefrin, H.M. and M.S. Statman (1994), “Behavioral Capital Asset Pricing Theory”, Journal of Financial and Quantitative Analysis, 29:323–349.
Shiller, R. J. (1981), “Do stock prices move too much to be justified by subsequent changes in
dividends?”, American Economic Review, 71:421–98.
Sias, R., L. T. Starks, and S. Titman, (2006), “The price impact of institutional trading”, Journal of Business, 79: 2869–2910.
16
Solt and Statman (1989), “Good Companies, Bad Stocks”, The Journal of Portfolio Management, 15,
4: 39-44
Statman, M., S. Thorley, and K. Vorkink, (2006), “Investor overconfidence and trading volume”, Review of Financial Studies, 19: 1531–1565.
Subrahmanyam, A. (2008), “Behavioral Finance: A Review and Synthesis,” European Financial
Management, 14:12-29.
Yates, J. F., J. Lee, and J. G. Bush, (1997), “General knowledge overconfidence: Cross-national
variations, response style, and reality,” Organizational Behavior and Human Decision Processes, 70: 87–94