http://www.scirp.org/journal/ojce ISSN Online: 2164-3172
ISSN Print: 2164-3164
DOI: 10.4236/ojce.2017.73024 Jul. 27, 2017 348 Open Journal of Civil Engineering
Soil Structure Interaction Effects on Pushover
Analysis of Short Span RC Bridges
Islam M. Ezz El-Arab
Structural Engineering Department, Faculty of Engineering, Tanta University, Tanta, Egypt
Abstract
A three dimensional finite element of nonlinear pushover analysis for short span Reinforced Concrete (RC) bridge with circular piers cross section is modeling to present effects of soil structural interaction (SSI). Structural ele-ments models are including linear foundation springs modeling, and nonli-near RC piers modeling. The paper succeeded to present the SSI effects of nonlinear pushover analysis of short spans RC bridges to determine the sig-nificant effects on dynamic characteristics and displacement capacity of short span RC bridges performance; that is increasing within range 11% to 20% compared to baseline pushover analysis of bridge without SSI effects. Results show the bridge stiffness decreases due to SSI effects on the bridge support for more flexible soils types that generates large displacement, with correspond-ing less base shear in bridge piers and footcorrespond-ings by average percentage 12% and 18%, which is important for structural evaluation for new bridge construction and also, for strengthening and repair works evaluation of existing bridges.
Keywords
Soil Structure Interaction, Pushover Analysis, RC Bridge, Nonlinear
1. Introduction
The modeling and seismic analysis of bridge structures have been a major evolu-tion over recent decades linked directly to the rapid development of digital computing. Both static and dynamic analysis of bridge systems experienced ma-jor breakthroughs when finite-element techniques were developed. In past, elas-tic analysis procedures used for bridge structural assessment which is not suffi-cient for inelastic action occurred. Nonlinear dynamic analysis become essential for bridges structural assessment however, it’s costly consuming. For that, non-linear static analysis (pushover) becomes preferable inelastic seismic behavior How to cite this paper: El-Arab, I.M.E.
(2017) Soil Structure Interaction Effects on Pushover Analysis of Short Span RC Bridges.
Open Journal of Civil Engineering, 7, 348-361. https://doi.org/10.4236/ojce.2017.73024
Received: July 1, 2017 Accepted: July 24, 2017 Published: July 27, 2017
Copyright © 2017 by author and Scientific Research Publishing Inc. This work is licensed under the Creative Commons Attribution International License (CC BY 4.0).
http://creativecommons.org/licenses/by/4.0/
DOI: 10.4236/ojce.2017.73024 349 Open Journal of Civil Engineering tool in structural evaluation of bridges because of its low costs and time con-suming.
In damage surveying of bridge rezones by recent earthquakes, the main basic structural rezones can be classified as the following: underestimated of pier sec-tion capacity of seismic shear value; large seismic movement of bridge deck that can add additional moment and share to bridge pier, in case of bridge base isola-tion was under design estimated; inelastic structural acisola-tions and associated con-cepts of ductility were not considered. All the structural deficiencies lead to in-elastic failure modes of bridges due to plastic hinge that was created in bridge pier in different locations and levels based on the seismic force value and overall bridge stiffness elements, which was almost uniformly adopted for seismic de-sign of bridges prior to 1970 [1]. In references [2], [3], and [4] the pushover analysis as a nonlinear static technique was defined as applied static lateral forces on structure. Total base shear is directly proportional with top displacement of structure as indication of failure mode simulated in capacity curve of structure.
In many of previous studies on bridges that included SSI as well as inelasticity in bridge pier resulted in conflicting opinion on the role of structural inelasticity on seismic demand.
In conventional bridges analysis, their bases are considered fixed bases; very limited investigations have focused on identifying SSI in bridges supporting on shallow foundation. Flexibility levels of the supporting soil will be depended on the soil types and soil parameters from medium to soft soils. This decreases the overall stiffness of the bridge resulting in a subsequent increase in the natural periods of the system and the overall response is altered. The soil structure inte-raction will have significant effect on the overall capacity curve of bridge under pushover analysis, which is reflected on the failure mode of superstructure of bridge, [4], [5], and [6].
In previous study, [5] showed that effect of SSI in bridges was more strongly influenced by the nonlinear structural properties of bridge sub-structure com-ponents than by soil properties. However, this advance in computational capa-bilities of soil structure interaction effects on the static nonlinear analysis (pu-shover analysis) has been fully reflected in improved seismic design of new, or vulnerability assessment and retrofit of existing bridge structures. analysis tools currently available aid the process of designing new or retrofitting existing bridge structures subjected to earthquake taking inconsideration SSI on pushov-er analysis of bridge’s pipushov-ers to enhance the capacity curve of pipushov-ers which reflects on the structural assessment and strengthening of existing bridges.
DOI: 10.4236/ojce.2017.73024 350 Open Journal of Civil Engineering this types of existing bridges in study case area is defined as no seismic forces in the Gulf zone; for that base isolation between bridge deck and its pier is missing and neglected in simulation.
The paper focus to present simple representation of a soil-bridge pier system, yet one able to capture the effects of the most significant physical parameters. It has been found that SSI greatly affects the dynamic behavior of bridge piers leading to more flexible systems, decrease damping and larger total bridge pier displacements. Besides a thorough investigation of the relative significance of various physical parameters of the system response, an easy-to-use approach that can be incorporated for a preliminary design of bridges and helpful for structural assessment, strengthening and/or rehabilitation of existing short span RC bridges.
2. RC Bridge Geometry
The paper has select one of the famous and repeated bridge module in Middle zone of Kingdom of Saudi Arabia (KSA) using in the main road intersection, on of this bridge that used as study case Al-Fahs Bridge located in North-East of Riyadh, KSA. The bridge is a continuous, two-span, cast-in-place concrete gird-er structure. The two intgird-ermediate bents consist of three columns with a cross beam on top as shown in Figure 1. The geometry of the bridge, section proper-ties and foundation properproper-ties are defined in the Table 1 based on the General Authority for Roads and Bridges, KSA (owner of existing bridge). It is can con-firmed (without any doubt), the safety of original structural design of main structural bridge elements is sufficient to sustain the loads and displacement demands.
[image:3.595.209.535.487.697.2]The bridge consists of multi-spans continuous deck supported by a row of isolation bearings as shown in Figure 1. The substructure of bridge consists of
DOI: 10.4236/ojce.2017.73024 351 Open Journal of Civil Engineering
Table 1. Properties of the bridge deck and piers of Al-Fahs bridge, KSA.
Bridge
Properties Al-Fahs Bridge, RUH, KSA
Span length (ft) 2@15 and (2@4.5 abutment)
Pier height (m) 7.5
Main girder cross section area (m2) 0.5
Pier cross section area (m2) 3.8
Moment of inertia of bridge pier transverse direction (m4) 33.7 Moment of inertia of bridge pier in longitudinal direction (m4) 33.7 Natural time period of bridge in longitudinal direction (sec) 0.59 Natural time period of bridge in transverse direction (sec) 0.43
rigid abutments and reinforced concrete piers. The isolation bearings are pro-vided instead of conventional bearings between superstructure and substructure at abutment and pier locations. This system is idealized in the accurate finite element mode using professional seismic isolation computer code and nonlinear static analysis using SAP2000 [7], while the other was developed on a very commercial computer program.
Mathematical model of transversal section of bridge model presents in Figure 2; the main beam girder supporting on three circular reinforcements concrete pier columns the effective column height He. As presented in Figure 2, the soil structure is modeled by six linear springs for different six degrees of freedom; three for movement and the others three for rotations of plastic hinges.
The 3D finite element of Al-Fahs Bridge presented in Figure 3 the two abut-ments in bridge beginning points defined with pure hinge support to comply with the real situation where there is laminates of lead rubber bearing. The dy-namic characteristic’s was verified with the original design in the General Au-thority for Roads and Bridges, KSA to confirm the accuracy of 3D finite ele-ments modeling without soil structure interaction as per old design values and parameters, as shown in Table 1.
3. Modeling of Soil Structure Interaction, SSI
The soil surrounding the foundation of the pier is modeled by springs which has frequency independent stiffness in space. The complete dynamic analysis is car-ried out in the time domain using Newmark β-method [8].
In order to measure the effect of SSI on the push over analysis of existing Piers Bridge, base shear force and top displacement are compared with the response of the corresponding bridge ignoring SSI effects. A parametric study is also con-ducted to investigate the effects of soil flexibility of soft soil, medium soil prop-erties and hard soil report as base line of comparisons.
DOI: 10.4236/ojce.2017.73024 352 Open Journal of Civil Engineering
Figure 2. Mathematical model of Al-Fahs Bridge, Riyadh, KSA.
Figure 3. 3D Finite element model of Al-Fahs Bridge, created by SAP2000, [5].
piers. The structure is assumed to consist of a series of line column-beam ele-ments. The following assumptions are made for pushover analysis of existing bridges taking soil-structure interaction effect into consideration:
1) The soil supporting the foundation of the pier is modeled as springs acting in the vertical, horizontal, and rotational directions.
2) The foundation is represented using rigid elements connected to the soil springs that has frequency-independent coefficients.
DOI: 10.4236/ojce.2017.73024 353 Open Journal of Civil Engineering capacity of each soil and the corresponding spring stiffness was calculated. Such assumption is more realistic and has been used by [11] and [12].
4. Soil Idealization
The main parameter to classify the clay soil properties are mentioned in Table 2, [11] and [12]. The soil supporting the foundation of the pier is modeled as springs acting in the vertical, horizontal, and rotational directions. With three springs for movement; two in global horizontal directions and the third in the vertical direction, accompanied with rotational springs about the same three perpendicular axes have been attached below the footings of the bridge. Hence, springs in all six degrees of freedom have been attached to the foundation of piers. For better understanding, such idealization is presented schematically in Figure 2. The foundation is represented using rigid elements connected to the soil springs that has frequency-independent coefficients.
[image:6.595.208.541.391.458.2]Comprehensive research has been carried out to evaluate the stiffness of such springs. Closed form expressions for stiffness of equivalent soil springs as de-picted in Table 2 of the present study has been suggested by [9]. These expres-sions have been adopted in the present investigation and the resulting values are tabulated in Table 3. Values of shear modulus (G) for different types of soils
Table 2. Soil parameters considered [11] [12].
Soil Types N value C (kN/m2) φ (degree) γsat (kN/m3) Cc e0
Soft 10 18.5 0.0 17.0 0.189 0.90
Medium 20 36.8 0.0 18.5 0.135 0.72
Hard (Baseline) 45 220.0 0.0 21.0 0.093 0.58
where: N (SPT test), C (cohesion value), φ (Angle of soil internal friction), γsat (Soil density), Cc
[image:6.595.210.542.515.682.2](compres-sion index of soil) and e0 (initial void ratio of soil).
Table 3.Closed form expressions for stiffness of equivalent soil spring [11] [12].
Degrees of freedom Stiffness of equivalent soil spring
Vertical ( ) ( 0.75)
2GL 1−ν 0.73 1.54+ χ
with χ=Ab 4L2
Horizontal
(transversal direction) ( ) ( )
0.85
2GL 2−ν 2.0+2.50χ
with χ=Ab 4L2
Horizontal
(longitudinal direction) ( ) ( ) ( ) ( )
0.85
2GL 2−ν 2.0+2.50χ − 0.2 0.75−ν GL1− B L
Rocking
(about the longitudinal axis) ( ) ( ) ( )
0.25 0.75
1 bx 2.4 0.5
G −ν I L B B L
+
Rocking
(about the transversal axis) ( ) ( )
0.15 0.75
3G 1−ν Iby L B
Torsion 3.5 0.75( )0.4
(
4)
0.2bz bz
GI B L I B
DOI: 10.4236/ojce.2017.73024 354 Open Journal of Civil Engineering have been evaluated using the empirical relationship G = 120 N 0.8 t/ft2 i.e. G = 12,916,692.48 N 0.8 MPa [11] and [12]. Here, N is the number of blows to be applied in standard penetration test (SPT) of the soil and Poisson’s ratio (ν) of soil has been assumed to be equal to 0.5 for all types of soils to evaluate the stiff-ness of the equivalent soil springs [11]. As can be seen from Table 4, there is a significant difference in spring stiffness values due to change in footing size. This is not only expected, but also will affect the results of the study when taking SSI effect into consideration.
Finite element method was adopted to formulate the mass and stiffness ma-trices for the bridge model. Responses due to real ground motions were obtained using Newmark step by step direct integration method.
5. SSI Effects on Pushover Analysis of Bridge Pier
[image:7.595.213.538.553.722.2]A numerical study is conducted to evaluate the effect of SSI on the pushover re-sults of bridge with different soil types; It is obviously, that elastic analysis pro-cedures used in the past for structural assessment of short span bridge behavior are insufficient and inadequate due to the inability to define the modification of bridge response during inelastic action, which is reflecting on the displacement capacity curve of bridge. However, real seismic analysis is still as the most accu-rate method to predict structure seismic characteristic; the Pushover analysis is as nonlinear static analysis techniques, which can be used to determine the dy-namic characteristics and peak ground footing base shear corresponding to top pier displacement that called displacement curve of structures, to estimate available plastic rotational capacities to ensure satisfactory seismic performance. Estimation of plastic hinge creation will be helpful for structural assessment and expectation of real and more applicable failures modes of bridge. In additional to the above varieties of results and seismic data can be getting more easier than time history analysis that need more time and effort in simulation and modeling compared to pushover analysis that has accepted level of accuracy as it was veri-fied in [11] [12] [13].
Table 4. Stiffness values of different types of soil for different footing dimensions.
Stiffness of equivalent soil spring
Type of soils
Soft Medium Hard
Footing
dim. 30 * 30 ft dim. 25 * 25 ft Footing dim. 15 * 15 ft Footing
Vertical (kip/ft) 42,897 130,586 1,089,276
Horizontal (transversal direction) (kip/ft) 32,335 93,119 905,725 Horizontal (longitudinal direction) (kip/ft) 32,335 93,119 905,725 Rocking (about the longitudinal) (kip.ft) 7,689,516 12,130,288 17,914,003
Rocking (about the transversal) (kip.ft) 8,361,189 13,548,574 19,255,865
DOI: 10.4236/ojce.2017.73024 355 Open Journal of Civil Engineering The damping of the bridges is taken as 5% of the critical in all modes of the vibration. The soil surrounding the pier is considered as hard, medium, and soft soil, respectively. The properties of these soils were given in Table 4. Based on that, the Pushover analysis with soil structure interaction will be more helpful to demonstrate the structure behave by identifying modes of failure and the poten-tial of progressive collapse.
The pushover loading was not the simple lateral force but related to structure mode shapes. The equivalent lateral seismic load was proportional to a specified mode shape, its angular frequency and the mass tributary to a node where the force is applied. It can be calculated as in Equation (1) [7]:
2
ij ij j i
F =d ×ϖ ×m (1)
where: i is (number of node), and j is (number of mode). Fij is the force at node (i) in the (j) mode of vibration;
dij is The displacement of node (i) in the (j) vibration mode at the angular circular frequency of ωj; mi is the mass tributary to the node (i).
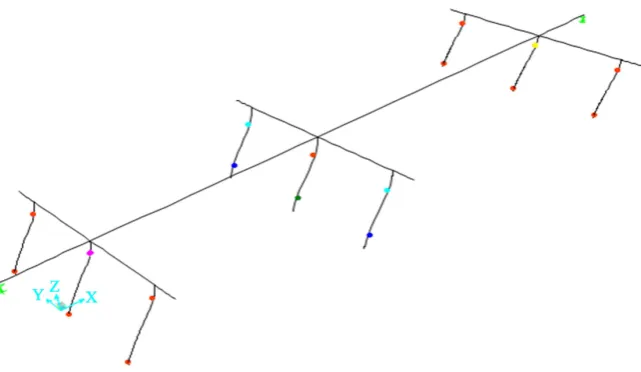
[image:8.595.214.535.498.684.2]SAP2000 generates the equivalent static loads at each time step of pushover analysis corresponding to structures modes are defined, the pushover procedure is cleared in manual of software tutorial as explained in details and verification in [7]. The controlling displacement at the monitored point was prescribed larg-er than the estimated possible ultimate displacement. The structure was pushed until its ultimate capacity was reached and a global failure formed. In longitu-dinal direction of bridge study case, the pushover deflection and creative plastic hinges is presented in Figure 4 at weak stiffness points between footing and pier. During the numerical analysis procedure of pushover analysis, Seismic de-mands are estimated by lateral loads that monotonically increase at each time step. The load modes remain the same, until a prescribed displacement is rea- ched or the structure collapses which one achieved firstly in analysis. The equivalent
Figure 4. Creation of plastic hinges of pushover analysis in longitudinal direction of
DOI: 10.4236/ojce.2017.73024 356 Open Journal of Civil Engineering seismic loads can be forces as well as displacements, and the associated control methods are force and displacement control methods. There are main two dis-advantages points of the force control method compared to displacement con-trol method; the first disadvantage point in force concon-trol method is the difficulty to refine the force vector increment at each step of the increment analysis after inelasticity develops in the structure. The Second disadvantage point, possibility of reaching to the maximum lateral force and stop the analysis iteration prior to developing the ultimate displacement, [14] and [15].
For that, the displacement control method is more suitable and is adopted in this research. SAP2000 is a nonlinear finite element program software analysis tools, that was used to monitor a target displacement is prescribed at a moni-tored point, which is usually the mass center of a bridge.
After the pushover analysis has been performed, a static pushover curve and a capacity spectrum of the structure could be generated for each load case. The pushover curve was in the form of the displacement at the monitored point verses the base shear, which is the total force reaction on all the supports in each global direction.
[image:9.595.210.536.489.684.2]A Capacity Spectrum curve in longitudinal direction is shown in Figure 5; printed from finite element model program output (print screen). On the spec-trum area, capacity specspec-trum and demand specspec-trum were plotted in the spectral acceleration versus spectral displacement coordinates. The blue line is the single demand spectra with variable damping, and the red lines are demand spectra with different damping ratios. Capacity curves of study case bridge in both di-rection longitudinal and transversal didi-rection respectively is shown in Figure 6. The capacity spectrum curve presents the relation between the top displace-ments of bridge pier compared to the maximum base shear force corresponding to peak pier displacement with hard soil effects with fixed damping coefficient.
Figure 5. Displacement capacity spectrum in longitudinal direction of Al-Fahs bridge;
DOI: 10.4236/ojce.2017.73024 357 Open Journal of Civil Engineering
Figure 6. Capacity spectrum curve of the pushover analysis for Al-Fahs Bridge on hard
Capacity spectrum curve of a static Pushover curve and capacity spectrum of the pier bridge presents in Figure 6; maximum displacement at mentioned point verses to the base shear; which is the total accumulative base shear reaction of all piers in each global direction. In longitudinal direction of study case bridge the maximum base shear value is larger its corresponding base shear in transversal direction of bridge by average percentage 5% - 7% due to the difference of equivalent total pier stiffness in both direction which is proportional directly with bridge stiffness. The small difference percentage of total base shear of study case can be explained by circular cross section of pier that has the same stiffness in both direction, but the total equivalent stiffness effected by parallel and series connection of piers.
In this study pushover analysis done under three soil structures interaction circumstances; the first one was the datum of comparison which is as per origi-nal design that was neglect SSI and called as Hard Soil as shown in Figure 6 the capacity spectrum curve of the pushover analysis for study case (Al-Fahs Bridge), the others two cases of push over analysis will take into consideration one is simulate the SSI as Medium soil, and the second considered it as soft soil with soil properties as mentioned in Table 3 taking the footing size due to the soil bearing capacity of different soil.
Figure 7 and Figure 8 present the pushover curves of two different soil structure interaction effects are compared to the original design that was ignored SSI effects completely. The soil stiffness parameters of medium and soft soil is defined in finite element modeling as it was defined in Table 4 taking into con-sideration soil bearing capacity that is reflected on the bridge pier footing di-mension; which has direct effect on the overall soil simulation stiffness values to more realistic assumption and accurate simulation to get fair comparison and results analysis; The damping of the bridges is taken as 5% of the critical in all modes of the analysis.
It is obvious due to different flexibility levels of the bridge piers, the compari- 0
2000 4000 6000 8000
0.00 1.00 2.00 3.00 4.00 5.00 6.00
B
as
e R
eact
io
n
(
k
ip
s)
Displacement (in.)
Longitudinal direction
DOI: 10.4236/ojce.2017.73024 358 Open Journal of Civil Engineering
Figure 7. Capacity spectrum curves of Al-Fahs Bridge on different soil types, in
[image:11.595.210.536.291.458.2]longitu-dinal direction.
Figure 8. Capacity spectrum curves of Al-Fahs Bridge on different soil types, in
transver-sal direction.
son of the response of these types of soils will be useful in studying the effect of pier flexibility on the response of pushover bridge analysis. The soil surrounding the pier is considered as hard, medium, and soft soil, respectively.
Figure 7 and Figure 8 present the capacity spectrum curves of Al-Fahs Bridge (study case); in the longitudinal and transversal direction respectively. the foot-ing stiffness is increasfoot-ing due to soil types parameters from soft, medium, and hard soils with higher stiffness values, that reflect directly on the overall stiffness of whole structure that was increased from 25% to 45% for bridge stiffness, and the ultimate displacement was increased by 7% to 20% for 5.25 inches to 6.11 inches for medium and soft soil, respectively. On other side, the total base shear has significant decreased for soft soil by percentage 15% compared to hard soil at the corresponding step of the same displacement; in the longitudinal direc-tion, as shown in Figure 7.
In the bridge transversal direction the pushover displacement capacity curve 0
2000 4000 6000 8000
0.00 1.00 2.00 3.00 4.00 5.00 6.00 7.00
Ba
se
re
ac
ti
o
n
(k
ips
)
Displacement (in.)
Hard soil
Medium soil
Soft soil
0 2000 4000 6000 8000
0.00 1.00 2.00 3.00 4.00 5.00 6.00 7.00
B
as
e S
h
ear
(
k
ip
s)
Displacement (in.)
Hard soil
Medium soil
DOI: 10.4236/ojce.2017.73024 359 Open Journal of Civil Engineering has the same behaviour with lesser percentage of base shear decreasing and dis-placement increasing compared to the longitudinal direction of bridge, which is can be explained by the stiffness difference of bridge in both directions, as pre-sented in Figure 8. This also can explains structure rezones of soft foundations produced larger displacement the stiffness in both directions under pushover loadings with smaller base shear values compared to more medium and hard soils types.
6. Conclusions
This paper succeeds to present numerical analysis of Soil Structure Interaction (SSI) effects on the pushover analysis of short span reinforced concrete bridge pier of multi-spans without curve or skew in plan or elevation. The results from this study indicate the finite element modeling strategies of SSI modeling for three different cases, one is hard soil as datum of comparison with others two soils cases medium, and soft soils; to be more realistic of SSI modeling. In this study the footing size was taken into consideration due to the soil bearing capac-ity changes as important parameters during calculating SSI equivalent stiffness as it is presented in Table 4.
The paper succeeds to investigate the SSI effects of nonlinear pushover analy-sis of short spans RC bridges to evaluate the effects and sensitivity of global per-formance on dynamic characteristics and displacement capacity curve of study case bridge (Al-Fahs bridge); which is short span RC bridge existing in Riyadh, KSA, simulated SSI effects on the pushover analysis as nonlinear static analysis techniques to present the displacement and base shear capacity of study case for three different soils cases, hard (baseline), Medium, and soft soil.
The numerical finite element analysis and its results succeed to present simple representation of a soil-bridge pier system, yet one able to capture the effects of the most significant physical parameters. It has been found that SSI greatly af-fects the dynamic behavior of bridge piers leading to more flexible systems, de-crease damping and larger total bridge pier displacements. Besides a thorough investigation of the relative significance of various physical parameters of the system response, an easy-to-use approach that can be incorporated for a prelim-inary design of bridges and helpful for structural assessment, streng- thening and/or rehabilitation of existing short span RC bridges.
The main conclusion and technical explanation of the SSI effects can be sum-marized in the following points:
1) Both peak displacement and base shear are reduced due to the further flex-ibility introduced to the system when SSI is accounted for. Thus considerations of the SSI effects will result in substantial reduction in the construction cost and/ or strengthening and repairs of new or existing bridges.
DOI: 10.4236/ojce.2017.73024 360 Open Journal of Civil Engineering high percentage compared to the stiff one,
3) Bearing damping does not influence the effects of SSI. This is due to fact that the soil damping is more dominating the bridge response in comparison to bearing damping.
References
[1] Priestley, M.J., Seible, F. and Calvi, G.M. (1996) Seismic Design and Retrofit of Bridges. John Wiley & Sons, Inc., New York.
https://doi.org/10.1002/9780470172858
[2] Federal Emergency Management Agency (1997) National Earthquake Hazards Re-duction Program (NEHRP) Guidelines for the Seismic Rehabilitation of Buildings (FEMA 273). Federal Emergency Management Agency, Washington DC.
[3] ACI-318 (2008) Building Code Requirement for Structural Concrete. American Concrete Institute, Detroit.
[4] Applied Technology Council (ATC) (1996) Seismic Evaluation and Retrofit of Concrete Bridges. ATC-40, Redwood City.
[5] Chaudhary, M.T.A. (2016) Effect of Soil-Foundation-Structure Interaction and Pier Column Non-Linearity on Seismic Response of Bridges Supported on Shallow Foundations. Australian Journal of Structural Engineering, 17, 67-86.
https://doi.org/10.1080/13287982.2015.1116178
[6] Spyrakos, C.C. (1990) Assessment of SSI on the Longitudinal Seismic Response of Short Span Bridges. Engineering Structures, 12, 60-66.
https://doi.org/10.1016/0141-0296(90)90038-T
[7] Structural Analysis Program (2000) SAP2000 18.0.1. Computer and Structures, Inc., Berkeley.
[8] Wolf, J.P. (1985) Dynamic Soil-Structure Interaction. John Wiley & Sons, Inc., New York.
[9] Jangid, R.S. and Kunde, M.C. (2006) Effect of Pier and Deck Flexibility on the Seis-mic Response of Isolated Bridges. Journal of Bridge Engineering, 11, 32-48. [10] Abeysinghe, R.S., Gavaise, E. and Rosignoli, M. (2002). Pushover Analysis of
Inelas-tic Seismic Behavior of Greveniotikos Bridge. Journal of Bridge Engineering, ASCE, 7, 115-126. https://doi.org/10.1061/(ASCE)1084-0702(2002)7:2(115)
[11] Dutta, S.C., Bhattacharya, K. and Roy, R. (2004) Responses of Low-Rise Building under Seismic Excitation Incorporating Soil Structure-Interaction. Soil Dynamics and Earthquake Engineering, 24, 893-914.
https://doi.org/10.1016/j.soildyn.2004.07.001
[12] Mylonakis, G., Nikolaou, S. and Gazetas, G. (2006) Footings under Seismic Loading: Analysis and Design Issues with Emphasis on Bridge Foundations. Soil Dynamics and Earthquake Engineering, 26, 824-853.
https://doi.org/10.1016/j.soildyn.2005.12.005
[13] Zhang, Y.I., Cofer, W.F. and McLean, D.I. (1999) Analytical Evaluation of Retrofit Strategies for Multicolumn Bridges. Journal of Bridge Engineering, ASCE, 5, 143- 150. https://doi.org/10.1061/(ASCE)1084-0702(1999)4:2(143)
[14] Lee, C.L., Chen, Y.T., Chung, L.L. and Wang, Y.P. (2006) Optimal Design Theories and Applications of Tuned Mass Dampers. Engineering Structures, 28, 43-53.
DOI: 10.4236/ojce.2017.73024 361 Open Journal of Civil Engineering [15] Rafik, I. and Xin, L. (2003) Effects of Retrofitting Applications on Reinforced Con-crete Bridges, Research Project T 2696. Washington State Transportation Commis-sion and Department of Transportation Federal Highway Administration, Wash-ington DC.
Submit or recommend next manuscript to SCIRP and we will provide best service for you:
Accepting pre-submission inquiries through Email, Facebook, LinkedIn, Twitter, etc. A wide selection of journals (inclusive of 9 subjects, more than 200 journals)
Providing 24-hour high-quality service User-friendly online submission system Fair and swift peer-review system
Efficient typesetting and proofreading procedure
Display of the result of downloads and visits, as well as the number of cited articles Maximum dissemination of your research work


![Table 3. Closed form expressions for stiffness of equivalent soil spring [11] [12].](https://thumb-us.123doks.com/thumbv2/123dok_us/7735158.706642/6.595.210.542.515.682/table-closed-form-expressions-stiffness-equivalent-soil-spring.webp)