Estimation of Intermodulation Rejection Value as a
Function of Frequency in Power Amplifier Using AM-AM
and AM-PM Diagrams Based on Power Series Analysis
Aazar Saadaat Kashi*, Mahmoud Kamarei, Mohsen Javadi
Department of Electrical and Computer Engineering, University of Tehran, Tehran, Iran Email: *[email protected]
Received May 4,2012; revised June 4, 2012; accepted June 11, 2012
ABSTRACT
A method to predict intermodulation (IM) products of two tone test based on Amplitude to amplitude (AM-AM) and amplitude to phase (AM-PM) diagrams of power amplifier is proposed in this paper. An RF power amplifier is mathe- matically modeled by a power series in order of 13. Coefficients of the transfer function are obtained by odd-order polynomial fitting of the transfer function of the power amplifier that is modeled by power series, with AM-AM and AM-PM diagrams. Because of considering AM-PM distortion, coefficients have become complex. By using this trans- fer function, analytical expressions of IM products are derived. Frequency effect of IM products are modeled in sug- gested method to estimate the effects of changing in input frequency on output. With the mean of this factor the model is able to predict IM products of wideband frequency input. Simulated results agree well with the predicted method in comparisons.
Keywords: Intermodulation Product; Two Tone Test; RF Power Amplifier; Power Series; AM-AM and AM-PM Diagrams
1. Introduction
In modern communication systems, digital communica- tion schemes, such as code division multiple access, where the information is carried are admitted by various sys- tems. The purpose that makes CDMA spectrally efficient and popular in recent digital mobile communication sys- tems lies in allocation a unique code for each user, so a certain number of users can communicate at the same time and frequency.
Although, the high spectral efficiency gained by using a CDMA scheme, it degrade at the cause of spectral re- growth that is inevitably generated when signal is passed through nonlinear devices of a RF transmitter.
As in other communication systems, one of the critical and costly components in digital cellular communication systems is RF power amplifier. The power amplifier is the major source of nonlinearity in a communication sys- tem. To increase their efficiency, power amplifiers are sometimes driven into their nonlinear region [1], thus causing spectral regrowth, increasing bit error rate, inter- ference to adjacent channel, and intermodulation prod- ucts to be generated. In extreme these IM products can interfere with signals that are being amplifies [2].
Since the spectral regrowth is stringently regulated and is mostly generated by a nonlinear RF power amplifier [3], it is very important for RF system designers to pre- dict the distortion effects of power amplifiers and ana- lyze its effect on the output.
Given certain power amplifier characteristics, it is de- sirable to be able to predict, without running time-domain simulations, whether the power amplifier can be used to amplify certain type of signals, i.e. the amount of spectral regrowth is within limits [4]. This is due to the fact that channel impairments like the intermodulation distortion can be readily estimated with the knowledge of the non- linear characteristics of the power amplifier, and properly modeled it [5].
Since, third-order polynomials for modeling the non- linearities are suitable for weakly nonlinear systems [6], this paper presents an analytical expression that predicts IM products of the output of power amplifier. With the mean of power series transfer function (in order of 13) and AM-AM and AM-PM distortions of power amplifier, it modeled and analyzed to predict first, third, and fifth order IM products of the output.
One of the advantages of the presented model is that it uses both AM-AM and AM-PM diagram to characterize power amplifier transfer function. The phase variations
have an important effect on the spectral regrowth [7]. However, similar previous models only used AM-AM diagram to characterize power amplifier’s transfer func- tions [3,8-11] while such an effect is considered in [7,12- 15]. Although, in this case, transfer function’s coeffi- cients have become complex and this increases the diffi- culty of the calculations, but neglecting the AM-PM dis- tortion causes many problems in predicting output spec- trum [16-18]. Considering variation in output response of power amplifier with disparity on input frequency is the major factor that is deliberated in our model. It is found that adjacent channel power ratio performances is not only dependent on the input signal magnitude (or power) but also dependent on the bandwidth of the signal that is used [19]. Main advantage of this model is that we don’t neglect the frequency dependence of power amplifier’s transfer function coefficient that makes asymmetric spec- trum in the upper and lower band which is not taking into consideration in [3,7,14,15]. The factor is added in our model with considering our transfer function’s constants as a function of input frequency besides they are complex. With considering frequency effect, this model is able to be used for wide band frequency range inputs such as UWB systems, WCDMA input, and input signals with complexity in their phase or frequency. With the mean of this method we also can analyze power amplifier systems in the case that their circuit is not reachable.
2. Power Series Model of Power Amplifier
Estimating a perfect nonlinear model of power amplifier that can describe output characteristics is of the great importance. In this part power series model of power amplifier is described, and with using this model and AM-AM and AM-PM diagrams, output IM products will be predicted.
Generally speaking, a practical amplifier is only a lin- ear device in its linear region, meaning that the amplifier output will not exactly a scaled copy of the input signal when the amplifier works beyond linear region [9].
Considering an amplifier as a function box it can be modeled by a power series [20,21]. The input signal is of the form:
cos
Re
ej t ej tc
c
x t A t w t t x t (1)
where A(t) is an amplitude and θ(t) is a phase of carrier,
ωc is the carrier angular frequency, and x t
denotes the base band equivalent input signal.
Because of nonlinearities of the power amplifier that can represent by AM-AM and AM-PM distortion the amplitude and phase of the output are affected, respec- tively.
The output can represent as follow [7]:
Re
Re
cos
c
c
j t j t
j t j t
c
y t y t e e
F A t e e
F A t t t F A t
N n
n n
(2)
where y(t) represents the equivalent output signal and
F(A(t)) denotes the complex envelope transfer function of the power amplifier. Function F can be represented by a power series or by an orthogonal function expansion or perhaps reasonably well approximated over the range of
x(t) by a polynomial in x [22]. With considering power series model and using baseband equivalent model for power amplifier, we can represent F as:
y t F x t
a x t
(3)
*
Re
1
2
c
c c
j t j t
j t j t j t j t
x t x t e e
x t e e x t e e
(4)
By using the binomial expansion for xn(t) and consid- ering only the first zone components we obtain [22]:
2 *
0 1
1 * 2 1
1 2
1
for : odd 2
c
n k n k
j t j t k n
n k
n n
k n
n n
n
x t C x t x t e
C x t x t n
(5)
The complex envelope of the first-zone component of
y(t) is:
1
2 2
1 * 2 1
2 1 2 0 2
N
m m
m m m m
a
y t x t C x t
1
N n n n
(6)
With simplify Equation (6), we can write the base band output signal as follow if we assume that the θ(t) (phase of carrier) is zero:
y t a x t
n: odd (7)
In power amplifier transfer function’s coefficients cha- racterization, if only AM-AM distortion is considered the coefficients that are obtained from the fitting of AM-AM diagram and proposed transfer function, have become real. Also neglecting the AM-PM distortion causes many problems in predicting IM products and then output spectrum.
In this model, the coefficients an would be obtained by
fitting a polynomial of degree N to AM-AM and AM-PM diagrams of power amplifier that obtained by simulation of power amplifier in ADS. The coefficient an considered
such model [22]. In this work we only consider first 13th terms of power series.
3. Predicting IM Products with the Mean of
Power Amplifier Model
When multiple signals are passed through a common am- plifier, the nonlinearity of amplifier cause intermodula- tion (IM) products to be generated [2]. One of the major areas in analyzing nonlinear effect of power amplifier is considering variation in output response of power ampli- fier with disparity on input frequency. Variation in IM product with frequency is deliberate in our model.
With considering frequency effect, the method is able to predict IM products of every type of input such as WCDMA or input signals with complexity in their phase or frequency. Also, it can use to analyze power amplifi- ers system when their circuit details are not reachable.
Generally, IM3 is used as a linearity parameter, but when an input signal becomes large, higher order IM products are also generated [3]. So, by using our model, an analytical expression that relates IM product in gen- eral order to the amplitude of the input of two tone test is derived.
Input signal of the two tone test can be considered as follow:
c
cos cos
2 2
cos cos Re cos
c c
j t t
t e
c s s
x t t
s t t s
(8)
where s 2 is an amplitude of each tone. By comparing this equation with Equation (1), we can represent the base- band input signal as:
cos
x t s t (9) The baseband output signal with respect to Equation (8) can be represented as follow [7]:
2 1 2 1
2 1 2 1
1 1
2 1
3 1 2
1 3 1 2 1
2 1
3 2 2
3 1 2 1
2 1 2 1 1 1 3 3 4 4 1 co 4 4 1
cos 2 1
4
cos cos 3
N N n n n n n n N N N N N N N N N N N N N
y t a x t a s
C
a s f s a s
C
f s a s
a s N
y t y
2 1
1
1
cos ( )
cos s 3 n t t t t
5 t
2n1
y
5 2 1 2 1 1 coscos 2 1
cos 2 1
N N
n n
t y
y N t
y n t
(10)where is an output complex envelope of IM2n–1.
So we can write an analytical expression for IM2n–1 as
a function of amplifier characteristics and input ampli- tude “s”, as follow:
2 1
2 1 2 1 4 1 2 1
j N
j n j
n j j
j n C
y a s
(11)
4. Simulation Results
Verify our derivation, a simulation of an RF power am- plifier with ADS simulator is performed. The carrier fre- quency is 850 MHz. To predict the IM products, power amplifier’s transfer function coefficients that are the func- tion of input frequency must be obtained first. To evalu- ate these coefficients (a2n+1) the amplifier is simulated
with one-tone input in ADS and the input voltage is swept in its range to AM-AM and AM-PM diagrams are obtained.
Amplitude to amplitude and amplitude to phase distor- tions are two distortion effects in power amplifiers at high output power levels, causing out of band interfer- ence in the transmitted signal and a bit errors in the re- ceived signal [23]. Using diagrams and our analytical equation for the output, complex coefficients a2n+1 will be
found by odd order polynomial fitting that perform in MATLAB. Power amplifier’s coefficients must show its nonlinearity, so, we should simulate our circuit both in linear and nonlinear region. On the other hand, input voltage must sweep to voltages that make the circuit be- ing in its nonlinear region.
Power amplifier’s AM-AM and AM-PM diagrams that are simulated in wide range of Vin to shows nonlinear
region are indicated in Figure 1. Also, the figure shows fitting diagram with different color that is used to calcu- late power amplifier’s transfer function complex coeffi- cients.
To obtain frequency function coefficients, 10 tests in ADS with previous condition are performed with differ- ent input frequency in each test and complex coefficients for each test are obtained with the method that is de- scribed. Input frequency varies between (850 + B) MHz and (850 – B) MHz to fill the range (B = 0.62 MHz). After these tests, 10 complex values for each coefficient are acquired. Hence, each coefficient with the mean of these 10 values has the equation which frequency is its- variable.
To validate our analysis, with the mean of our equa- tions and coefficients we can draw IM1,3,5 diagrams (am-
plitude and phase) as a function of input amplitude of two-tone test “s”. We compare these diagrams with those we get from two-tone test of our power amplifier that simulated in ADS. For considering frequency effect in our analysis, we must posit our coefficients a2n+1 as a
Input Voltage(v)
Out
p
u
t
V
o
lt
a
g
e(
v
)
0 0.5 1 1.5 2 2.5 3 3.5 4
0 2 4 6 8
10 AM-AM
Fit Diagram
(a)
Input Voltage(v)
Ou
tp
ut
P
h
a
se
0 0.5 1 1.5 2 2.5 3 3.5 4
0.85 0.9 0.95 1 1.05
1.1 AM-PM
Fit Diagram
(b)
Figure 1. (a) Amplitude to amplitude (AM-AM) and (b) Mag- nitude to phase of output in compare with diagram that fitted in MATLAB.
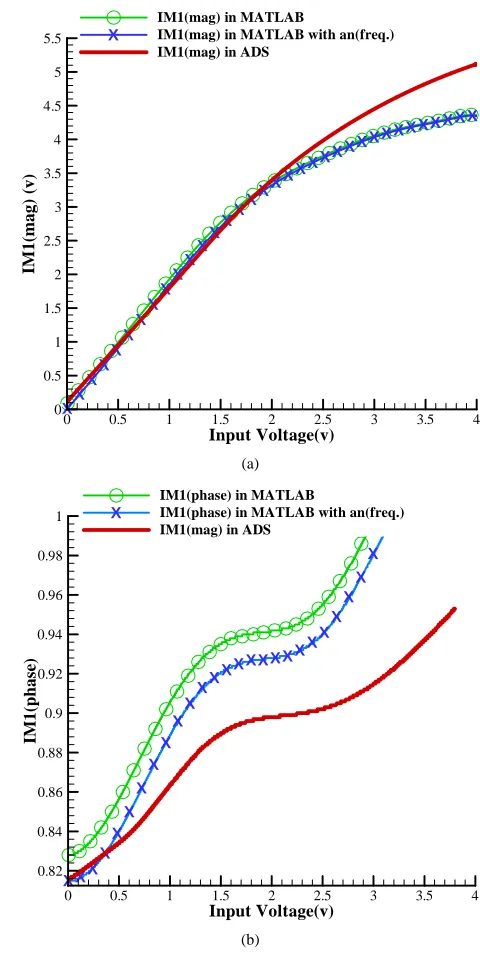
Result of our simulation in compare with analytical expression (with or without considering frequency effect) for IM1,3,5 (phase and amplitude) are plotted in Figures
2-4. In all figures, diagrams that frequency effect iscon- sidered in their a2n+1 coefficients (blue), show better fit to
simulated results (red) than the other one (green). In Equations (8) and (11), it is obvious that every coeffi- cient related to one type of nonlinearity or are the domi- nate factor in them. For example a1 is the dominate factor
in IM1. It shows that little variation in its value makes
huge change in predicting IM1. Without any doubt, errors
that occurred in fitting make some errors in calculating
XX XX
XX XX
XX XX
XX XX
XXX XXXX
XXX XX
X XX XXX
Input Voltage(v)
IM
1(m
ag)
(v)
0 0.5 1 1.5 2 2.5 3 3.5 4
0 0.5 1 1.5 2 2.5 3 3.5 4 4.5 5 5.5
IM1(mag) in MATLAB
IM1(mag) in MATLAB with an(freq.) IM1(mag) in ADS
X
(a)
XXX X
X X
X X
X X
X XX
XXXXXX XX
X X
X X
X XX
IM1(phase) in MATLAB
IM1(phase) in MATLAB with an(freq.) IM1(mag) in ADS
X
1
0.98
0.96
0.94
IM
1
(pha
se
)
0.92
0.9
0.88
0.86
0.84
0.82
Input Voltage(v)
0 0.5 1 1.5 2 2.5 3 3.5 4
(b)
Figure 2. (a) Magnitude and (b) Phase of IM1 in compare with analytical expression that plotted in MATLAB.
coefficients a2n + 1.
As we can see in Figure 2, the difference between predicted and simulated results is due to the a2n+1 but
difference in IM1 (magnitude or phase) is higher than
IM3 or IM5. The cause of this error is due to the higher
value of a1, that is the dominate factor in calculating IM1,
than the other factors. The coefficient a1 is related to the
linear gain G of the amplifier, and the coefficients a3 and a5, that are the dominate factors in calculating IM3 and
IM5, respectively, are directly related to IP3 and IP5. Be-
[image:4.595.298.538.82.559.2] [image:4.595.57.293.86.537.2]XXXXXXXXXXXXX XXXXXXX
XX XX
XX XX
XX XX
XX XX
XX XX
XX XX
XX X
Input Voltage(v)
IM
3
(m
ag)
(v)
0 0.5 1 1.5 2 2.5 3 3.5 4
0 0.05 0.1 0.15 0.2 0.25 0.3 0.35 0.4 0.45 0.5 0.55 0.6 0.65
IM3(mag) in MATLAB
IM3(mag) in MATLAB with an(fre IM3(mag) in ADS
q.)
X
(a)
XXXXXXXXX XX
X X
XX
XXXXXXXXXXXXXXXXXXX
Input Voltage(v)
IM
3
(pha
se
)
0 0.5 1 1.5 2 2.5 3 3.5 4
-3.2 -2.4 -1.6 -0.8 0 0.8 1.6 2.4 3.2
IM3(phase) in MAT IM3(phase) in MAT IM3(phase) in ADS
LAB
LAB with an(freq.)
X
(b)
Figure 3. (a) Magnitude and (b) Phase of IM3 in compare with analytical expression that plotted in MATLAB.
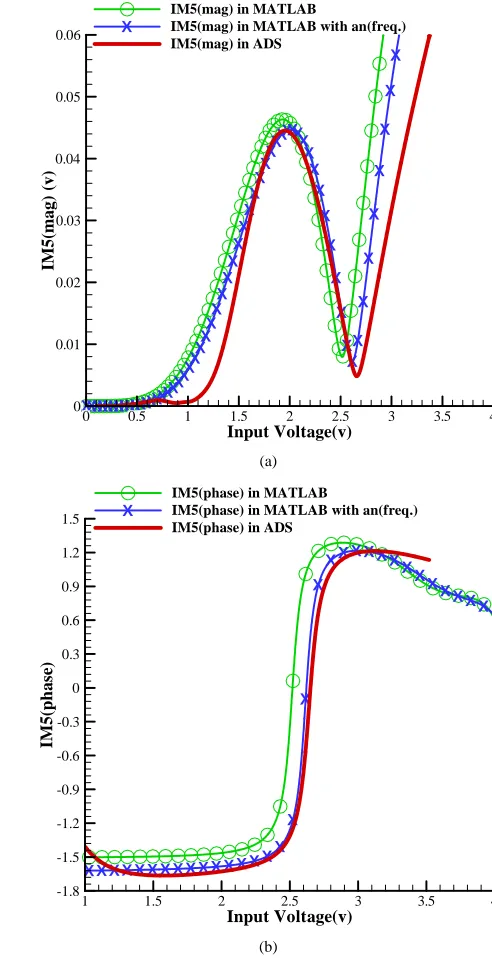
they have smaller values than a1 and, so, error in a1 shows
higher difference than errors in a3 and a5, as we can see
in Figures 3 and 4.
Totally, results show that both magnitude and phase of each frequency (each IM) are predicted well by Equation (11), and have better match if we consider frequency effect. Though we did not compare it with real measure- ment results, HB (Harmonic Balance) simulation in ADS is known as the most accurate simulation method for a real system.
5. Conclusion
In this paper, we proposed a method to predict inter mo-
XXXXXXXXXXXXXXXX XXX
XX XX
XX X
X X
X X
X XX
XX XXXXXX
X X
X
X
X
X
X
X X
X X
X X
X X
X X
Input Voltage(v)
IM
5
(m
ag)
(v)
0 0.5 1 1.5 2 2.5 3 3.5 4
0 0.01 0.02 0.03 0.04 0.05 0.06
IM5(mag) in MATLAB
IM5(mag) in MATLAB with an(freq.) IM5(mag) in ADS
X
(a)
X X X X X X X X X X X X XX X X
X X
X
XX X X X XX X
X XX X X
Input Voltage(v)
IM
5(
p
h
as
e)
1 1.5 2 2.5 3 3.5 4
-1.8 -1.5 -1.2 -0.9 -0.6 -0.3 0 0.3 0.6 0.9 1.2 1.5
IM5(phase) in MATLAB
IM5(phase) in MATLAB with an(freq.) IM5(phase) in ADS
X
(b)
Figure 4. (a) Magnitude and (b) Phase of IM5 in compare with analytical expression that plotted in MATLAB.
[image:5.595.70.382.78.532.2] [image:5.595.289.535.86.565.2]our method is accurate.
REFERENCES
[1] R. Raich, H. Qian and G. T. Zhou, “Orthogonal Polyno- mials for Power Amplifier Modeling and Predistorter De- sign,” IEEE Transactions on Vehicular Technology, Vol. 53, No. 5, 2004, pp. 1468-1479.
doi:10.1109/TVT.2004.832415
[2] B. Larkin, “Multiple-Signal Intermodulation and Stability Consideration in the Use of Linear Repeaters,” Proceed-
ing of 41st IEEE Vehicular Technology, St. Louis, 19-22 May 1991, pp. 747-752.
[3] Q. Wu, M. Testa and R. Larkin, “Linear RF Power Am- plifier Design for CDMA Signal,” IEEE MIT-S Digest, Corvallis, June 1996, pp. 851-854.
[4] G. T. Zhou and J. S. Kenney, “Predicting Spectral Re- growth of Nonlinear Power Amplifiers,” IEEE Transac-
tions on Communications, Vol. 50, No. 5, 2002, pp. 718- 722. doi:10.1109/TCOMM.2002.1006553
[5] C. H. Tseng, “Estimation of Cubic Nonlinear Bandpass Channels in Orthogonal Frequency-Division Multiplexing Systems,” IEEE Transaction on Communications, Vol. 58, No. 5, 2010, pp. 1415-1425.
doi:10.1109/TCOMM.2010.05.080573
[6] M. E. Gadringer, C. Schuberth and G. Magerl “Behav- ioral Modeling of the Frequency Translation Process in Direct Conversion Transmitters,” International Journal of
RF and Microwave Computer-Aided Engineering, Vol. 20, No. 3, 2010, pp. 347-359.doi:10.1002/mmce.20439
[7] S. J. Yi, S. Nam, S. H. Oh and J. H. Han, “Prediction of a CDMA Output Spectrum Based on Intermodulation Prod- ucts of Two-Tone Test,” IEEE Transaction on Microwave
Theory and Techniques, Vol. 49, No. 5, 2001, pp. 767- 946. doi:10.1109/22.920152
[8] A. H. Coskun and S. Demir, “A Mathematical Charac- terization and Analysis of a Feed forward Circuit for CDMA Applications,” IEEE Transaction on Microwave
Theory and Techniques, Vol. 51, No. 3, 2003, pp. 767- 777. doi:10.1109/TMTT.2003.808582
[9] C. Liu, H. Xiao, Q. Wu and F. Lit, “Linear RF Power Amplifier Design for Wireless Signals: A Spectrum Analy- sis Approach,” International Conference on Acoustics,
Speech, and Signal Processing, Vol. 4, 2003, pp. 568- 571.
[10] A. M. A. Hemmatyar and F. Farzaneh, “Predicting of Inter- Modulation Rejection Values for the First and Second Adjacent Channels in Feed-Forward Linearised Micro- wave Amplifiers Using Closed-Form Expressions,” IET Microwaves Antennas & Propagation, Vol. 1, No. 3, 2007, pp. 782-789. doi:10.1049/iet-map:20060342
[11] M. L. Ku, S. H. Lu, L. C. Wang and S. H. Yan, “Nonlin- ear Effect of Receiver Amplifier for 60 GHz Radio Com- munication,” IEEE International Conference on Vehicu- lar Technology, 5-8 September 2011, pp. 1-5.
doi:10.1109/VETECF.2011.6093112
[12] K. G. Gard, H. M. Gutierrez and M. B. Steer, “Charac- terization of Spectral Regrowth in Microwave Amplifiers Based on the Nonlinear Transformation of a Complex Gaus- sian Process,” IEEE Transaction on Microwave Theory
and Techniques, Vol. 47, No. 7, 1999, pp. 1059-1069. doi:10.1109/22.775437
[13] G. T. Zhou, “Analysis of Spectral Regrowth of Weakly Nonlinear Power Amplifiers,” IEEE Communication Let-
ters, Vol. 4, No. 11, 2000, pp. 357-359.
[14] C. Liu, H. Xiao, Q. Wu and F. Li, “Linear RF Power Amplifier Design for TDMA Signals: A Spectrum Analy- sis Approach,” Proceedings of International Conference
on Acoustics, Speech, and Signal Processing, Salt Lake City, Vol. 4, May 2001, pp. 2665-2668.
doi:10.1109/ICASSP.2001.940550
[15] M. M. Rahmati, A. Abdipour, A. Mohammadi and G. Moradi, “An Analytic Approach for CDMA Output of Feed forward Power Amplifier,” Analog Integrated Cir-
cuit and Signal Processing, Vol. 66, No. 3, 2011, pp. 349- 361.
[16] E. Cottais, Y. Wang and S. Toutain, “Spectral Regrowth at the Output of a Memoryless Power Amplifier with Multicarrier Signals,” IEEE Transactions on Communi-
cations, Vol. 56, No. 7, 2008, pp. 1111-1118. doi:10.1109/TCOMM.2008.050149
[17] J. P. Aikio and T. Rahkonen, “A Comprehensive Analysis of AM-AM and AM-PM Conversion in an LDMOS RF Power Amplifier,” IEEE Transactions on Microwave The-
ory and Techniques, Vol. 57, No. 2, 2009, pp. 262-270. doi:10.1109/TMTT.2008.2011161
[18] S. Meza, M. O’Droma, Y. Lei and A. Goacher, “Some New Memory Less Behavioral Models of Wireless Trans- mitter Solid State Power Amplifiers,” IEEE Automation,
Quality and Testing, Robotics, Vol. 1, 2008, pp. 96-98. doi:10.1109/AQTR.2008.4588714
[19] M. Masood, J. Staudinger, J. Wood, M. Bokatius and J. S. Kenney, “Linearity Considerations for a High Power Do- herty Amplifier,” IEEE International Conference on Power
Amplifier for Wireless and Radio Applications, Atlanta, 15-18 January 2012, pp. 77-80.
doi:10.1109/PAWR.2012.6174912
[20] L. W. Couch, “Digital and Analog Communication Sys- tems,” Prentice-Hall Inc., Upper Saddle River, 1996.
[21] T. S. Rappaport, “Wireless Communication Principle and Practice,” Prentice-Hall Inc., Upper Saddle River, 1996.
[22] M. C. Jeruchim, P. Balabon and K. S. Shanmugan, “Simu- lation of Communication Systems,” Kluwer Academic Publishers, Springer, New York, 2002.
[23] A. Chatterjee, S. Devarakond and S. Sen, “Phase Distor- tion to Amplitude Conversion-Based Low-Cost Meas- urement of AM-AM and AM-PM Effects in RF Power Amplifiers,” IEEE Transaction on Very Large Scale In-