Determination of threshold random gain medium in
dye: Polymer films containing TiO
2
nanoparticles
Baha T. Chiad1, Mohammed A. Hameed1, Firas J. Kadhim1, Kamil H. Latif2
1Department of Physics, College of Science, University of Baghdad, Baghdad, Iraq; mohammed.hameed75@ scbaghdad.edu.iq,
2Ministry of Environment, Baghdad, Iraq
Received 6 November 2011; revised 10 December2011; accepted 29 December 2011
ABSTRACT
Random gain medium based on organic Rho- damine 590 (R590) laser-dye and Titanium di- oxide (TiO2) suspended nanoparticles have been
prepared with polymethylmethacrylate (PMMA) as a host. Spray-coated homogeneous film sam- ples of 22.4 µm thickness. Optimum concentra- tions have been determined depending on the normal fluorescence spectra which give evi- dence that the laser dye provides amplification and TiO2 nanoparticles act as scatter center. At
the optimum concentrations, results of the ran-dom gain medium under second harmonic Nd: YAG laser excitation shows that the values of bandwidth at full width half-maximum (FWHM) and the threshold energy are about 11 nm and 10 mJ respectively.
Keywords:Random Gain Medium; Random Laser; Internal Resonator
1. INTRODUCTION
Random lasers (RL) are unique sources of stimulated emission in which the feedback is provided by scattering in a gain medium [1,2]. Random laser effects have been observed in a variety of organic and inorganic gain media including powders of solid-state luminescent and laser crystals [3,4], liquid laser dyes with scatterers [5], poly- meric films with and without intentionally introduced scatterers [6], ZnO scattering films and nanoclusters [7], dye-infiltrated opals [8], porous media infiltrated with liquid crystals with dyes [9] and many others. Random lasers are very attractive for a variety of applications, low coherent random laser sources can be advantageous in holography, laser inertial confinement fusion (driver sources for megajoule lasers), transport of energy in fi- bers for medical applications, and other applications, detailed reviews of random lasers can be found in [10,11].
Random lasers are strongly scattering media that amplify light. There are striking similarities between these sys- tems and more conventional lasers based on a gain me- dium enclosed in a cavity with two mirrors to provide optical feedback. An example is the observation of a threshold for lasing action and frequency narrowing in random lasers. Evidently, the optical properties of ran- dom lasers are quite different from those of conventional lasers: The propagation of pump and fluorescence light is diffusive in a random laser. In contrast with cavity sys- tems, scattering is actually advantageous. Since feedback is provided by multiple scattering, the random laser threshold is lowered by a stronger scattering, i.e., a shorter transport mean free path, because the feedback is more efficient. It has been shown that the threshold in random lasers is reduced dramatically when the photon transport mean free path approaches the stimulated emission wave- length [12].
On other hand, gain narrowing denotes a decrease of the width of the spectrum of the emitted light triggered by an increase in the pump fluence. The width will be characterized by the at full width half maximum (FWHM). Gain narrowing is observed in all laser sys- tems [13]. In a random laser the FWHM of the spectrum of the emitted light below the threshold of the laser is approximately the width of the emission spectrum of the gain medium (typical 40 nm) for R6G. However, far above threshold, this FWHM can be as narrow as 10 nm. A measure for the gain narrowing is the narrowing factor NF, defined as the FWHM of the emitted light below threshold (FWHM below) divided by the FWHM of the emission spectrum of a random laser far above threshold (FWHM above) [14,15].
mum TiO2 nanoparticles concentration, the emission in- tensity spectra at different Nd: YAG pumping energies were investigated to determine the lasing threshold [17].
2. EXPERIMENTAL
2.1. Chemicals and Preparation
Rhodamine 590 laser dye (C28H31N2O3Cl) with mo- lecular weight 479.02 g/mol supplied by Lambda Physics LC (5900): Ethanol alcohol (C2H5OH) with spectro-scopic grade purity supplied by Gainland Chemical Company and chloroform (CH3CCl3) with spectroscopic grade purity supplied by Philip Harris chemical company U.K. Polymethylmethyleacrylate (PMMA) with chemical forms (CH2CH3COOCH3), supplied by fluka (Switzer-land), and used as a host for laser dye and nanoparticles. Titanium dioxide (TiO2, nanoparticles 50 nm) of Anatase crystal structure was acquired from Dupont Inc. The mean particle size TiO2 nanoparticles which is prepared as film, determined by a scanning electron microscope (SEM).
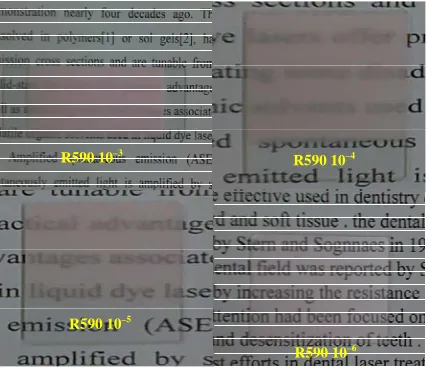
The solutions of laser dye are prepared by dissolving the required amount of the dye in ethanol. The concen- trations of dye solutions were: 10–3, 10–4, 10–5 and 10–6 mol/l. The powder of TiO2 was suspended in chloroform and its concentration was estimated based on the known weight fraction of TiO2 in the suspension. The PMMA solution is prepared with chloroform solvent at 10–2 mole/ liter. While final solutions, which are used in the de-composition process, prepared at maxing volume ratio: 4:3:3 of R590:TiO2:PMMA respectively. Spray pyrolysis technique was used to prepare the film samples. Figures 1 and 2 show the photographs of some prepared film samples.
The SEM electron beam produces charges on the surface
R590 10–3
R590 10–4
R590 10–5
R590 10–6
Figure 1. Photos of the spray pyrolysed sample films at
differ-ent R590 concdiffer-entrations and 8.56 × 1015 cm–3 of TiO
2 nanopar-ticles With PMMA as a host.
[image:2.595.308.535.84.251.2]Gold coating
Figure 2. Photos of some preparedfilm samples.
of the sample under test. These charges prevent getting a clear image and thus, the particles size can never be measured. This problem is eliminated by covering part of the sample surface with a gold coating to facilitate the discharging of the surface charge as shown in Figure 2.
[image:2.595.66.281.516.700.2]Figure 3 show random distributions of TiO2 nano- particles in the film sample (at a host polymer PMMA). The SEM unit is used to estimate the particle size of the TiO2 nanoparticles introduced as a suspension within the film samples prior to being sprayed as shown in Figure 2 for most tested samples, the value of the estimated particle size is found to be 52 nm and its comparable to the corresponding value of the standard TiO2 powder (50 nm). This means that Rayleigh scattering by TiO2 nano- particles in the prepared samples is dominant (the most occurrence). This is reasonable since Rayleigh scattering occurs when the particle size is far less than the wave- length of the incident light
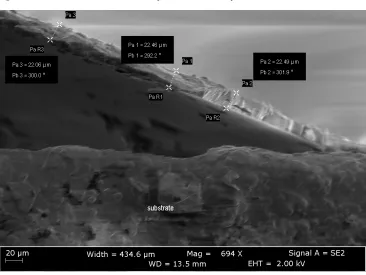
Figure 4 illustrates SEM topography image for the film sample. The thickness of coating in three different regions of the film as approximately the same giving indication of the homogeneity of the prepared film. Another purpose of the SEM test is that it can be employed to measure the thickness of film samples. The thickness of the film samples can be controlled by the number of sprays, which is associated with spraying time and the solution flow rate through the nozzle. For each sample, the thickness values, measured at different re- gions, are comparable and this also gives an indication about the homogeneity of film samples.
2.2. Experimental Setup
Figure 3. Random distribution of TiO2 nanoparticles at film sample.
Figure 4. Image of SEM for measuring thickness sample as film.
spot size of ~4 mm). A monochromator and photomulti-plier tube was used, successively, to select and detect the emission signals. A cylindrical lens was used to extend the laser spot along the film sample and thus, enabling a
[image:3.595.115.481.388.663.2]Analyzing Monochrometer Sample
PMT
X-Y recorder H.V power
supply
SHG
Mirror
[image:4.595.68.274.84.288.2]Cylindrical lens Nd YAG
Figure 5. Schematic diagram of RL experimental setup.
3. RESULT AND DISSECTION
The liquid samples derived from mixing R590 dye and TiO2 nanoparticles in the suspension, which are prepared as random gain media. In these samples, the TiO2 nano- particles have not been dissolved and are mixed within the solutions (but have not changed the color of the solu- tions even at high concentrations of TiO2 nanoparticles).
The film samples, which are prepared by the spray pyrolysed technique. These samples are shown to be highly homogeneous. The reason for the homogeneity of the prepared films is due to several factors such as se- lecting the special appropriate parameters of the chemi- cal spray technique like the number of sprays and the substrate temperature (maintained fixed at 80˚C). Fur- thermore, the spraying is done in an isolated ambient (i.e., clean atmosphere). On the other hand, the incorporation of the PMMA polymer as a host for both the R590 dye and the TiO2 nanoparticles has an advantage of obtaining transparent and homogeneous films in view of the many benefits it possesses such as the good compatibility in the laser dyes and the high optical homogeneity.
The photo stability obviously increases when the dye chromoform bind with the polymer chains. It’s for these reasons the polymer could be chosen as a host. These media are characterized by having appropriate thermal optical coefficients as well as they work in a wide tem- perature range and in small volumes.
The absorption and fluorescence spectra are recorded of all prepared samples as a function of concentrations of both R590 dye (as active molecules) and TiO2 nano- particles (as scatter center). These measurements give us an indication about the optimum concentrations for the samples which are prepared as random gain media.
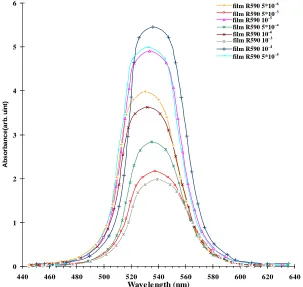
Film samples as shown in Figure 6 the results showed
0 1 2 3 4 5 6
440 460 480 500 520 540 560 580 600 620 640
Wave le ngth (nm)
Ab
so
rb
an
ce(
ar
b
. u
in
t)
film R590 5*10^-6 film R590 5*10^-3 film R590 10^-5 film R590 5*10^-4 film R590 10^-6 film R590 10^-3 film R590 10^-4 film R590 5*10^-5
film R590 5*10–6
film R590 5*10–3
film R590 5*10–4
film R590 5*10–5
film R590 10–5
film R590 10–6
film R590 10–3
film R590 10–4
Figure 6. Absorption spectra of the film samples at different dye concentrations
and at 8.56 × 1015 cm–3 TiO
[image:4.595.150.453.422.709.2]that the addition of the polymer PMMA as a host to R590 dye and TiO2 nanoparticles causes a red shift in the ab- sorption spectrum as compared to solutions without polymer. This is due to the increase in the perturbation field among molecules in addition to dimer formation as a result of dye molecules aggregation giving rise to its being absorbed at a higher energy than that of the monomers and being emitted at a lower energy.
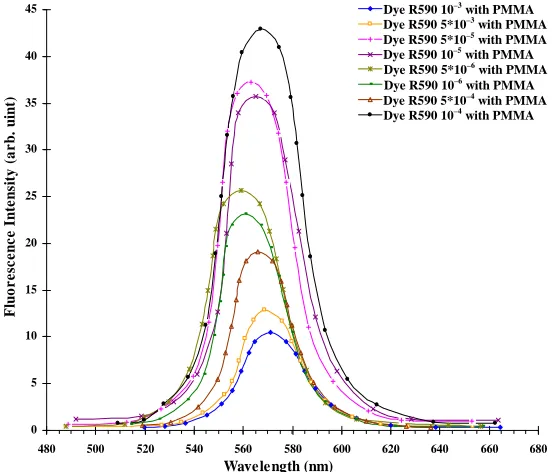
Upon mixing the different solution concentrations of the R590 dye with PMMA polymer as a host medium and measuring the fluorescence spectra, the obtained results revealed that the 10–4 mole/liter dye concentration within the polymer is the premium as illustrated in Fig- ure 7, concerning the fluorescence spectra of these sam- ples a red shift has been observed owing to the fact that increasing the concentration increases the molecules number per unit volume as well, i.e., increasing colli- sions between these molecules. This results in certain energy loss as heat and consequently, the shift to longer wave-lengths of emission occurred.
Shows Figure 8 the fluorescence spectra of dye solu- tion of a concentration of 10–4 mole/liter and at different TiO2 nanoparticles concentrations and from which the optimum 8.56 × 1015 cm–3 TiO2 nanoparticles concentra- tions has been selected where it has not changed the dye fluorescence and never quenched it by scattering. The dye and TiO2 nanoparticles concentrations that have been selected are therefore considered to be essentially the optimum where the presence of TiO2 nanoparticles scat- terers has not affected the spectral response of the pre- pared samples being present within the host medium.
The combining of R590 dye within polymer PMMA host as an active laser medium decreases degradation of the dye. These active media have eliminated the use of large volumes of organic solvents and in addition, it in- volves other benefits like good compatible with the dyes and the optical homogeneity, these media enabled the use of high-concentration dyes without dimer formation and dye quenching. It can be noticed that the increase of polymer solution solidity prevents the disintegration of excited dye molecule resulting from the photo chemical reactions. Thus, the dye stability increases and the fluo- rescence intensity increases as well. This is a result of dimer disintegration that ends the absorption process at the re-absorption fluorescence.
The polymer PMMA film samples doped with R590 dye and TiO2 nanoparticles have been prepared in which the TiO2 nanoparticles are randomly distributed within the PMMA host. These particles scatter photons and in- creased the path length photon walking in the film and cause amplified spontaneous emission (incoherent laser).
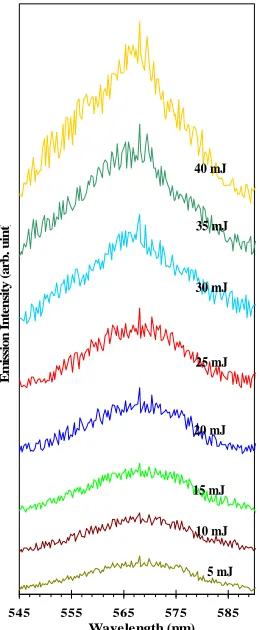
The AES emission intensity variation with the wave- length for the different excitation energies of the film selected sample, it can be noticed from these spectra that the emission intensity increases and the FWHM de- creases within the 5 - 40 mJ range increase of the excita- tion energy. For the film sample under study, the ob- tained narrowest bandwidth at FWHM is 11 nm. This dependence is more clarified in the Figure 9 plotted for comparison purpose. In accordance with optimum the dye concentration of 10–4 mole/l, the maximum intensity peak occurs at 567 nm for all the plots.
0 5 10 15 20 25 30 35 40 45
480 500 520 540 560 580 600 620 640 660 680
Wavelength (nm)
F
luo
r
e
sc
e
nc
e
I
nt
e
ns
it
y
(
a
r
b.
uint
)
Dye R590 10^-3 with PMMA Dye R590 5*10^-3 with PMMA Dye R590 5*10^-5 with PMMA Dye R590 10^-5 with PMMA Dye R590 5*10^-6 with PMMA Dye R590 10^-6 with PMMA Dye R590 5*10^-4 with PMMA Dye R590 10^-4 with PMMA Dye R590 10–3
with PMMA Dye R590 5*10–3
with PMMA Dye R590 5*10–5
with PMMA Dye R590 5*10–6
with PMMA Dye R590 10–5 with PMMA
Dye R590 5*10–4
with PMMA Dye R590 10–6 with PMMA
Dye R590 10–4
[image:5.595.161.439.470.706.2]with PMMA
Figure 7. The fluorescence spectra of film sample at different concentrations
0 5 10 15 20 25 30 35 40 45
480 500 520 540 560 580 600 620 640 660 680
Wavele ngth (nm)
F lu o res cen c e I n te n si ty ( a rb . u in t)
Dye R590 10^-4 with 8.56*10^15 cm-3 TiO 2 hoste d by PMMA
Dye R590 10^-4 with 8.56*10^16 cm-3 TiO 2 hoste d by PMMA
Dye R590 10^-4 with 8.56*10^17 cm-3 TiO 2 hoste d by PMMA
Dye R590 10^-4 with 8.56*10^18 cm-3 TiO 2 hoste d by PMMA
Dye R590 10–4
with 8.56*1015
cm–3
TiO2 hosyed by PMMA
Dye R590 10–4 with 8.56*1016 cm–3
TiO2 hosyed by PMMA
Dye R590 10–4
with 8.56*1017
cm–3
TiO2 hosyed by PMMA
Dye R590 10–4
with 8.56*1018
cm–3
[image:6.595.163.435.83.323.2]TiO2 hosyed by PMMA
Figure 8. The fluorescence spectra of film samples at 10–4 mole/liter of
R590 dye and different concentrations of TiO2 nanoparticles hosted by PMMA.
545 555 565 575 585
Wavelength (nm) Em iss ion Int ensit y ( a rb. ui nt
) 35 mJ
30 mJ 25 mJ 15 mJ 5 mJ 10 mJ 40 mJ 20 mJ
Figure 9. Comparison of emission spe-
ctra of the selected film sample doped PMMA at different of pumpingenergies and 1 Hz repetition rate.
0 5 10 15 20 25 30 35
0 5 10 15 20 25 30 35 40 45
Pump Energy (mJ)
Inte nsit y (a rbt. uint ) 0 4 8 12 16 20 FW H M (n m )
E
th FWHM [image:6.595.102.232.371.686.2]E
thintensityFigure 10. Random laser threshold determination from maxi-
mum intensity and FWHM relationship versus the pumping energy for a film sample: 10–4 mole/liter of R590 and 8.56 × 1015 cm–3 of TiO
2 nanoparticles.
The evaluation of the film threshold energy (Eth = 10 mJ) at which the gain exceeds the loss, the dependence of the emission intensity and the FWHM on the excita- tion energy are shown in Figure 10, which confirms what has already been mentioned above. Hong et al. and reported a similar result.
4. CONCLUSION
[image:6.595.310.534.375.544.2]concentrations of both R590 dye and TiO2 nanoparticles scatter centers were achieved giving an indication about the optimum required concentrations. The results of RL measurements show that the minimum bandwidth at FWHM is ~11 nm at 40 mJ for the film sample at 10–4 R590 mol/l and TiO2. Was observed for homogenously prepared spray-coated film sample these results are not far away from the ones reported elsewhere [4,6,12,17].
REFERENCES
[1] Letokhov, V.S. (1967) Stimulated emission of an ensem-ble of scattering particles with negative absorption. JETP Letters, 5, 212-215.
[2] Markushev, V.M., Zolin, V.F. and Briskina, C.M. (1986) Luminescence and stimulated emission of neodymium in sodium lanthanum molybdate powders. Soviet Journal of Quantum Electronics, 16, 281-283.
doi:10.1070/QE1986v016n02ABEH005792
[3] Anglos, D., Stassinopoulos, A., Das, R.N., Acharakis, G., Psyllaki, M., Jakubiak, R., Vaia, R.A., Giannelis, E.P. and Anastasiadis, S.H. (2004) Random laser action in organic- inorganic nanocomposites. Journal of the Optical Society of American B, 21,208-213.
doi:10.1364/JOSAB.21.000208
[4] Brito-Silva, A.M., André, G., Anderson, S.L., Alcenisio, J.J. and Cid, B.A. (2010) Random laser action in dye so-lutions containing Stöber silica nanoparticles. Applied Physics, 108, Article ID 033508.
[5] Zacharakis, G., Papadogiannis, N.A. and Papazoglou T.G. (2002) Random lasing following two-photon excitation of highly scattering gain media. Applied Physics Letters, 81, 2511-2513. doi:10.1063/1.1511284
[6] Polson, R.C., Chipoline, A. and Vardeny, Z.V. (2001) Random lasing in π-conjugated films and infiltrated opals. Advanced Materials, 13, 760-764.
doi:10.1002/1521-4095(200105)13:10<760::AID-ADMA 760>3.0.CO;2-Z
[7] Cao, H., Ling, Y., Xu, J.Y., Cao, C.Q. and Kumar, P. (2001) Photon statistics of random lasers with resonant feedback. Physical Review Letters, 86,4524-4527.
doi:10.1103/PhysRevLett.86.4524
[8] Shkunov, M.N., DeLong, M.C., Raikh, M.E., Vardeny, Z.V., Zakhidov, A.A. and Baughman R.H. (2001) Pho- tonic versus random lasing in opal single crystals. Syn-thetic Metals, 116, 485-491.
doi:10.1016/S0379-6779(00)00420-3
[9] Wiersma, D. and Cavalier, S. (2001) Light emission: A temperature-tunable random laser. Nature, 414, 708-709.
doi:10.1038/414708a
[10] Noginov, M.A. (2005)Solid-State Random Lasers. Springer, New York.
[11] Wiersma, D.S. (2008) The physics and applications of random lasers. Nature Physics, 4,359-367.
doi:10.1038/nphys971
[12] Ling, Y., Cao, H., Burin, A.L., Ratner, M.A., Liu, X. and Chang, R.P.H. (2001) Investigation of random lasers with resonant feedback. Physics Review A, 64, Article ID 063808. doi:10.1103/PhysRevA.64.063808
[13] Lawandy, N.M., Salachandran, R.M., Gomes, A.S.L. and Sauvain, E. (1994) Laser action in strongly scattering media. Nature, 368, 436-437.
[14] Beckering, G., Zilker, S.J. and Haarer, D. (1997) Spectral measurements of the emission from highly scattering gain media. Optics Letters, 22, 1427-1429.
[15] Cao, H. (2003) Lasing in random media. Waves in Ran-dom Media, 13, R1-R39.
[16] Aegerter, C.M., Storzer, M., Fiebig, S., Buhrer, W. and Maret, G. (2007) Observation of Anderson localization of light in three dimensions. Journal of the Optical Society of American A, 24, A23-A27.
doi:10.1364/JOSAA.24.000A23