Personality Driven Differences in Paraphrase Preference
Daniel Preot¸iuc-Pietro
Positive Psychology Center University of Pennsylvania [email protected]
Jordan Carpenter
Kenan Institute for Ethics Duke University [email protected]
Lyle Ungar
Computer and Information Science University of Pennsylvania [email protected]
Abstract
Personality plays a decisive role in how people behave in different scenarios, in-cluding online social media. Researchers have used such data to study how person-ality can be predicted from language use. In this paper, we study phrase choice as a particular stylistic linguistic difference, as opposed to the mostly topical differences identified previously. Building on previ-ous work on demographic preferences, we quantify differences in paraphrase choice from a massive Facebook data set with posts from over 115,000 users. We quan-tify the predictive power of phrase choice in user profiling and use phrase choice to study psycholinguistic hypotheses. This work is relevant to future applications that aim to personalize text generation to spe-cific personality types.
1 Introduction
The task of user trait prediction from text has in-creased in popularity and importance with the avail-ability of user generated content which encodes various information about the author of the text. Using machine learning techniques and large data sets, past research managed to predict with varying degrees of accuracy a series of both demographic traits such as age (Rao et al.,2010;Sap et al.,2014), gender (Burger et al.,2011;Rangel et al., 2015;
Flekova et al.,2016a), location (Eisenstein et al.,
2010), political affiliation (Volkova et al., 2014;
Preot¸iuc-Pietro et al.,2017), popularity (Lampos et al., 2014), occupation (Preot¸iuc-Pietro et al.,
2015b;Liu et al.,2016), income (Preot¸iuc-Pietro et al.,2015c;Flekova et al.,2016b) and psychologi-cal traits such as personality dimensions (Schwartz et al.,2013;Preot¸iuc-Pietro et al.,2016a) or mental
states (De Choudhury et al.,2013;Coppersmith et al.,2014;Preot¸iuc-Pietro et al.,2015a).
For psychological traits of users, a key set of traits is represented by personality, with the Five Factor Model or the ‘Big Five’ being the most widely used model for representing personality. This posits the existence of five traits in which people vary: openness to experience, conscien-tiousness, extraversion, agreeableness and neuroti-cism (McCrae and John,1992). Methods for user trait prediction can uncover sociological insight into user behaviour or implicit biases and also im-prove a range of applications in recommender sys-tems, targeted marketing or in natural language processing where they can lead to improvements in tasks such as text classification (Hovy,2015) or sen-timent analysis (Volkova et al.,2013). While these methods achieve good predictive performance, they pose significant challenges to the anonymization of identity online.
Most differences in language use across traits are topical. For example, users high in extraver-sion post more about social activities (‘party’, ‘cant wait’, ‘weekend’), while introverts prefer to post more about computer related activities (‘Internet’, ‘computer’, ‘anime’). Users high in neuroticism post about their negative feelings (‘depressed’, ‘sick of’, ‘lonely’), while users low in neuroticism post more about religion (‘blessings’, ‘praise’) or sports (‘basketball’, ‘soccer’, ‘success’) (Park et al.,
2015).
However, stylistic rather than topical differ-ences are needed in some applications. For exam-ple, (Mirkin et al.,2015) propose that the output text of machine translation systems should repro-duce the traits of the author of the source text. In this case, topical information is fixed, and the trait information can be transmitted only using stylis-tic cues. Following the work of (Preot¸iuc-Pietro et al.,2016b) who studied demographic traits, we
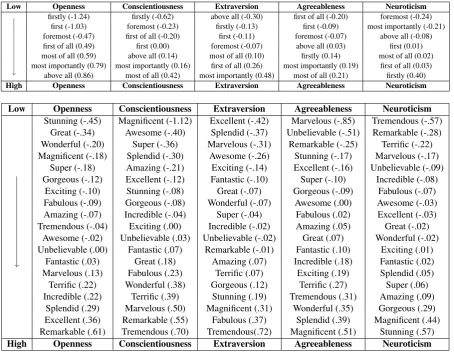
study in this paper user personality differences in paraphrase choice – a specific type of stylistic dif-ference. Paraphrases represent alternative ways to convey the same information (Barzilay,2003), us-ing either sus-ingle words or short phrases. Table1
presents a couple of motivating examples of two group of words and phrases which are all para-phrases of each other ordered by the frequency of use for each personality trait.
In this study, we measure for the first time the dif-ferences in paraphrase usage between personality types from a large social media data set in an at-tempt to obtain language differences isolated from topical influence. Our analysis measures similari-ties between personality traits, the predictive power of stylistic words and a number of psycholinguistic theories about word choice. The paraphrase scores for each of the five personality traits are available online.1
2 Data
Our complete data set consists of approximately 15 million Facebook status updates posted by 115,312 users, representing the full MyPersonality data set (Kosinski et al.,2013). Participants volunteered to share their status updates as part of the MyPer-sonality application, providing informed consent for data collection. In the MyPersonality applica-tion they took a variety of quesapplica-tionnaires, including the International Personality Item Pool proxy for the NEO Personality Inventory Revised (NEO-PI-R) (McCrae and John,1992;Costa and McCrae,
2008), based on which the five personality trait scores are computed for each user (ranging from 1 to 5).
We split our users into binary groups for each personality trait. In order to have non-overlapping groups, we selected the top 20% users as being high in one trait and the bottom 20% as low in that trait. Data set statistics are presented in Table 2. Our methodology requires a split of users into dichoto-mous groups in order to compute paraphrase pref-erence. We acknowledge that this split represents a simplification of personality traits and of the sub-sequent personality prediction task, although this was also used in some previous research (Mairesse et al.,2007;Celli et al.,2014) and, due to the or-dinal nature of the personality scores, is highly unlikely to qualitatively affect our results.
1http://www.preotiuc.ro
Personality Trait Low High
[image:2.595.311.525.62.120.2]Openness ≤3.25(25,211 users) ≥4.5(24,700 users) Conscientiousness ≤2.75(23,221 users) ≥4.049(23,639 users) Extroversion ≤2.75(23,802 users) ≥4.25(26,310 users) Agreeableness ≤3(27,723 users) ≥4.25(23,750 users) Neuroticism ≤2(25,798 users) ≥3.5(23,339 users)
Table 2: Personality score thresholds and number of users in each personality trait group for the anal-ysis.
3 Quantifying Personality Differences
We use the Paraphrase Database (PPDB) ( Ganitke-vitch et al., 2013) as our source of paraphrases, owing to its very large size and quality. PPDB 2.0 (Pavlick et al.,2015b) contains 23.820.422 para-phrases derived from a large collection of bilingual texts by pivoting methods. The phrases part of para-phrases are up to three tokens in length (1–3 grams). In PPDB 2.0, each paraphrase pair comes with pre-dicted scores for the relation type between the two phrases (‘Equivalence’, ‘Entailment’, ‘Exclusion’, ‘Other relation’, ‘Unrelated’) obtained using a su-pervised regression model using lexical, distribu-tional and other features (Pavlick et al., 2015a). While there is no inarguable definition of the para-phrase term (Androutsopoulos and Malakasiotis,
2010;Bhagat and Hovy,2013), in this work we are most interested in the most restrictive type of rela-tionship (‘Equivalence’) as described in (Pavlick et al.,2015a). We thus use paraphrase pairs that have an equivalence score of at least0.2(chosen based upon the inspection of the pairs), leaving us with6.157.570paraphrase pairs.
Given a paraphrase pair, we use phrase occur-rence statistics computed over our data set to mea-sure the phrase choice difference over user at-tributes. For the rest of this paragraph, we exem-plify with the trait of extraversion, but the compu-tation is analogous for the other four traits.
To score how much a user group favors a phrasew, we compute the scores Extravert(w)and Introvert(w). These are computed by counting the number of times phrasewwas used by a user di-vided by the total number of words of that used, then averaging across all users high or low extraver-sion respectively. For each phrase we then compute a score:
Extraversion(w) = log
Extravert(w)
Introvert(w)
(1)
Within a paraphrase pair(w1, w2), the difference
Low Openness Conscientiousness Extraversion Agreeableness Neuroticism
y
firstly (-1.24) firstly (-0.62) above all (-0.30) first of all (-0.20) foremost (-0.24) first (-1.03) foremost (-0.23) firstly (-0.13) first (-0.09) most importantly (-0.21) foremost (-0.47) first of all (-0.20) first (-0.11) foremost (-0.07) above all (-0.08) first of all (0.49) first (0.00) foremost (-0.07) above all (0.03) first (0.01) most of all (0.59) above all (0.14) most of all (0.10) firstly (0.14) most of all (0.02) most importantly (0.79) most importantly (0.16) first of all (0.26) most importantly (0.19) first of all (0.03) above all (0.86) most of all (0.42) most importantly (0.48) most of all (0.21) firstly (0.40)
High Openness Conscientiousness Extraversion Agreeableness Neuroticism
Low Openness Conscientiousness Extraversion Agreeableness Neuroticism
Stunning (-.45) Magnificent (-1.12) Excellent (-.42) Marvelous (-.85) Tremendous (-.57) Great (-.34) Awesome (-.40) Splendid (-.37) Unbelievable (-.51) Remarkable (-.28) Wonderful (-.20) Super (-.36) Marvelous (-.31) Remarkable (-.25) Terrific (-.22) Magnificent (-.18) Splendid (-.30) Awesome (-.26) Stunning (-.17) Marvelous (-.17)
y
Super (-.18) Amazing (-.21) Exciting (-.14) Excellent (-.16) Unbelievable (-.09) Gorgeous (-.12) Excellent (-.12) Fantastic (-.10) Super (-.10) Incredible (-.08)
Exciting (-.10) Stunning (-.08) Great (-.07) Gorgeous (-.09) Fabulous (-.07) Fabulous (-.09) Gorgeous (-.08) Wonderful (-.07) Awesome (.00) Awesome (-.03) Amazing (-.07) Incredible (-.04) Super (-.04) Fabulous (.02) Excellent (-.03) Tremendous (-.04) Exciting (.00) Incredible (-.02) Amazing (.05) Great (-.02)
Awesome (-.02) Unbelievable (.03) Unbelievable (-.02) Great (.07) Wonderful (-.02) Unbelievable (.00) Fantastic (.07) Remarkable (-.01) Fantastic (.10) Exciting (.01)
Fantastic (.03) Great (.18) Amazing (.07) Incredible (.18) Fantastic (.02) Marvelous (.13) Fabulous (.23) Terrific (.07) Exciting (.19) Splendid (.05) Terrific (.22) Wonderful (.38) Gorgeous (.12) Terrific (.27) Super (.06) Incredible (.22) Terrific (.39) Stunning (.19) Tremendous (.31) Amazing (.09)
Splendid (.29) Marvelous (.50) Magnificent (.31) Wonderful (.35) Gorgeous (.29) Excellent (.36) Remarkable (.55) Fabulous (.37) Splendid (.39) Magnificent (.44) Remarkable (.61) Tremendous (.70) Tremendous(.72) Magnificent (.51) Stunning (.57)
[image:3.595.73.528.61.413.2]High Openness Conscientiousness Extraversion Agreeableness Neuroticism
Table 1: Two example groups of phrases that are all paraphrases of each other. Words and phrases are ordered by frequency of use. The top words are more frequently used by users low in each personality trait, with words further down the list being more specific of users high in the respective personality trait. The number in brackets represents the score with which the word is related to each trait (described in Section3).
stylistic distance between users high in extraversion compared to users low in extraversion. This method of computing stylistic distance is similar to the work ofPavlick and Nenkova(2015) who studied paraphrasing in the context of formality and com-plexity and to that ofPreot¸iuc-Pietro et al.(2016b) who looked at differences between gender, age and occupational class groups.
In a few experiments, we also use paraphrase clusters which are created by using the transitive closure of pairwise paraphrases, as the supervised model for scoring equivalence combined with our threshold leads to transitivity not holding in our list of pairs. Within these clusters, we subtract the mean phrase score to adjusts for topic prevalence and to lead to a score of 0 representing a point of alignment across all clusters. In total, we derive 785.226 paraphrase clusters (mean = 7.43 words,
median = 4 words, st.dev = 11.06 words). Out of these, on average 171.788 clusters (mean = 5.20 words) across the five personality traits contain at least two words scored for phrase choice, as we remove words with low frequency in our data (a relative frequency of under10−5in our data set).
4 Predicting Personality
dot product between this distribution and the user phrase frequency vector. We chose this algorithm over others to directly tests the viability of our met-ric. The prior class distribution is estimated based on the training data and we use Laplace smoothing.
To measure the influence of paraphrase choice, we compare the performance of the model using only phrases appearing in at least one paraphrase pair (a proxy for stylistic choice, 62.919 phrases), the rest of the phrases separately (a proxy for topi-cal information, 54.197 phrses) as well as the com-bined set of phrases. The vocabulary consists of 117.117 phrases (1–3 grams) which have a relative frequency of over10−5 in our data set. Results on
predicting personality for unseen users measured in accuracy are shown in Table3.
Ope Con Ext Agr Neu
Random Baseline .500 .500 .500 .500 .500
Only Paraphrases .603 .551 .519 .551 .549
Phrases w/o Paraphrases .573 .589 .578 .553 .590
[image:4.595.75.289.292.347.2]All Phrases .623 .639 .597 .593 .631
Table 3: User attribute prediction results evaluated in accuracy. Using only paraphrases that capture more stylistic rather than topical differences be-tween different personality trait groups, our method still shows good predictive power comparing to us-ing all phrase (1–3 grams) features.
We notice that overall personality can be pre-dicted with significant margins even when using a simple Naive Bayes approach without any fea-ture selection. Both phrases part of paraphrase pairs and not part of paraphrase pairs significantly improve on the random baseline with one excep-tion (Extraversion and paraphrases). However, the numbers are lower than in the case of user de-mographics (Preot¸iuc-Pietro et al.,2016b), which is to be expected when predicting psychological traits (Schwartz et al.,2013;Rangel et al.,2015).
We highlight that in the case of openness to expe-rience, the phrases that are part of paraphrase pairs obtain better prediction performance in accuracy than the other set of phrases. The latter perform better when predicting conscientiousness, extraver-sion and neuroticism and comparable in case of agreeableness. Combining all phrases consistently obtains the best results.
5 Trait Differences
A very revealing aspect of paraphrase choice for each trait is the order of preference within a
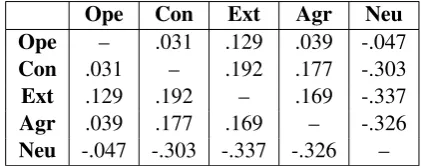
para-phrase cluster, as exemplified in Table1. To quan-tify this preference across all clusters, we compute the cluster rank similarity between all pairs of user traits. The average Kendallτ rank correlation coef-ficient across all clusters is presented in Table4. As certain personality trait scores are correlated and some users might be part of multiple groups, we also show the correlations between the trait scores in Table5. As the number of users is very large (>100.000), all correlations in Tables4and5are significant.
The results on paraphrase choice show a few distinctive patterns. In both paraphrase choice and actual personality scores, neuroticism is anti-correlated with all other four traits, albeit more strongly in case of personality scores. Openness to experience is weakly negatively correlated with all four traits in paraphrase choice, while it is overall weakly positively correlated with the other traits in personality scores. Paraphrase choice is positively correlated across the other three traits (conscien-tiousness, extraversion, agreeableness), similarly to actual personality scores and with comparable correlations numbers.
Overall, this analysis demonstrates that over-all, stylistic paraphrase choice largely reflects user level differences with some variation in case of openness to experience.
Ope Con Ext Agr Neu
[image:4.595.308.522.456.541.2]Ope – -.071 -.018 -.040 -.028 Con -.071 – .134 .174 -.211 Ext -.028 .134 – .107 -.180 Agr -.040 .174 .107 – -.174 Neu -.028 -.211 -.180 -.174 –
Table 4: Average Kendall τ rank correlation be-tween paraphrase cluster usage compared across different user traits. Spearman rank correlation and Pearson correlation reveal similar patterns.
Ope Con Ext Agr Neu
Ope – .031 .129 .039 -.047 Con .031 – .192 .177 -.303 Ext .129 .192 – .169 -.337 Agr .039 .177 .169 – -.326 Neu -.047 -.303 -.337 -.326 –
[image:4.595.310.521.630.713.2]6 Linguistic Hypotheses
We investigate a number of psycholinguistic hy-potheses about language choice and style by us-ing our paraphrase based method. We argue that word choice within a paraphrase pair excludes the topical influence that confounds studies using all words (Sarawgi et al.,2011)
6.1 Word Properties
Using unigram paraphrases, we study if any user group is more likely to use a word based on the following properties:
Word Length We compute the difference in
word length in a paraphrase pair as a simple proxy for word complexity.
Number of Syllables We compute the difference in the number of syllables in a paraphrase pair as another simple proxy for word complexity. Word Rareness To measure word frequency, we use a reference corpus retrieved from the 10% sam-ple of the Twitter stream between 2 January – 28 February 2011 (∼400million tweets), filtered for English using the Trendminer pipeline ( Preot¸iuc-Pietro et al.,2012). We measure which word from a pair is more frequently used overall by computing a ratio between the frequencies of the two words within a pair.
Perceived Happiness We use the
Hedonome-ter (Dodds et al.,2011,2015) to obtain happiness ratings for single words. The Hedonometer con-sists of crowdsourced happiness ratings for 10,221 of the most frequent English words. The ratings range between8.5and1.3(µ= 5.37,σ = 1.08). Note these do not only infer the emotional polar-ity of words (e.g., ‘happiness’ is more positive than ‘terror’), but also how words are perceived by the reader individually without text context (e.g., ‘mommy’ is perceived happier than ‘mom’). We compare the user group preference with the differ-ence in happiness ratings.
Affective Norms To compliment the happiness ratings, we use information about the affective norms of words. In the dimensional model of emo-tions, any particular emotion can be defined as a set of values on a number of different dimensions. One of the most popular models consists of three dimensions (Mehrabian and Russell, 1974): Va-lence– pleasant vs. unpleasant;Arousal– excited vs. calm;Dominance– controlled vs. in-control.
We use a list of∼14,000 words rated in all three af-fective norms introduced in (Warriner et al.,2013). For words rated in both perceived happiness and valence, the correlation is very high (r=.918). Concreteness Concreteness evaluates the degree to which the concept denoted by a word refers to a perceptible entity (Brysbaert et al., 2014). Al-though the paraphrase pairs refer to the same entity, some words are perceived as more concrete (or con-versely more abstract) than others. The dual-coding theory posits that humans process and represent verbal and non-verbal information in separate, re-lated systems. According to this, both concrete and abstract words are represented in the verbal sys-tem, but only concrete words are represented in the non-verbal system. Thus, concrete words are more easily learned, remembered and processed than abstract words (Paivio,2013). We use a list of 37,058 English words with ratings of concrete-ness on a scale from 5 (e.g., ‘tiger’ – 5) to 1 (e.g., ‘spirituality’ – 1.07) introduced in (Brysbaert et al.,
2014).
Imageability The construct of imageability rep-resents how easily a particular word elicits a men-tal picture of the word’s referent (Toglia and Bat-tig, 1978). Imagery is thought to be an impor-tant aspect of the non-verbal system in the dual-coding theory and is correlated with concreteness (r = .78) (Gilhooly and Logie, 1980). We use 6,000 ratings on the ease or difficulty with which words arouse mental images for mono- and disyl-labic words (Cortese and Fugett, 2004; Schock et al., 2012), ranging from e.g., 1.2 – ‘an’ to 7 – ‘blizzard’.
Feature Ope Con Ext Agr Neu Word length .182∗∗ .097∗∗ .080∗∗ .010 −.065∗∗
#Syllables .067∗∗ .045∗∗ .047∗∗ .016∗ −.020∗
Word rareness −.022∗∗ .005 .013∗ .007 −.004
Happiness −.027∗ .039∗∗ .034∗ .040∗∗ .004
Valence −.041∗∗ .050∗∗ .050∗∗ .054∗∗ .006
Arousal −.012 −.001 .028∗ .005 −.024∗
Dominance −.043∗∗ .036∗∗ .031∗ .030∗ .000
Concreteness −.068∗∗ −.014 .010 −.007 .023∗
Imageability −.061∗ −.010 .026 .027 .016
Sensory Experience −.010 −.018 .023 .001 .064∗∗
[image:6.595.134.467.61.228.2]Age-of-Acquisition .163∗∗ −.002 −.060∗∗ −.032∗ −.014
Table 6: Correlation coefficients between word property differences and word preference by users high in each personality trait across all paraphrase pairs –p < 0.05, two tailed t-test, significant after false discovery rate multi-comparison corrections: Benjamini-Hochberg (∗), Bonferroni (∗∗).
‘relief’; 6 – ‘music’).
Age-of-Acquisition Age-of-Acquisition is a psy-cholinguistic variable referring to the age at which a word is typically learned (Kuperman et al.,2012). Words with higher age-of-acquisition are anti-correlated to sensory experience (r=−.586), im-ageability (r = −.440) (Juhasz and Yap, 2013) and correlated with length in letters (r = .549), syllables (r =.528) and, to a lesser extent, to ab-stractness (r=.166) (Kuperman et al.,2012). We use the age-of-acquisition ratings for 30,000 words rated with the year in which the words are acquired (e.g., ‘momma’ – 1.58; ‘foot’ – 3.44; ‘bipartisan’ – 16.2) introduced in (Kuperman et al.,2012). 6.2 Paraphrase Entropy
Additionally, we are interesting in identifying which personality groups prefer using a more di-verse set of alternative phrases, rather than us-ing a few idiosyncratic phrases. Usus-ing all para-phrase clusters (1–3 grams), we compute the aver-age entropy over paraphrase cluster distributions. A higher entropy means the distribution is less peaked towards a specific word, thus showing higher vari-ety in choice.
6.3 Results
We establish if a group of users prefers words within paraphrase pairs with one of the character-istics presented in the previous section using the following method. For each trait and paraphrase pair, we compute the stylistic difference between the words within a pair (see Section3). Then, for each trait, we run a Pearson correlation between
the vector of stylistic difference scores for each pair and the vector containing the differences in word characteristics (e.g. the difference between the number of syllables of the two words). For each word property, we only retain the paraphrase pairs where we can measure both words, which leads to different numbers of pairs (and hence dif-ference significance thresholds) for each test. The Pearson correlation results are shown in Table6. We observe there are several statistically signifi-cant differences in paraphrase choice between the user groups. Paraphrase entropy by personality trait groups are presented in Table7.
Personality Trait Low High
Openness(∗∗) .838 .924
Conscientiousness .893 .894 Extroversion(∗∗) .901 .891
Agreeableness(∗) .899 .894
Neuroticism(∗∗) .900 .892
Table 7: Average paraphrase cluster entropies for each personality trait. The higher the entropy, the more diverse is the paraphrase choice of the specific group of users. Mean differences are tested for significance using the Mann-Whitney Test: p ≤ .05(∗),p≤.001(∗∗).
[image:6.595.337.499.482.569.2]openness to experience was negatively related to concreteness, dominance, valence and happiness. This indicates that users who are high in openness are more likely to express themselves in indirect and abstract ways, and they are less likely to pre-fer explicitly happier words. Again, these are con-sistent with a more cerebral or artistic mode of communication. Word rareness is anti-correlated with high in openness. However, we noticed that word rareness captures in a large extent also mis-spellings and alternative mis-spellings. In terms of en-tropy however, openness to experience generates by far the largest difference in group means for entropy. Those interested in novelty and new expe-riences may especially dislike phrasing the same concept in the same way over time when other op-tions are available, prefer idiosyncratic words and may have larger vocabularies.
Conscientiousness, extraversion and agreeable-ness have similar correlations across all phrase choice traits. Users high in these three traits pre-fer words that are longer and have more syllables. However, for extraversion and agreeableness, age-of-acquisition results show that these groups tend not to choose words acquired later and entropy re-sults show a more limited breadth in usage, both indicative of less complex word choice. Especially, introverts score higher in these choices, perhaps because introverts prefer solitary activities such as reading and may therefore have larger and more sophisticated vocabularies (Furnham,1981).
All three traits prefer happier and more dominant words, which, at least for extraversion, is unsurpris-ing as these qualities are part of the definition of the trait (Watson and Clark,1997). Users high in agree-ableness are also known to express higher positive valence and conscientious users tend to be more dominant.
Despite the opposite patterns in language use associated with these three traits and openness, these are positively correlated in the user popula-tion. Therefore, the two sets of correlations are not simply the same effect explained in two different ways.
Neuroticism exhibits the fewest correlations with phrase choice. Users high in this trait prefer words that are shorter, have fewer syllables and have a slightly lower entropy, which indicates a mild ten-dency for simpler, idionsyncratic words. Finally, users high the neuroticism prefer words that are higher in sensory experience, and to a lesser
de-gree, that are more concrete. This underlines the preference of this group of users to use social media as a means of communicating about the immediate context.
7 Conclusions
We have studied phrase choice, a particular type of stylistic language difference, across the Big Five personality traits for the first time. We used a large data-driven paraphrase dictionary as our source of paraphrases in combination with statistics com-puted over large volumes of Facebook status up-dates. We have shown paraphrase words are, with one exception, predictive of the personality traits and that differences exist in phrase choices. Our analysis of several psycholinguistic word character-istics showed that personality correlates with many systematic word choices and these are intuitive and correspond to theories of personality.
Differences in paraphrase choice are likely to be useful in text-to-text generation and dialogues sys-tems. Tailoring automatically generated text based on personality traits might be desirable in multiple scenarios, such as for tutoring or customer sup-port. However, in most of these cases, the topic is fixed and personalization can be achieved only at a stylistic level. To this end, we make our scored paraphrase choices across personality traits pub-licly available.
Acknowledgments
The authors acknowledge the support of the Tem-pleton Religion Trust, grant TRT-0048.
References
Ion Androutsopoulos and Prodromos Malakasiotis. 2010. A Survey of Paraphrasing and Textual En-tailment Methods. Journal of Artificial Intelligence Research38:135–187.
Regina Barzilay. 2003. Information Fusion for Multi-document Summarization: Paraphrasing and Gener-ation. Ph.D. thesis, Columbia University.
Rahul Bhagat and Eduard Hovy. 2013. What is a para-phrase?Computational Linguistics39(3):463–472. Marc Brysbaert, Amy Beth Warriner, and Victor
Kuper-man. 2014. Concreteness Ratings for 40 Thousand Generally known English Word Lemmas. Behavior Research Methods46(3):904–911.
Twitter. InProceedings of the 2011 Conference on Empirical Methods in Natural Language Processing. EMNLP, pages 1301–1309.
Fabio Celli, Elia Bruni, and Bruno Lepri. 2014. Auto-matic Personality and Interaction Style Recognition from Facebook Profile Pictures. In Proceedings of the 22nd ACM International Conference on Multi-media. MM, pages 1101–1104.
Glen Coppersmith, Mark Dredze, and Craig Harman. 2014. Quantifying Mental Health Signals in Twitter. InWorkshop on Computational Linguistics and Clin-ical Psychology: From Linguistic Signal to ClinClin-ical Reality (CLPsych). ACL, pages 51–60.
Michael J Cortese and April Fugett. 2004. Imageabil-ity Ratings for 3,000 Monosyllabic Words. Behav-ior Research Methods, Instruments, & Computers 36(3):384–387.
Paul T Costa and Robert R McCrae. 2008. The Re-vised NEO Personality Inventory (NEO-PI-R). The SAGE Handbook of Personality Theory and Assess-ment2:179–198.
Munmun De Choudhury, Michael Gamon, Scott Counts, and Eric Horvitz. 2013. Predicting Depres-sion via Social Media. InProceedings of the Seventh International AAAI Conference on Weblogs and So-cial Media. ICWSM, pages 128–137.
Peter Sheridan Dodds, Eric M. Clark, Suma Desu, Morgan R. Frank, Andrew J. Reagan, Jake Ryland Williams, Lewis Mitchell, Kameron Decker Har-ris, Isabel M. Kloumann, James P. Bagrow, Karine Megerdoomian, Matthew T. McMahon, Brian F. Tiv-nan, and Christopher M. Danforth. 2015. Human Language Reveals a Universal Positivity Bias. Pro-ceedings of the National Academy of Sciences of the United States of America (PNAS)112(8):2389– 2394.
Peter Sheridan Dodds, Kameron Decker Harris, Is-abel M Kloumann, Catherine A Bliss, and Christo-pher M Danforth. 2011. Temporal Patterns of Happiness and Information in a Global Social Net-work: Hedonometrics and Twitter. PloS ONE 6(12):e26752.
Jacob Eisenstein, Brendan O’Connor, Noah A. Smith, and Eric P. Xing. 2010. A latent variable model for geographic lexical variation. InProceedings of the Conference on Empirical Methods in Natural Lan-guage Processing. EMNLP, pages 1277–1287. Lucie Flekova, Jordan Carpenter, Salvatore Giorgi,
Lyle Ungar, and Daniel Preot¸iuc-Pietro. 2016a. Ana-lyzing Biases in Human Perception of User Age and Gender from Text. InProceedings of the 54th An-nual Meeting of the Association for Computational Linguistics. ACL, pages 843–854.
Lucie Flekova, Lyle Ungar, and Daniel Preoctiuc-Pietro. 2016b. Exploring Stylistic Variation with Age and Income on Twitter. InProceedings of the
54th Annual Meeting of the Association for Compu-tational Linguistics. ACL, pages 313–319.
Adrian Furnham. 1981. Personality and Activity Preference. British Journal of Social Psychology 20(1):57–68.
Juri Ganitkevitch, Benjamin Van Durme, and Chris Callison-Burch. 2013. PPDB: The Paraphrase Database. InProceedings of the 2013 Annual Con-ference of the North American Chapter of the Associ-ation for ComputAssoci-ational Linguistics. NAACL, pages 758–764.
Ken J Gilhooly and Robert H Logie. 1980. Age-of-acquisition, Imagery, Concreteness, Familiarity, and Ambiguity Measures for 1,944 Words.Behavior Re-search Methods & Instrumentation12(4):395–427. Dirk Hovy. 2015. Demographic Factors Improve
Clas-sification Performance. InProceedings of the 53rd Annual Meeting of the Association for Computa-tional Linguistics. ACL, pages 752–762.
Barbara J Juhasz and Melvin J Yap. 2013. Sen-sory Experience Ratings for over 5,000 mono-and Disyllabic Words. Behavior Research Methods 45(1):160–168.
Barbara J Juhasz, Melvin J Yap, Joanna Dicke, Sarah C Taylor, and Margaret M Gullick. 2011. Tangi-ble Words are Recognized Faster: The Grounding of Meaning in Sensory and Perceptual Systems. The Quarterly Journal of Experimental Psychology 64(9):1683–1691.
Michal Kosinski, David Stillwell, and Thore Graepel. 2013. Private Traits and Attributes are Predictable from Digital Records of Human Behavior. Pro-ceedings of the National Academy of Sciences of the United States of America (PNAS)110(15):5802– 5805.
Victor Kuperman, Hans Stadthagen-Gonzalez, and Marc Brysbaert. 2012. Age-of-acquisition Ratings for 30,000 English Words. Behavior Research Meth-ods44(4):978–990.
Vasileios Lampos, Nikolaos Aletras, Daniel Preot¸iuc-Pietro, and Trevor Cohn. 2014. Predicting and Char-acterising User Impact on Twitter. InProceedings of the 14th Conference of the European Chapter of the Association for Computational Linguistics. EACL, pages 405–413.
Ye Liu, Luming Zhang, Liqiang Nie, Yan Yan, and David S Rosenblum. 2016. Fortune Teller: Predict-ing your Career Path. In Proceedings of the AAAI Conference on Artificial Intelligence. AAAI, pages 201–207.
Robert R McCrae and Paul T Costa Jr. 1997. Con-ceptions and Correlates of Openness to Experience. Handbook of Personality Psychology pages 825– 847.
Robert R McCrae and Oliver P John. 1992. An In-troduction to the Five-Factor Model and its Appli-cations. Journal of Personality60(2):175–215.
Albert Mehrabian and James A Russell. 1974. An Ap-proach to Environmental Psychology. MIT Press.
Shachar Mirkin, Scott Nowson, Caroline Brun, and Julien Perez. 2015. Motivating Personality-aware Machine Translation. In Proceedings of the 2015 Conference on Empirical Methods in Natural Lan-guage Processing. EMNLP, pages 1102–1108.
Allan Paivio. 2013. Imagery and Verbal Processes. Psychology Press.
Gregory Park, H.Andrew Schwartz, Johannes Eich-staedt, Margaret Kern, Michal Kosinski, David Still-well, Lyle Ungar, and Martin Seligman. 2015. Auto-matic Personality Assessment through Social Media Language.JPSP108:934–952.
Ellie Pavlick, Johan Bos, Malvina Nissim, Charley Beller, Benjamin Van Durme, and Chris Callison-Burch. 2015a. Adding Semantics to Data-driven Paraphrasing. In Proceedings of the 53rd Annual Meeting of the Association for Computational Lin-guistics. ACL, pages 1511–1522.
Ellie Pavlick, Juri Ganitkevitch, Pushpendre Rastogi, Benjamin Van Durme, and Chris Callison-Burch. 2015b. PPDB 2.0: Better Paraphrase Ranking, Fine-grained Entailment Relations, Word Embeddings, and Style Classification. InProceedings of the 53rd Annual Meeting of the Association for Computa-tional Linguistics. ACL, pages 425–430.
Ellie Pavlick and Ani Nenkova. 2015. Inducing Lexical Style Properties for Paraphrase and Genre Differen-tiation. InProceedings of the 2015 Annual Confer-ence of the North American Chapter of the Associa-tion for ComputaAssocia-tional Linguistics. NAACL, pages 218–224.
Daniel Preot¸iuc-Pietro, Jordan Carpenter, Salvatore Giorgi, and Lyle Ungar. 2016a. Studying the Dark Triad of Personality using Twitter Behavior. In Proceedings of the 25th ACM Conference on Infor-mation and Knowledge Management. CIKM, pages 761–770.
Daniel Preot¸iuc-Pietro, Johannes Eichstaedt, Gregory Park, Maarten Sap, Laura Smith, Victoria Tobolsky, H Andrew Schwartz, and Lyle H Ungar. 2015a. The Role of Personality, Age and Gender in Tweeting about Mental Illnesses. InProceedings of the Work-shop on Computational Linguistics and Clinical Psy-chology: From Linguistic Signal to Clinical Reality. NAACL.
Daniel Preot¸iuc-Pietro, Vasileios Lampos, and Niko-laos Aletras. 2015b. An Analysis of the User Oc-cupational Class through Twitter Content. In Pro-ceedings of the 53rd Annual Meeting of the Asso-ciation for Computational Linguistics. ACL, pages 1754–1764.
Daniel Preot¸iuc-Pietro, Ye Liu, Daniel J. Hopkins, and Lyle Ungar. 2017. Beyond Binary Labels: Political Ideology Prediction of Twitter Users. In Proceed-ings of the 55th Conference of the Association for Computational Linguistics. ACL.
Daniel Preot¸iuc-Pietro, Sina Samangooei, Trevor Cohn, Nicholas Gibbins, and Mahesan Niranjan. 2012. Trendminer: An Architecture for Real Time Analy-sis of Social Media Text. InWorkshop on Real-Time Analysis and Mining of Social Streams (RAMSS). ICWSM.
Daniel Preot¸iuc-Pietro, Svitlana Volkova, Vasileios Lampos, Yoram Bachrach, and Nikolaos Aletras. 2015c. Studying User Income through Language, Behaviour and Affect in Social Media. PLoS ONE. Daniel Preot¸iuc-Pietro, Wei Xu, and Lyle Ungar. 2016b.
Discovering User Attribute Stylistic Differences via Paraphrasing. InProceedings of the Thirtieth AAAI Conference on Artificial Intelligence. AAAI, pages 3030–3037.
Francisco Rangel, Fabio Celli, Paolo Rosso, Martin Potthast, Benno Stein, and Walter Daelemans. 2015. Overview of the 3rd Author Profiling Task at PAN 2015. InCLEF.
Delip Rao, David Yarowsky, Abhishek Shreevats, and Manaswi Gupta. 2010. Classifying Latent User At-tributes in Twitter. In Proceedings of the 2nd In-ternational Workshop on Search and Mining User-generated Contents. SMUC, pages 37–44.
Maarten Sap, Gregory Park, Johannes Eichstaedt, Mar-garet Kern, Lyle Ungar, and H Andrew Schwartz. 2014. Developing Age and Gender Predictive Lex-ica over Social Media. InProceedings of the 2014 Conference on Empirical Methods in Natural Lan-guage Processing. EMNLP, pages 1146–1151. Ruchita Sarawgi, Kailash Gajulapalli, and Yejin Choi.
2011. Gender Attribution: Tracing Stylometric Ev-idence beyond Topic and Genre. InProceedings of the Fifteenth Conference on Computational Natural Language Learning. CONNL, pages 78–86. Jocelyn Schock, Michael J Cortese, and Maya M
Khanna. 2012. Imageability Estimates for 3,000 Disyllabic Words. Behavior Research Methods 44(2):374–379.
Michael P Toglia and William F Battig. 1978. Hand-book of Semantic Word Norms. Lawrence Erlbaum. Svitlana Volkova, Glen Coppersmith, and Benjamin Van Durme. 2014. Inferring User Political Pref-erences from Streaming Communications. In Pro-ceedings of the 52nd Annual Meeting of the Asso-ciation for Computational Linguistics. ACL, pages 186–196.
Svitlana Volkova, Theresa Wilson, and David Yarowsky. 2013. Exploring Demographic Language Variations to Improve Multilingual Sentiment Analysis in Social Media. In Proceedings of the 2013 Conference on Empirical Methods in Natural Language Processing. EMNLP, pages 1815–1827. Amy Beth Warriner, Victor Kuperman, and Marc
Brys-baert. 2013. Norms of Valence, Arousal, and Dom-inance for 13,915 English Lemmas. Behavior Re-search Methods45(4):1191–1207.