Reference-less Quality Estimation of Text Simplification Systems
Louis MartinFacebook AI Research & Inria [email protected]
Samuel Humeau
Facebook AI Research [email protected]
Pierre-Emmanuel Mazar´e
Facebook AI Research [email protected]
Antoine Bordes
Facebook AI Research [email protected]
´Eric de La Clergerie
Inria
eric.de la [email protected]
Benoˆıt Sagot
Inria
Abstract
The evaluation of text simplification (TS) systems remains an open challenge. As the task has common points with machine translation (MT), TS is often evaluated using MT metrics such as BLEU. How-ever, such metrics require high quality ref-erence data, which is rarely available for TS. TS has the advantage over MT of be-ing a monolbe-ingual task, which allows for direct comparisons to be made between the simplified text and its original ver-sion. In this paper, we compare multiple approaches to reference-less quality esti-mation of sentence-level text simplifica-tion systems, based on the dataset used for the QATS 2016 shared task. We dis-tinguish three different dimensions: gram-maticality, meaning preservation and sim-plicity. We show that n-gram-based MT metrics such as BLEU and METEOR cor-relate the most with human judgment of grammaticality and meaning preservation, whereas simplicity is best evaluated by ba-sic length-based metrics.
1 Introduction
Text simplification (hereafter TS) has received in-creasing interest by the scientific community in recent years. It aims at producing a simpler ver-sion of a source text that is both easier to read and to understand, thus improving the accessibil-ity of text for people suffering from a range of dis-abilities such as aphasia (Carroll et al., 1998) or dyslexia (Rello et al., 2013), as well as for sec-ond language learners (Xia et al.,2016) and peo-ple with low literacy (Watanabe et al.,2009). This topic has been researched for a variety of lan-guages such as English (Zhu et al.,2010;Wubben
et al.,2012;Narayan and Gardent,2014;Xu et al., 2015), French (Brouwers et al., 2014), Spanish (Saggion et al.,2011), Portuguese (Specia,2010), Italian (Brunato et al.,2015) and Japanese (Goto et al.,2015).1
One of the main challenges in TS is finding an adequate automatic evaluation metric, which is necessary to avoid the time-consuming human evaluation. Any TS evaluation metric should take into account three properties expected from the output of a TS system, namely:
• Grammaticality: how grammatically correct
is the TS system output?
• Meaning preservation: how well is the mean-ing of the source sentence preserved in the TS system output?
• Simplicity: how simple is the TS system out-put?2
TS is often reduced to a sentence-level problem, whereby one sentence is transformed into a sim-pler version containing one or more sentences. In this paper, we shall make use of the termssource (sentence)and(TS system) output to respectively denote a sentence given as an input to a TS system and the simplified, single or multi-sentence output produced by the system.
TS, seen as a sentence-level problem, is of-ten viewed as a monolingual variant of (senof-tence- (sentence-level) MT. The standard approach to automatic TS evaluation is therefore to view the task as a transla-tion problem and to use machine translatransla-tion (MT)
1Note that text simplification has also been used as a pre-processing step for other natural language pre-processing tasks such as machine translation (Chandrasekar et al.,1996) and semantic role labelling (Vickrey and Koller,2008).
evaluation metrics such as BLEU (Papineni et al., 2002). However, MT evaluation metrics rely on the existence of parallel corpora of source sen-tences and manually produced reference transla-tions, which are available on a large scale for many language pairs (Tiedemann,2012). TS datasets are less numerous and smaller. Moreover, they are of-ten automatically extracted from comparable cor-pora rather than strictly parallel corcor-pora, which results in noisier reference data. For example, the PWKP dataset (Zhu et al., 2010) consists of 100,000 sentences from the English Wikipedia au-tomatically aligned with sentences from the Sim-ple English Wikipedia based on term-based sim-ilarity metrics. It has been shown by Xu et al. (2015) that many of PWKP’s “simplified” sen-tences are in fact not simpler or even not related to their corresponding source sentence. Even if bet-ter quality corpora such as Newsela do exist (Xu et al.,2015), they are costly to create, often of lim-ited size, and not necessarily open-access.
This creates a challenge for the use of reference-based MT metrics for TS evaluation. However, TS has the advantage of being a monolingual translation-like task, the source being in the same language as the output. This allows for new, non-conventional ways to use MT evaluation metrics, namely by using them to compare the output of a TS system with the source sentence, thus avoid-ing the need for reference data. However, such an evaluation method can only capture at most two of the three above-mentioned dimensions, namely meaning preservation and, to a lesser extent, gram-maticality.
Previous works on reference-less TS evaluation include ˇStajner et al.(2014), who compare the be-haviour of six different MT metrics when used between the source sentence and the correspond-ing simplified output. They evaluate these metrics with respect to meaning preservation and gram-maticality. We extend their work in two direc-tions. Firstly, we extend the comparison to in-clude the degree of simplicity achieved by the sys-tem. Secondly, we compare additional features, including those used byˇStajner et al.(2016a), both individually, as elementary metrics, and within multi-feature metrics. To our knowledge, no pre-vious work has provided as thorough a compari-son across such a wide range and combination of features for the reference-less evaluation of TS.
First we review available text simplification
evaluation methods and traditional quality estima-tion features. We then present the QATS shared task and the associated dataset, which we use for our experiments. Finally we compare all methods in a reference-less setting and analyze the results.
2 Existing evaluation methods
2.1 Using MT metrics to compare the output and a reference
TS can be considered as a monolingual transla-tion task. As a result, MT metrics such as BLEU (Papineni et al.,2002), which compare the output of an MT system to a reference translation, have been extensively used for TS (Narayan and Gar-dent, 2014; ˇStajner et al.,2015;Xu et al.,2016). Other successful MT metrics include TER (Snover et al.,2009), ROUGE (Lin,2004) and METEOR (Banerjee and Lavie, 2005), but they have not gained much traction in the TS literature.
These metrics rely on good quality references, something which is often not available in TS, as discussed byXu et al.(2015). Moreover, ˇStajner et al.(2015) andSulem et al.(2018a) showed that using BLEU to compare the system output with a reference is not a good way to perform TS evalua-tion, even when good quality references are avail-able. This is especially true when the TS sys-tem produces more than one sentence for a single source sentence.
2.2 Using MT metrics to compare the output and the source sentence
ref-erences are available.
Attempts to perform Quality Estimation on the output of TS systems, without using references, include the 2016 Quality Assessment for Text Simplification (QATS) shared task (ˇStajner et al., 2016b), to which we shall come back in section3. Sulem et al.(2018b) introduce another approach, named SAMSA. The idea is to evaluate the struc-tural simplicity of a TS system output given the corresponding source sentence. SAMSA is max-imized when the simplified text is a sequence of short and simple sentences, each accounting for one semantic event in the original sentence. It re-lies on an in-depth analysis of the source sentence and the corresponding output, based on a semantic parser and a word aligner. A drawback of this ap-proach is that good quality semantic parsers are only available for a handful of languages. The intuition that sentence splitting is an important sub-task for producing simplified text motivated Narayan et al. (2017) to organize the Split and Rephraseshared task, which was dedicated to this problem.
2.3 Other metrics
One can also estimate the quality of a TS system output based on simple features extracted from it.
For instance, the QUEST framework for qual-ity estimation in MT gives a number of useful baseline features for evaluating an output sentence (Specia et al., 2013). These features range from simple statistics, such as the number of words in the sentence, to more sophisticated features, such as the probability of the sentence according to a language model. Several teams who par-ticipated in the QATS shared task used metrics based on this framework, namely SMH (ˇStajner et al., 2016a), UoLGP (Rios and Sharoff, 2015) and UoW (B´echara et al.,2015).
Readability metrics such as Flesch-Kincaid Grade Level (FKGL) and Flesch Reading Ease (FRE) (Kincaid et al.,1975) have been extensively used for evaluating simplicity. These two metrics, which were shown experimentally to give good results, are linear combinations of the number of words per sentence and the number of syllables per word, using carefully adjusted weights.
3 Methodology
[image:3.595.312.527.48.210.2]Our goal is to compare a large number of ways to perform TS evaluation without a reference. To
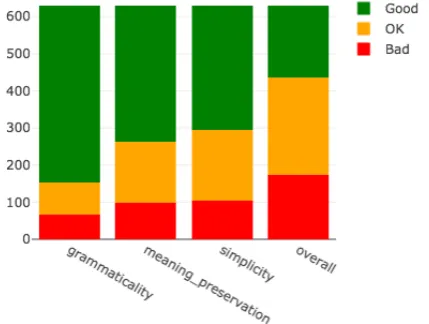
Figure 1: Label repartition on the QATS Shared task
this end, we use the dataset provided in the QATS shared task. We first compare the behaviour of elementary metrics, which range from commonly used metrics such as BLEU to basic metrics based on a single low-level feature such as sentence length. We then compare the effect of aggregating these elementary metrics into more complex ones and compare our results with the state of the art, based on the QATS shared task data and results.
3.1 The QATS shared task
The data from the QATS shared task (ˇStajner et al., 2016b) consists of a collection of 631 pairs of en-glish sentences composed of a source sentence ex-tracted from an online corpus and a simplified ver-sion thereof, which can contain one or more sen-tences. This collection is split into a training set (505 sentence pairs) and a test set (126 sentence pairs). Simplified versions were produced auto-matically using one of several TS systems trained by the shared task organizers. Human annotators labelled each sentence pair using one of the three labels Good, OK and Bad on each of the three dimensions: grammaticality, meaning preserva-tion and simplicity3. An overall quality label was then automatically assigned to each sentence pair based on its three manually assigned labels using a method detailed in (ˇStajner et al.,2016b). Dis-tribution of the labels and examples are presented in FIGURE1and TABLE1.
The goal of the shared task is, for each sentence in the test set, to either produce a label (Good,OK,
Version Sentence G MAspectS O Modification
Original All three were arrested in the Toome areato the Serious Crime Suite at Antrim police station.andhave been taken good good good good syntactic
Simple All three were arrested in the Toome area.taken to the Serious Crime Suite at Antrim police station.All threehave been
Original
For years the former Bosnia Serb army commander Ratko Mladic had evaded captureand was one of the worlds most wanted men, but his time on the run finally ended last year
when he was arrested near Belgrade. good bad ok bad content reduction
Simple For years the former Bosnia Serb army commander RatkoMladic had evaded capture.
Original Madrid was occupied by French troops during the NapoleonicWars, and Napoleons brother Joseph wasinstalledon the
throne. good good good good lexical
Simple Madrid was occupied by French troops during the NapoleonicWars, and Napoleons brother Joseph wasputon the throne.
Original Keeping articles with potentialunregistered users, to be bold and improve the article to allow itencourageseditors, especially
to evolve over time. bad bad ok bad dropping
[image:4.595.77.522.46.320.2]Simple Keeping articles with potential editors, especially unregisteredusers, to be bold and improve the article to allow it to evolve over time.
Table 1: Examples from the training dataset of QATS. Differences between the original and the simplified version are presented in bold. This table is adapted from ˇStajner et al.(2016b).
Bad) or a raw score estimating the overall quality of the simplification for each of the three dimen-sions. Raw score predictions are evaluated using the Pearson correlation with the ground truth la-bels, while actual label prediction are evaluated using the weighted F1-score. The shared task is described in further details on the QATS website4.
3.2 Features
In our experiments, we compared about 60 ele-mentary metrics, which can be organised as fol-lows:
• MT metrics
– BLEU, ROUGE, METEOR, TERp
– Variants of BLEU: BLEU 1gram,
BLEU 2gram, BLEU 3gram,
BLEU 4gram and seven smoothing methods5 from NLTK (Bird and Loper, 2004).
– Intermediate components of TERp in-spired by (ˇStajner et al., 2016a): e.g. number of insertions, deletions, shifts...
4http://qats2016.github.io/shared.html 5https://www.nltk.org/api/nltk.
translate.html#nltk.translate.bleu_ score.SmoothingFunction
• Readability metrics and other sentence-level
features: FKGL and FRE, numbers of words, characters, syllables...
• Metrics based on the baseline QUEST fea-tures (17 feafea-tures) (Specia et al.,2013), such as statistics on the number of words, word lengths, language model probability and n-gram frequency.
• Metrics based on other features: frequency table position, concreteness as extracted from Brysbaert et al.’s2014 list, language model probability of words using a convolutional sequence to sequence model from (Gehring et al.,2017), comparison methods using pre-trained fastText word embeddings (Mikolov et al.,2018) or Skip-thought sentence embed-dings (Kiros et al.,2015).
TABLE 2 lists 30 of the elementary metrics that we compared, which are those that we found to correlate the most with human judgments on one or more of the three dimensions (grammaticality, meaning preservation, simplicity).
3.3 Experimental setup
judgments on the training set. We first compute for each elementary metric the Pearson correlation be-tween its results and the manually assigned labels for each of the three dimensions. We then rank our elementary metrics according to the absolute value of the Pearson correlation.6
Training and evaluation of a combined met-ric We use our elementary metrics as features to train classifiers on the training set, and evalu-ate their performance on the test set. We therefore scale them and reduce the dimensionality with a 25-component PCA7, then train several regression algorithms8 and classification algorithms9 using scikit-learn (Pedregosa et al.,2011). For each di-mension, we keep the two models performing best on the test set and add them in the leaderboard of the QATS shared task (TABLE 4), naming them with the name of the regression algorithm they were built with.
4 Results
4.1 Comparing elementary metrics
FIGURE 3 ranks all elementary metrics given their absolute Pearson correlation on each of the three dimensions.
Grammaticality N-gram based MT metrics have the highest correlation with human grammat-icality judgments. METEOR seems to be the best, probably because of its robustness to synonymy, followed by smoothed BLEU (BLEUSmoothed in2). This indicates that relevant grammaticality information can be derived from the source sen-tence. We were expecting that information con-tained in a language model would help achieving better results (AvgLMProbsOutput), but MT met-rics correlate better with human judgments. We deduce that the grammaticality information con-tained in the source is more specific and more helpful for evaluation than what is learned by the language model.
6We will release our code on github.
7We used PCA instead of feature selection because it per-formed better on the validation set. The number of compo-nent was tuned on the validation set as well.
8Regressors: Linear regression, Lasso, Ridge, Linear SVR (SVM regressor), Adaboost regressor, Gradient boost-ing regressor and Random forest regressor.
9Classifiers: Logistic regression, MLP classifier (with L2 penalty, alpha=1), SVC (linear SVM classifier), K-nearsest neighbors classifier (k=3), Adaboost classifier, Gra-dient boosting classifier and Random forest classifier.
Meaning preservation It is not surprising that meaning preservation is best evaluated using MT metrics that compare the source sentence to the output sentence, with in particular smoothed BLEU, BLEU 3gram and METEOR. Very simple features such as the percentage of words in com-mon between source and output also rank high. Surprisingly, word embedding comparison meth-ods do not perform as well for meaning preserva-tion, even when using word alignment.
Simplicity Methods that give the best results are the most straightforward for assessing simplicity, namely word, character and syllable counts in the output, averaged over the number of output sen-tences. These simple features even outperform the traditional, more complex metrics FKGL and FRE. As could be expected, we find that met-rics with the highest correlation to human simplic-ity judgments only take the output into account. Exceptions are theNBSourceWords and NBSour-cePunct features. Indeed, if the source sentence has a lot of words and punctuation, and is therefore likely to be particularly complex, then the output will most likely be less simple as well. We also ex-pected word concreteness ratings and position in the frequency table to be good indicators of sim-plicity, but it does not seem to be the case here. Structural simplicity might simply be more impor-tant than such more sophisticated components of the human intuition of simple text.
Discussion Even if counting the number of words or comparingn-grams are good proxies for the simplification quality, they are still very su-perficial features and might miss some deeper and more complex information. Moreover the fact that grammaticality and meaning preservation are best evaluated usingn-gram-based comparison metrics might bias the TS models towards copying the source sentence and applying fewer modifications. Syntactic parsing or language modelling might capture more insightful grammatical information and allow for more flexibility in the simplification model. Regarding meaning preservation, seman-tic analysis or paraphrase detection models would also be good candidates for a deeper analysis.
Short name Description
NBSourcePunct Number of punctuation tokens in source (QUEST)
NBSourceWords Number of source words (QUEST)
NBOutputPunct Number of punctuation tokens in output (QUEST)
TypeTokenRatio Type token ratio (QUEST)
TERp Del Number of deletions (TERp component) TERp NumEr Number of total errors (TERp component) TERp Sub Number of substitutions (TERp component)
TERp TERp MT metric
BLEU 1gram BLEU MT metric with unigrams only
BLEU 2gram BLEU MT metric up to bigrams
BLEU 3gram BLEU MT metric up to trigrams
BLEU 4gram BLEU MT metric up to 4-grams
METEOR METEOR MT metric
ROUGE ROUGE summarization metric
BLEUSmoothed BLEU MT metric with smoothing (method 7 from nltk)
AvgCosineSim Cosine similarity between source and output pre-trained word embeddings NBOutputChars Number of characters in the output
NBOutputCharsPerSent Average number of characters per sentence in the output NBOutputSyllables Number of syllables in the output
NBOutputSyllablesPerSent Average number of syllables per sentence in the output NBOutputWords Number of words in the output
NBOutputWordsPerSent Average number of words per sentence in the output
AvgLMProbsOutput Average log-probabilities of output words (Language Model) MinLMProbsOutput Minimum log-probability of output words (Language Model) MaxPosInFreqTable Maximum position of output words in the frequency table
AvgConcreteness Average word concretenessBrysbaert et al.’s2014concreteness list
OutputFKGL Flesch-Kincaid Grade Level
OutputFRE Flesch Reading Ease
[image:6.595.80.519.67.460.2]WordsInCommon Percentage of words in common between source and Output
Table 2: Brief description of 30 of our most relevant elementary metrics
Grammaticality Meaning Preservation Simplicity
Short name Train↓ Test Short name Train↓ Test Short name Train↓ Test
Best QATS team 0.48 Best QATS team 0.59 Best QATS team 0.38
METEOR 0.36 0.39 BLEUSmoothed 0.59 0.52 NBOutputCharsPerSent -0.52 -0.45 BLEUSmoothed 0.33 0.34 BLEU 3gram 0.57 0.52 NBOutputSyllablesPerSent -0.52 -0.49 BLEU 4gram 0.32 0.34 METEOR 0.57 0.58 NBOutputWordsPerSent -0.51 -0.39 BLEU 3gram 0.31 0.34 BLEU 2gram 0.57 0.52 NBOutputChars -0.48 -0.37 TERp NumEr -0.30 -0.31 BLEU 4gram 0.57 0.51 NBOutputWords -0.47 -0.29 BLEU 2gram 0.30 0.34 WordsInCommon 0.55 0.50 NBOutputSyllables -0.46 -0.42 TERp -0.30 -0.32 BLEU 1gram 0.55 0.52 NBOutputPunt -0.42 -0.31 ROUGE 0.29 0.29 ROUGE 0.55 0.47 NBSourceWords -0.38 -0.21 AvgLMProbsOutput 0.28 0.34 TERp -0.54 -0.48 outputFKGL -0.36 -0.37 BLEU 1gram 0.27 0.33 TERp NumEr -0.53 -0.49 NBSourcePunct -0.34 -0.18 WordsInCommon 0.27 0.30 TERp Del -0.50 -0.52 TypeTokenRatio -0.22 -0.04 TERp Del -0.27 -0.35 AvgCosineSim 0.44 0.34 AvgConcreteness 0.21 0.32 NBSourceWords -0.25 -0.07 AvgLMProbsOutput 0.39 0.36 MaxPosInFreqTable -0.18 0.03 AvgCosineSim 0.23 0.25 AvgConcreteness -0.28 -0.06 MinLMProbsOutput 0.17 0.15 MinLMProbsOutput 0.11 -0.07 NBSourceWords -0.28 -0.13 OutputFRE 0.16 0.27
[image:6.595.75.526.513.696.2]question. For instance, METEOR, which per-forms best on grammaticality, has a 95% confi-dence interval of0.36±0.08on the training set. These results are therefore preliminary and should be validated on other datasets.
4.2 Combination of all features with trained models
We also combine all elementary metrics and train an evaluation models for each of the three dimen-sions. TABLE4apresents our two best regressors in validation for each of the dimensions and TA-BLE4bfor classifiers.
Pearson correlation for regressors (raw scor-ing) Combining the features does not bring a clear advantage over the elementary metrics ME-TEOR and NBOutputSyllablesPerSent. Indeed our best models score respectively on grammati-cality, meaning preservation and simplicity: 0.33 (Lasso), 0.58 (Ridge) and 0.49 (Ridge) versus 0.39 (METEOR), 0.58 (METEOR) and 0.49 (NBOut-putSyllablesPerSent).
It is surprising to us that the aggregation of mul-tiple elementary features would score worse than the features themselves. However, we observe a strong discrepancy between the scores obtained on the train and test set, as illustrated by TABLE3. We also observed very large confidence intervals in terms of Pearson correlation. For instance our lasso model scores0.33±0.17on the test set for grammaticality. This should observe caution when interpreting Pearson scores on QATS.
F1-score for classifiers (assigning labels) On the classification task, our models seem to score best for meaning preservation, simplicity and overall, and third for grammaticality. This seems to confirm the importance of considering a large ensemble of elementary features including length-based metrics to evaluate simplicity.
5 Conclusion
Finding accurate ways to evaluate text simplifica-tion (TS) without the need for reference data is a key challenge for TS, both for exploring new approaches and for optimizing current models, in particular those relying on unsupervised, often MT-inspired models.
We explore multiple reference-less quality eval-uation methods for automatic TS systems, based on data from the 2016 QATS shared task. We rely
on the three key dimensions of the quality of a TS system: grammaticality, meaning preservation and simplicity.
Our results show that grammaticality and mean-ing preservation are best assessed usmean-ing n-gram-based MT metrics evaluated between the output and the source sentence. In particular, METEOR and smoothed BLEU achieve the highest corre-lation with human judgments. These approaches even outperform metrics that make an extensive use of external data, such as language models. This shows that a lot of useful information can be obtained from the source sentence itself.
Regarding simplicity, we observe that counting the number of characters, syllables and words pro-vides the best results. In other words, given the currently available metrics, the length of a sen-tence seems to remain the best available proxy for its simplicity.
However, given the small size of the QATS dataset and the high variance observed in our ex-periments, these results must be taken with a pinch of salt and will need to be confirmed on a larger dataset. Creating a larger annotated dataset as well as averaging multiple human annotations for each pair of sentences would help reducing the variance of the experiments and confirming our findings.
Grammaticality Meaning Preservation Simplicity Overall
0.482 OSVCML1 0.588 IIT-Meteor 0.487Ridge 0.423Ridge
0.384 METEOR 0.585 OSVCML 0.456LinearSVR 0.423LinearRegression
0.344 BLEU 0.575Ridge 0.382 OSVCML1 0.343 OSVCML2
0.340 OSVCML 0.573 OSVCML2 0.376 OSVCML2 0.334 OSVCML
0.327Lasso 0.555Lasso 0.339 OSVCML 0.232 SimpleNets-RNN2
0.323 TER 0.533 BLEU 0.320 SimpleNets-MLP 0.230 OSVCML1
0.308 SimpleNets-MLP 0.527 METEOR 0.307 SimpleNets-RNN3 0.205 UoLGP-emb
0.308 WER 0.513 TER 0.240 SimpleNets-RNN2 0.198 SimpleNets-MLP
0.256 UoLGP-emb 0.495 WER 0.123 UoLGP-combo 0.196 METEOR
0.256 UoLGP-combo 0.482 OSVCML1 0.120 UoLGP-emb 0.189 UoLGP-combo 0.208 UoLGP-quest 0.465 SimpleNets-MLP 0.086 UoLGP-quest 0.144 UoLGP-quest 0.118GradientBoostingRegressor 0.285 UoLGP-quest 0.052 IIT-S 0.130 TER
0.064 SimpleNets-RNN3 0.262 SimpleNets-RNN2 -0.169 METEOR 0.112 SimpleNets-RNN3 0.056 SimpleNets-RNN2 0.262 SimpleNets-RNN3 -0.242 TER 0.111 WER
0.250 UoLGP-combo -0.260 WER 0.107 BLEU 0.188 UoLGP-emb -0.267 BLEU
(a) Pearson correlation for regressors (raw scoring)
Grammaticality Meaning Preservation Simplicity Overall
71.84 SMH-RandForest 70.14SVC 61.60SVC 49.61LogisticRegression
71.64 SMH-IBk 68.07 SMH-Logistic 56.95AdaBoostClassifier 48.57 SMH-RandForest-b 70.43LogisticRegression 65.60 MS-RandForest 56.42 SMH-RandForest-b 48.20 UoW
69.96 SMH-RandForest-b 64.40 SMH-RandForest 53.02 SMH-RandForest 47.54 SMH-Logistic
69.09 BLEU 63.74 TER 51.12 SMH-IBk 46.06 SimpleNets-RNN2
68.82 SimpleNets-MLP 63.54 SimpleNets-MLP 49.96 SimpleNets-RNN3 45.71AdaBoostClassifier
68.36 TER 62.82 BLEU 49.81 SimpleNets-MLP 44.50 SMH-RandForest 67.60GradientBoosting 62.72 MT-baseline 48.31 MT-baseline 40.94 METEOR 67.53 MS-RandForest 62.69 IIT-Meteor 47.84 MS-IBk-b 40.75 SimpleNets-RNN3 67.50 IIT-LM 61.71 MS-IBk-b 47.82 MS-RandForest 39.85 MS-RandForest 66.79 WER 61.50 MS-IBk 47.47 SimpleNets-RNN2 39.80 DeepIndiBow 66.75 MS-RandForest-b 60.38GradientBoosting 43.46 IIT-S 39.30 IIT-Metrics 65.89 DeepIndiBow 60.12 METEOR 42.57 DeepIndiBow 38.27 MS-IBk 65.89 DeepBow 59.69 SMH-RandForest-b 40.92 UoW 38.16 MS-IBk-b 65.89 MT-baseline 59.06 WER 39.68 Majority-class 38.03 DeepBow 65.89 Majority-class 58.83 UoW 38.10 MS-IBk 37.49 MT-baseline 65.72 METEOR 51.29 SimpleNets-RNN2 35.58 DeepBow 34.08 TER 65.50 SimpleNets-RNN2 51.00 CLaC-RF 34.88 CLaC-RF-0.5 34.06 CLaC-0.5 65.11 SimpleNets-RNN3 46.64 SimpleNets-RNN3 34.66 CLaC-RF-0.6 33.69 SimpleNets-MLP 64.39 CLaC-RF-Perp 46.30 DeepBow 34.48 WER 33.04 IIT-Default 62.00 MS-IBk 42.53 DeepIndiBow 34.30 CLaC-RF-0.7 32.92 BLEU
46.32 UoW 42.51 Majority-class 33.52 TER 32.88 CLaC-0.7
33.34 METEOR 32.20 CLaC-0.6
33.00 BLEU 31.28 WER
[image:8.595.83.516.338.609.2]26.53 Majority-class (b) Weighted F1 Score for classifiers (assign the label Good, OK or Bad)
Acknowledgments
We would like to thank our anonymous reviewers for their insightful comments.
References
Satanjeev Banerjee and Alon Lavie. 2005. Meteor: An automatic metric for mt evaluation with improved correlation with human judgments. InProceedings of the acl workshop on intrinsic and extrinsic evalu-ation measures for machine translevalu-ation and/or sum-marization, pages 65–72.
Hanna B´echara, Hernani Costa, Shiva Taslimipoor, Ro-hit Gupta, Constantin Orasan, Gloria Corpas Pastor, and Ruslan Mitkov. 2015. Miniexperts: An svm ap-proach for measuring semantic textual similarity. In Proceedings of the 9th international workshop on semantic evaluation (SemEval 2015), pages 96–101.
Steven Bird and Edward Loper. 2004. Nltk: the nat-ural language toolkit. In Proceedings of the ACL 2004 on Interactive poster and demonstration ses-sions, page 31. Association for Computational Lin-guistics.
Laetitia Brouwers, Delphine Bernhard, Anne-Laure Ligozat, and Thomas Franc¸ois. 2014. Syntactic sen-tence simplification for french. In Proceedings of the 3rd Workshop on Predicting and Improving Text Readability for Target Reader Populations (PITR), pages 47–56.
Dominique Brunato, Felice Dell’Orletta, Giulia Ven-turi, and Simonetta Montemagni. 2015. Design and annotation of the first italian corpus for text simpli-fication. InProceedings of The 9th Linguistic Anno-tation Workshop, pages 31–41.
Marc Brysbaert, Amy Beth Warriner, and Victor Ku-perman. 2014. Concreteness ratings for 40 thousand generally known english word lemmas. Behavior research methods, 46(3):904–911.
John Carroll, Guido Minnen, Yvonne Canning, Siob-han Devlin, and John Tait. 1998. Practical simpli-fication of english newspaper text to assist aphasic readers. In Proceedings of the AAAI-98 Workshop on Integrating Artificial Intelligence and Assistive Technology, pages 7–10.
Raman Chandrasekar, Christine Doran, and Bangalore Srinivas. 1996. Motivations and methods for text simplification. In Proceedings of the 16th confer-ence on Computational linguistics-Volume 2, pages 1041–1044. Association for Computational Linguis-tics.
Jonas Gehring, Michael Auli, David Grangier, De-nis Yarats, and Yann N. Dauphin. 2017. Convolu-tional sequence to sequence learning. arXiv preprint arXiv:1705.03122.
Isao Goto, Hideki Tanaka, and Tadashi Kumano. 2015. Japanese news simplification: Task design, data set construction, and analysis of simplified text. Pro-ceedings of MT Summit XV, 1:17–31.
J. Peter Kincaid, Robert P Fishburne Jr., Richard L. Rogers, and Brad S. Chissom. 1975. Derivation of new readability formulas (automated readability in-dex, fog count and flesch reading ease formula) for navy enlisted personnel.
Ryan Kiros, Yukun Zhu, Ruslan R Salakhutdinov, Richard Zemel, Raquel Urtasun, Antonio Torralba, and Sanja Fidler. 2015. Skip-thought vectors. In Advances in neural information processing systems, pages 3294–3302.
Chin-Yew Lin. 2004. Rouge: A package for auto-matic evaluation of summaries. Text Summarization Branches Out.
Tomas Mikolov, Edouard Grave, Piotr Bojanowski, Christian Puhrsch, and Armand Joulin. 2018. Ad-vances in pre-training distributed word representa-tions. InProceedings of the International Confer-ence on Language Resources and Evaluation (LREC 2018).
Shashi Narayan and Claire Gardent. 2014. Hybrid sim-plification using deep semantics and machine trans-lation. In Proceedings of the 52nd Annual Meet-ing of the Association for Computational LMeet-inguistics (Volume 1: Long Papers), volume 1, pages 435–445.
Shashi Narayan, Claire Gardent, Shay B Cohen, and Anastasia Shimorina. 2017. Split and rephrase. arXiv preprint arXiv:1707.06971.
Kishore Papineni, Salim Roukos, Todd Ward, and Wei-Jing Zhu. 2002. Bleu: a method for automatic eval-uation of machine translation. In Proceedings of the 40th annual meeting on association for compu-tational linguistics, pages 311–318. Association for Computational Linguistics.
Fabian Pedregosa, Gal Varoquaux, Alexandre Gram-fort, Vincent Michel, Bertrand Thirion, Olivier Grisel, Mathieu Blondel, Peter Prettenhofer, Ron Weiss, Vincent Dubourg, Jake Vanderplas, Alexan-dre Passos, David Cournapeau, Matthieu Brucher, Matthieu Perrot, and douard Duchesnay. 2011. Scikit-learn: Machine Learning in Python. Journal of Machine Learning Research, 12:2825–2830.
Luz Rello, Ricardo Baeza-Yates, Stefan Bott, and Horacio Saggion. 2013. Simplify or help?: text simplification strategies for people with dyslexia. In Proceedings of the 10th International Cross-Disciplinary Conference on Web Accessibility, page 15. ACM.
Horacio Saggion, Elena G´omez Mart´ınez, Esteban Etayo, Alberto Anula, and Lorena Bourg. 2011. Text simplification in simplext. making text more accessible. Procesamiento del lenguaje natural, 47:341–342.
Max Schwarzer and David Kauchak. 2018. Human evaluation for text simplification: The simplicity-adequacy tradeoff.
Matthew G Snover, Nitin Madnani, Bonnie Dorr, and Richard Schwartz. 2009. Ter-plus: paraphrase, se-mantic, and alignment enhancements to translation edit rate. Machine Translation, 23(2-3):117–127. Lucia Specia. 2010. Translating from complex to
sim-plified sentences. In International Conference on Computational Processing of the Portuguese Lan-guage, pages 30–39. Springer.
Lucia Specia, Kashif Shah, Jose GC Souza, and Trevor Cohn. 2013. Quest-a translation quality estimation framework. InProceedings of the 51st Annual Meet-ing of the Association for Computational LMeet-inguis- Linguis-tics: System Demonstrations, pages 79–84.
Sanja ˇStajner, Hannah B´echara, and Horacio Saggion. 2015. A deeper exploration of the standard pb-smt approach to text simplification and its evaluation. In Proceedings of the 53rd Annual Meeting of the Association for Computational Linguistics and the 7th International Joint Conference on Natural Lan-guage Processing (Volume 2: Short Papers), vol-ume 2, pages 823–828.
Sanja ˇStajner, Ruslan Mitkov, and Horacio Saggion. 2014. One step closer to automatic evaluation of text simplification systems. In Proceedings of the 3rd Workshop on Predicting and Improving Text Read-ability for Target Reader Populations (PITR), pages 1–10.
Sanja ˇStajner, Maja Popovic, and Hanna B´echara. 2016a. Quality estimation for text simplification. In Proceedings of the QATS Workshop, pages 15–21.
Sanja ˇStajner, Maja Popovic, Horacio Saggion, Lucia Specia, and Mark Fishel. 2016b. Shared task on quality assessment for text simplification. Training, 218(95):192.
Elior Sulem, Omri Abend, and Ari Rappoport. 2018a. Bleu is not suitable for the evaluation of text simpli-fication.
Elior Sulem, Omri Abend, and Ari Rappoport. 2018b. Semantic structural evaluation for text simplifica-tion. In Proceedings of the 2018 Conference of the North American Chapter of the Association for Computational Linguistics: Human Language Tech-nologies, Volume 1 (Long Papers), volume 1, pages 685–696.
Jrg Tiedemann. 2012. Parallel Data, Tools and In-terfaces in OPUS. In Proceedings of the 8th In-ternational Conference on Language Resources and
Evaluation, LREC’12, pages 2214–2218, Istanbul, Turkey.
David Vickrey and Daphne Koller. 2008. Sentence simplification for semantic role labeling. Proceed-ings of ACL-08: HLT, pages 344–352.
Willian Massami Watanabe, Arnaldo Candido Junior, Vin´ıcius Rodriguez Uzˆeda, Renata Pontin de Mat-tos Fortes, Thiago Alexandre Salgueiro Pardo, and Sandra Maria Alu´ısio. 2009. Facilita: reading as-sistance for low-literacy readers. InProceedings of the 27th ACM international conference on Design of communication, pages 29–36. ACM.
Sander Wubben, Antal Van Den Bosch, and Emiel Krahmer. 2012. Sentence simplification by mono-lingual machine translation. InProceedings of the 50th Annual Meeting of the Association for Compu-tational Linguistics: Long Papers-Volume 1, pages 1015–1024. Association for Computational Linguis-tics.
Menglin Xia, Ekaterina Kochmar, and Ted Briscoe. 2016. Text readability assessment for second lan-guage learners. In Proceedings of the 11th Work-shop on Innovative Use of NLP for Building Educa-tional Applications, pages 12–22.
Wei Xu, Chris Callison-Burch, and Courtney Napoles. 2015. Problems in current text simplification re-search: New data can help. Transactions of the Association of Computational Linguistics, 3(1):283– 297.
Wei Xu, Courtney Napoles, Ellie Pavlick, Quanze Chen, and Chris Callison-Burch. 2016. Optimizing statistical machine translation for text simplification. Transactions of the Association for Computational Linguistics, 4:401–415.