Measuring shear strain in a hollow cylinder apparatus using
electrolevel-inclinometer gages
O'Kelly, B.C.
Department of Civil, Structural and Environmental Engineering, Trinity College Dublin, Dublin 2, Ireland
Naughton, P.J.
School of Engineering, Institute of Technology, Sligo; Sligo, Ireland
Keywords: deformation, hollow cylinder apparatus, measurement, shear strain, torsion
ABSTRACT: Imperial College (IC) electrolevel-inclinometer gages are used to measure the deformation response of a test specimen within its central, uniformly-stressed gage length (free from specimen end restraint and bedding effects). In particular, single-axis and double-axes inclinometer configurations that measure the axial and twist deformation responses of test specimens in the IC hollow cylinder apparatus (HCA) have been reported in the literature. This paper describes the measurement of the deformation response of the smaller sized specimen tested in the University College Dublin HCA. The gage configurations were modified (reduced gage length from 120 to 45 mm) in order to suit the more compact cell chamber and the smaller specimen dimensions (50.0 mm outer radius). A set of equations, which build upon existing formulations reported by IC researchers, are developed in the present study to address a source of significant error in calculating the strain response. For example, the true torsional shear strain response following a stress path test on Leighton Buzzard sand was overestimated by typically 30% and 90% in the cases of the single-axis and double-axes gages, respectively. The equations take into consideration the specimen size and its axial deformation; the initial gage length and the articulation of the inclinometer linkages as the specimen deforms under loading, in determining the true strain response. The calibration of the inclinometers over the pseudo elastic range using an optical table and a laser distance measuring system is also presented.
1 INTRODUCTION
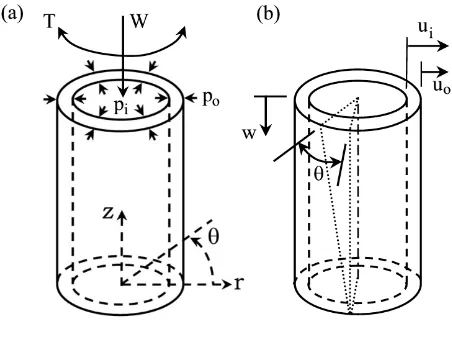
This paper studies the measurement of the torsional shear strain ( z ) response of the test specimen in a hollow cylinder apparatus (HCA) using local instrumentation in the form of Imperial College-type electrolevel inclinometers. In the HCA, a hollow cylindrical test specimen is subjected to an axial load (W); a torque (T) and outer and inner confining pressures (po and pi, respectively), Fig. 1a. It is convenient to use a polar coordinate system for the states of stress and deformation/strain in the specimen.
The inclinometers considered in the present study were of the type originally developed by Burland and Symes (1982) and Jardine et al. (1984) to measure the local axial deformation of triaxial test specimens, and which were further developed by Symes and Burland (1984) to measure the local axial (w) and twist ( ) deformations of specimens (Fig. 1b) tested in the Imperial College (IC) HCA (Hight
[image:1.595.308.534.589.758.2]et al. 1983). Additional local instrumentation (for example, proximity transducers (Hight et al. 1983; O’Kelly and Naughton 2005b, 2008)) are required in the case of the HCA to directly measure the radial displacements (uo, ui) of the outer and inner specimen wall surfaces, respectively.
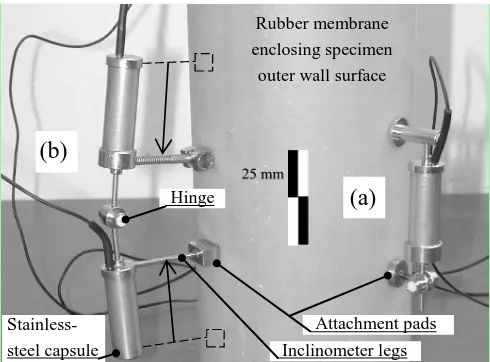
The inclinometers comprise electrolevels (sealed inside stainless steel capsules) which are mounted on mechanical linkages. The linkages are attached to the rubber membrane, enclosing the outer wall surface of the specimen, at two points using high-strength contact glue.
The electrolevels comprise three co-planer electrodes that are partially immersed in an electrolyte contained inside a sealed glass receptacle (Burland and Symes 1982). Relative axial and circumferential displacements of the inclinometer attachment pads during a test cause the electrolevel capsules to tilt in the radial and circumferential directions, respectively. The movement of the outer specimen membrane exactly matches that of the outer wall surface of the specimen (Tatsuoka et al. 1983). Hence, the axial and twist deformations of the specimen can be related to the changes in the electrical resistances that are measured between the central and outer electrodes of the electrolevels.
The size of the void space in the electrolevel capsule is such that the inclinometers experience neutral buoyancy in-service. Hence, the deformation response of the specimen is unaffected by the presence/attachment of the inclinometer gages.
2 EXPERIMENTAL STUDY
[image:2.595.309.548.386.438.2]Two inclinometer configurations were incorporated in the development and instrumentation of the University College Dublin (UCD) HCA (O’Kelly and Naughton 2003, 2005b). Firstly, the single-axis inclinometer (Fig. 2a) comprised a single electrolevel capsule mounted on a mechanical linkage that facilitated sliding of the capsule in the axial direction, thereby simply measuring the twist deformation response of the specimen. Secondly, the double-axes inclinometer, which is used to measure both the axial and twist deformation responses, comprised two electrolevel capsules that were mounted on a mechanical linkage (Fig. 2b).
Figure 2. UCD inclinometers: (a) Single axis; (b) Double axes.
The configuration of the linkages was modified to reduce the initial gage (nominally 120 mm in the Symes and Burland (1984) design) to 45 mm in length. The reconfiguration was necessary in the UCD HCA setup to facilitate free movement of the linkage mechanisms when the specimen deformed axially and to ensure that the specimen deformation response was recorded within its central, uniformly-stressed zone. Errors due to specimen end restraint and bedding effects (Jardine et al. 1984; Baldi et al. 1988) are avoided when the deformation response is measured within the mid-third of specimen length. This was achieved by relocating the inclinometer legs that attach the instrument to the outer specimen membrane from the outermost to the innermost ends of the electrolevel capsules (Fig. 2b).
[image:2.595.43.288.601.782.2]The range and resolution of the UCD inclinometers are listed in Table 1. The electrolevels were powered at 5 V and outputted 50-mV/mm axial deformation and 50 mV per three-degree twist, which facilitated axial normal and torsional shear strain measurements of the order of 10-3% strain (achieving the necessary resolution for deformation measurements in the pseudo elastic range).
Table 1. Range, resolution and output of UCD inclinometers. ________________________________________________ Deformation Range Resolution Output
(Volt) ________________________________________________ Axial – 20 to 20 mm 1 x 10⁻⁴ mm – 1.0 to 1.0 Twist – 30 to 30 deg 1 x 10⁻⁴ deg – 0.5 to 0.5 ________________________________________________
The dual aims of this study are:
1) Building upon existing formulations reported by IC researchers (for example, Symes and Burland (1984), derive equations to compute the true torional shear strain response for the UCD single-axis and double-axes inclinometer configurations;
2) Develop a method of calibrating the inclinometers with sufficient accuracy for measurement of the axial and torsional shear strains within the pseudo elastic range.
The equations must take into consideration the size of the specimen and its axial deformation response; the gage length (reduced to 45 mm) and the articulation of the inclinometer linkages as the specimen deforms under loading.
3 CALCULATION OF TORSIONAL SHEAR
STRAIN
The torsional shear strain z , which was calculated in this study by averaging over the cross-sectional
(b)
(a)
(
(a) (b)
Attachment pads Inclinometer legs Hinge
Rubber membrane enclosing specimen outer wall surface
area of the specimen wall (O’Kelly and Naughton 2005b), is given by:
) r r ( H
) r r (
i o
i o
z 2 2
3 3
3 2
(1)
where is the total twist deformation that occurs over the height (H) of the specimen, and ro and ri are the outer and inner specimen radii, respectively, measured during the course of a test in the HCA.
The inclinometers are used to determine the twist deformation that occurs over an axial gage length (Lz) located within the mid-third of the specimen height (H). The twist deformation is calculated from the inclinometer tilt ( incl), which is measured in the circumferential direction at a radius rincl: the radial distance from the specimen axis to the central electrode of the electrolevel capsule. Referring to Fig. 3, the twist deformation ( ) can be related to
incl as:
incl incl
r tan H
(2)
Figure 3. Twist deformation measured by inclinometer (adopted from Connolly and Kuwano 1999).
The outer specimen radius (ro) is directly measured (for example, using proximity transducers (O’Kelly and Naughton 2005b, 2008)) during the course of the test whereas the inclinometer radius rincl is not. Connolly and Kuwano (1999) noted that it would be incorrect to calculate the twist deformation of the specimen on the basis of the measured radius ro instead of the inclinometer radius rincl, in Eq. (2). A set of equations are developed in the present study to determine the value of radius rincl at any stage during the course of a test.
In general, the radius rincl is a function of the specimen dimensions and axial deformation; the inclinometer geometry and the initial gage length.
Figure 4 shows the arrangement of the modified double-axes inclinometer (symmetry about hinge at point a, Fig. 4).
Figure 4. Geometry of UCD double-axes inclinometer.
The UCD double-axes inclinometers had dimensions of A = 25.0 mm, B = 50.0 mm and C = 45.0 mm. Referring to Fig. 4, inclinometer radius rincl is given by:
o incl d r
r (3)
where d is the distance from the outer specimen wall surface to the center of the electrolevel capsule and ro is the outer specimen radius, which is measured during the course of the test.
The distance d changes as the specimen deforms axially with distance d directly related to the gage length (Lz). However, distance d is independent of any relative twist that occurs between the inclinometer attachment-points due to the configuration of the linkage mechanism.
The gage length is calculated during the course of the test as the difference between the initial gage length (Lzi), which is measured to 0.01 mm using vernier calipers during specimen set up, and the axial deflection (h), which is measured by the inclinometer gage:
h L
[image:3.595.305.547.90.326.2] [image:3.595.31.287.309.556.2]The gage length and the distance d are functions of the inclinometer tilt ( ) that occurs in the radial direction (Fig. 4). Hence, an expression can be developed to relate inclinometer radius rincl and the axial deflection (h). The distance from the hinge (point a in Fig. 4) to the outer specimen wall surface is given by:
bf ' ab g ' e ' ae (5)
From trigonometry, the distance d is related to the gage length (Lz) and tilt angle ( by:
Sin B Cos C tan L g ' e d z 2 (6)
An expression can also be developed between gage length Lz and the angle . Referring to Fig. 4:
bc ab
A (7)
Again, from trigonometry, the gage length Lz is related to the angle by:
Sin C Cos A
Lz 2 (8)
In general, the tilt angle can be simply expressed as a function of the gage length Lz by rearranging Eq. (8). The distance d can then be expressed as a function of the gage length Lz alone by substituting this relationship for the tilt angle in Eq. (6).
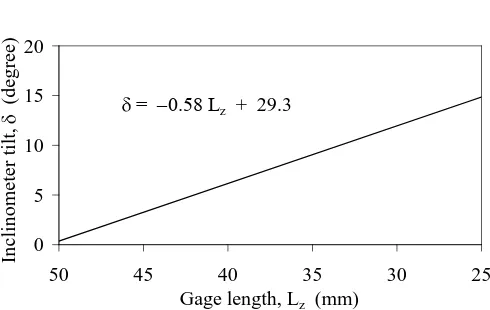
The general equation relating inclinometer radius rincl and the measured distances ro, Lzi and the axial deflection h is obtained by substituting for the distance d in Eq. (3) and expressing the gage length Lz in terms of its initial value (Lzi) and the axial deflection h, Eq. (4). For example, Fig. 5 and Eq. (9) give the relationship between the tilt angle and the gage length (Lz) for the UCD double-axes inclinometers obtained by substituting dimensions A = 25.0 mm and C = 45.0 mm.
3 29 58
0. Lz . (9)
0 5 10 15 20 25 30 35 40 45 50
Gage length, Lz (mm)
In cli n o mete r ti lt , (d eg re e)
[image:4.595.311.556.117.267.2]= –0.58 Lz + 29.34
Figure 5. Relationship between tilt angle and gage length for UCD double–axes inclinometer.
Substituting Eq. (9) back into Eq. (6) and setting B = 50.0 mm and C = 45.0 mm gives the relationship between the distance d and the gage length Lz, (Fig. 6):
9 27 35
0. L .
d z (10)
35 40 45 50 25 30 35 40 45 50
Gage length, Lz (mm)
Dista nc e, d (m m )
[image:4.595.39.284.594.749.2]d = 0.35 Lz + 27.87
Figure 6. Relationship between distance d and gage length for UCD double–axes inclinometer.
Finally, the expression that relates the inclinometer radius rincl and the measured distances ro and the initial gage (Lzi) and axial deflection h of the UCD double axes-inclinometer is obtained by substituting Eqs. (4) and (10) back into Eq. (3):
9 27 35
0. L h .
r
rincl o zi (11)
In the case of the single-axis inclinometer, the operation of the linkage mechanism is such that the single electrolevel capsule (Fig. 2) simply measures the relative twist displacement of the inclinometer attachment points. The distance d from the outer specimen wall surface to the center of the electrolevel capsule remains constant, irrespective of the specimen deformation response. Hence, in this particular case, the inclinometer radius rincl and the outer specimen radius (ro) are simply related by Eq. (3). The distance d was set at 15.0 mm for the UCD single-axis inclinometer.
4 CALIBRATION
The UCD inclinometers were calibrated using an optical table and laser distance measurement system. The optical table allowed set displacements in three orthogonal directions to a resolution of 0.0025 mm. hence, the tilt angle of the electrolevel capsules can be set to a resolution of 0.003 degrees (equivalent to axial and torsional strain resolutions of 1.3 x 10⁻³% and 4.5 x 10⁻³%, respectively).
The output signals from the UCD double-axes inclinometers were linear for pure axial displacement h (Fig. 7a) and for tilt displacement incl within the measurement range of –10o incl 10o, (Fig. 7b).
-30 -20 -10 0 10
-0.8 -0.6 -0.4 -0.2 0
Output (volts)
Ax
ial displac
eme
nt, h (
mm)
(a) Axial displacement alone.
-20 -10 0 10 20
-0.6 -0.4 -0.2 0 0.2 0.4
Output (volts)
Twist,
incl
(degree)
[image:5.595.38.290.47.275.2](b) Tilt displacement alone.
Figure 7. Calibration data for UCD double-axes inclinometer.
The linearity of the calibration data facilitated multi-linear regression analysis of the test data recorded during generalized stress path tests in the UCD HCA (axial and twist deformations of the specimen occurring simultaneously).
The output from the UCD single-axis inclinometer was linear within its central measurement range of –12o incl 7o, (Fig. 8).
-20 -10 0 10 20
-0.06 -0.04 -0.02 0 0.02 0.04 0.06
Output (volts)
Tw
ist
,
incl
(
de
gr
ee
s)
[image:5.595.37.291.551.696.2]Linear range
Figure 8. Calibration data for UCD single-axis inclinometer.
The stability of the inclinometer signals was also assessed and found to be adequate (standard deviation significantly less than 0.5% mean voltage). The output signals were recorded at 5 min intervals
over the 24-hour period before the start of each stress path test. Longer-term stability checks were also carried out.
5 SET UP OF LOCAL INSTRUMENTATION IN
UCD HCA
The development and set up of the UCD HCA has been reported by O’Kelly and Naughton (2003, 2005b). The hollow cylindrical test specimen (50.0 mm in outer radius; 35.5 mm in inner radius and 200 mm in height) is subjected to a system of axial and torsional loads and independently-controlled outer and inner confining pressures.
Local instrumentation comprising inclinometer gages and proximity transducers (O’Kelly and Naughton 2008) allow accurate measurement of the deformation response within the mid-third of the specimen length.
Two axial and three twist deformations of up to 20 mm and 30 degrees, respectively, are recorded around the specimen outer wall surface by three inclinometer gages; namely, two UCD double-axis gages located diametrically apart and a UCD single-axis gage located midway between the double-single-axis gages.
The radial displacements of the inner and outer wall surfaces are measured near the mid-height of the specimen by two proximity transducers (O’Kelly and Naughton 2008). One proximity transducer is located in the outer cell chamber and the second transducer is located directly opposite within the inner bore cavity of the specimen.
A suite of LabVIEW® programs monitor the state of effective stress and the deformation response of the specimen (O’Kelly and Naughton 2005a 2005b;). The local instrumentation interfaces with a computer via a 24-bit data acquisition system for closed-loop control in targeting a generalized stress path. The expressions for the inclinometer radius rincl that have been developed in the present study are readily programmable and were incorporated in the control algorithm (O’Kelly and Naughton 2005a).
The control program automatically corrects for membrane restraint effects (using the corrections developed by Tatsuoka et al. (1986)) and for membrane penetration effects using the technique developed by Sivathayalan and Vaid (1998).
6 STRESS PATH TESTING
The error that arises in using the measured value of the outer specimen radius ro instead of inclinometer radius rincl in calculating the torsional shear strain response using Eq. (2) was assessed for a generalized stress path test carried out in the UCD HCA by O’Kelly and Naughton (2005b).
T
ilt,
T
ilt,
(d
eg
ree
The fully saturated sand specimens (50.0 mm in outer radius, 35.5 mm in inner radius and 200 mm in length) was prepared in the UCD HCA using a wet pluviation technique (O’Kelly and Naughton, 2005c) and densified to an initial void ratio of 80.8% (medium to dense state). The properties of the uniform medium sand material (white Leighton Buzzard sand comprising sub-angular grains) have been reported by O’Kelly and Naughton (2005b, c).
The test specimen was isotropically consolidated to a mean effective confining stress (p’) of 200 kPa, against an applied backpressure of 150 kPa. The specimen was then anisotropically consolidated in four steps, namely:
1) The effective stress ratio (R’) and the intermediate principal stress parameter (b) were linearly increased from R’ = 1.0 to 1.5 and b = 0.0 to 0.5, with p’ remaining fixed at 200 kPa. 2) Next, the orientation of the major principal stress
( ) was smoothly rotated from = 0 to 45o from the vertical direction with the values of p’, R’ and the b parameter remaining fixed.
3) The R’ value was increased again from R’ = 1.5 to 2.5, with the values of p’, the b parameter and
remaining fixed.
4) Finally, the principal stress difference ( 1– 3) was increased by smoothly increasing the torsional shear stress value from 40 kPa (applied at end of step 2 above) to 250 kPa at which point specimen failure occurred.
[image:6.595.39.294.583.727.2]Figure 9 shows the true torsional shear strain response during the shearing stage (step 4 above), which was computed using Eq. (2) and the inclinometer radius rincl value given by Eq. (11) for the UCD double-axes inclinometers. Also plotted in Fig. 9 is the torsional shear strain response computed using the measured outer specimen radius ro values in place of the inclinometer radius rincl values.
Figure 9. z response from UCD double-axes inclinometer measurements during generalized stress path test.
In this example, calculating the torsional shear strain on the basis of the measured radius ro would have overestimated the true value by about 90%, and hence significantly underestimated the shear modulus G value. The error is particularly large due to the relatively small outer specimen radius (initially 50.0 mm) and the relatively large distance d (between the centre of the electrolevel capsules and the outer specimen wall surface) in the UCD HCA setup.
In the case of the single-axis inclinometer, the radius rincl and the outer specimen radius ro are simply related by Eq. (3) with distance d set at 15.0 mm for the UCD single-axis inclinometer. The true torsional shear strain response was overestimated by about 30% using the measured value of radius ro instead of the inclinometer radius rincl in Eq. (2).
In general, the error that would arise in incorrectly using the radius ro values instead of the radius rincl values in Eq. (2) reduces in magnitude as the rincl to ro ratio approaches unity (i.e. test specimens with larger outer specimen radius).
7 SUMMARY AND CONCLUSIONS
Imperial College electrolevel-inclinometer gages were reconfigured (reduced gage length from 120 to 45 mm) to suit the more compact cell chamber and the smaller specimen size in the University College Dublin hollow cylinder apparatus (UCD HCA). Single-axis and double-axes inclinometer configurations accurately measure the axial and twist deformation responses of the specimen over its central uniformly-stressed gage length.
The tilt angle incl of the inclinometers is related to the twist deformation over the specimen height. As noted by Connolly and Kuwano (1999), the tilt angle incl is recorded along an arc length corresponding to the center of the electrolevel capsules, i.e. inclinometer radius rincl.
Equations have been presented to compute the radius rincl, and hence the true torsional shear strain response, based on the measured initial gage length and the outer radius and axial deformation of the specimen. A significant error would arise, particularly for the double-axes gage, in computing the torsional shear strain on the basis of the measured outer specimen radius instead of the inclinometer radius rincl.
The equations take into consideration the size of the specimen and its axial deformation response; the gage length and the articulation of the inclinometer linkages as the specimen deforms under loading.
The accuracy of the inclinometers, which were calibrated using an optical table and laser distance measuring system, allowed measurements in the UCD HCA of the axial and torsional shear strains over the pseudo elastic range.
50 100 150 200 250 300
0 5 10 15 20
Shear strain, z (%)
(
1
-
3
), (kPa)
Based on r incl
Based on r oradius ro
radius rincl
ACKNOWLEDGMENTS
The authors would like to thank Dr. Tom Widdis and Professor Eugene O’Brien (University College Dublin) for their support during the course of this research. The authors would also like to acknowledge the many informative discussions with Steve Ackerley (Imperial College, London).
The first author is grateful for funding received through the Pierse-Newman Scholarship in Civil Engineering at University College Dublin.
REFERENCES
Baldi, G., Hight, D.W., Thomas, G.E. (1988). “A Reevaluation of Conventional Triaxial Test Methods”. Advanced Triaxial Testing of Soils and Rock, ASTM STP977, Philadelphia. Burland, J. B. and Symes, M. (1982). “A Simple Axial
Displacement Gage for Use in the Triaxial Apparatus”, Geotechnique, Vol. 32, No. 1, pp 62–65.
Connolly, T. M. and Kuwano, R. (1999). “The Measurement of Gmax in a Resonant Column, Bender Elements, Torsional Shear Apparatus”, Proceedings of the International Conference on the Pre-failure Deformation Characteristics of Geomaterials, Vol. 1, pp 73–80.
Hight, D. W., Gens, A. and Symes, M. J. (1983). “The Development of a New Hollow Cylinder Apparatus for Investigating the Effects of Principal Stress Rotation in Soils”, Geotechnique, Vol. 33, No. 4, pp 355–383.
Jardine, R. J., Symes, M. J. and Burland, J. B. (1984). “The Measurement of Soil Stiffness in the Triaxial Apparatus”, Geotechnique, Vol. 34, No. 3, pp 323–340.
O’Kelly B. C. and Naughton P. J. (2003). “Development of a New Hollow Cylinder Apparatus for Generalised Stress Path Testing”, Ground Engineering, Vol. 36, No. 7, pp. 26– 28.
O'Kelly, B. C. and Naughton, P. J. (2005a). “Closed Loop Control of a Hollow Cylinder Apparatus”, Proceedings of the Symposium on Innovative Experimental Techniques, ASCE/ASME/SES Conference on Mechanics and Materials, Louisiana, USA.
O’Kelly, B. C. and Naughton, P. J. (2005b). “Development of a New Hollow Cylinder Apparatus for Stress Path Measurements Over a Wide Strain Range”, Geotechnical Testing Journal, Vol. 28, No. 4, pp 345–354.
O’Kelly B. C. and Naughton P. J. (2005c). “Engineering Properties of Wet-pluviated Hollow Cylindrical Specimens”, ASTM Geotechnical Testing Journal, Vol. 28, No. 6, pp. 570–576.
O’Kelly B. C. and Naughton P. J. (2008). “Use of Proximity Transducers for Local Radial Strain Measurements in a Hollow Cylinder Apparatus”, Proceedings of the Fourth International Symposium on Pre-Failure Deformation Characteristics of Geomaterials, Atlanta, Georgia, USA. Sivathayalan, S. and Vaid, Y. P. (1998). “Truly Undrained
Response of Granular Soils with No Membrane Penetration Effects”, Canadian Geotechnical Journal, Vol. 35, pp 730– 739.
Symes, M. J. and Burland, J. B. (1984). “Determination of Local Displacements on Soil Samples”, Geotechnical Testing Journal, Vol. 7, No. 2, pp 49–59.
Tatsuoka, F., Muramatsu, M. and Saski, T. (1983). Closure to “Cyclic Undrained Stress-Strain Behaviour of Dense Sands by Torsional Simple Shear Tests”, Soils and Foundations, Vol. 23, No. 3, pp 142–145.