Toward Abstractive Summarization Using Semantic Representations
Fei Liu Jeffrey Flanigan Sam Thomson Norman Sadeh Noah A. Smith
School of Computer Science Carnegie Mellon University Pittsburgh, PA 15213, USA
{feiliu, jflanigan, sthomson, sadeh, nasmith}@cs.cmu.edu
Abstract
We present a novel abstractive summarization framework that draws on the recent develop-ment of a treebank for the Abstract Meaning Representation (AMR). In this framework, the source text is parsed to a set of AMR graphs, the graphs are transformed into a summary graph, and then text is generated from the summary graph. We focus on the graph-to-graph transformation that reduces the source semantic graph into a summary graph, mak-ing use of an existmak-ing AMR parser and assum-ing the eventual availability of an AMR-to-text generator. The framework is data-driven, trainable, and not specifically designed for a particular domain. Experiments on gold-standard AMR annotations and system parses show promising results. Code is available at: https://github.com/summarization
1 Introduction
Abstractive summarization is an elusive technolog-ical capability in which textual summaries of con-tent are generated de novo. Demand is on the rise for high-quality summaries not just for lengthy texts (e.g., books; Bamman and Smith, 2013) and texts known to be prohibitively difficult for people to un-derstand (e.g., website privacy policies; Sadeh et al., 2013), but also for non-textual media (e.g., videos and image collections; Kim et al., 2014; Kuznetsova et al., 2014; Zhao and Xing, 2014), where extractive and compressive summarization techniques simply do not suffice. We believe that the challenge of ab-stractive summarization deserves renewed attention
and propose that recent developments in semantic analysis have an important role to play.
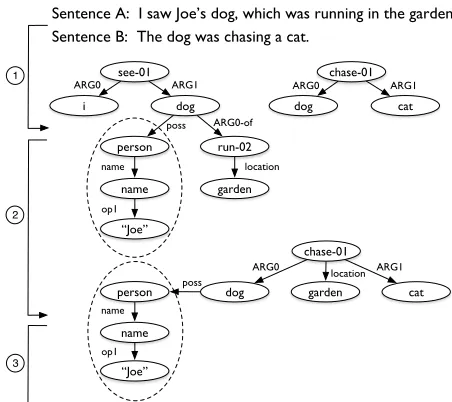
We conduct the first study exploring the feasi-bility of an abstractive summarization system based on transformations of semantic representations such as the Abstract Meaning Representation (AMR; Ba-narescu et al., 2013). Example sentences and their AMR graphs are shown in Fig. 1. AMR has much in common with earlier formalisms (Kasper, 1989; Dorr et al., 1998); today an annotated corpus com-prised of over 20,000 AMR-analyzed English sen-tences (Knight et al., 2014) and an automatic AMR parser (JAMR; Flanigan et al., 2014) are available.
In our framework, summarization consists of three steps illustrated in Fig. 1: (1) parsing the in-put sentences to individual AMR graphs, (2) com-bining and transforming those graphs into a single summary AMR graph, and (3) generating text from the summary graph. This paper focuses on step 2, treating it as a structured prediction problem. We assume text documents as input1and use JAMR for
step 1. We use a simple method to read a bag of words off the summary graph, allowing evaluation with ROUGE-1, and leave full text generation from AMR (step 3) to future work.
The graph summarizer, described in §4, first merges AMR graphs for each input sentence through aconcept mergingstep, in which coreferent nodes of the graphs are merged; asentence conjunctionstep, which connects the root of each sentence’s AMR graph to a dummy “ROOT” node; and an optional
1In principle, the framework could be applied to other
in-puts, such as image collections, if AMR parsers became avail-able for them.
poss location name
ARG1 ARG0
ARG0 ARG1
poss ARG0-of
ARG1
see-01
dog i
“Joe” name
person run-02
chase-01
dog cat
Sentence A: I saw Joe’s dog, which was running in the garden. Sentence B: The dog was chasing a cat.
garden
name
op1
location
Summary: Joe’s dog was chasing a cat in the garden.
dog
chase-01
garden cat
ARG0
“Joe” name person
op1
1
[image:2.612.70.296.62.263.2]3 2
Figure 1: A toy example. Sentences are parsed into indi-vidual AMR graphs in step 1; step 2 conducts graph trans-formation that produces a single summary AMR graph; text is generated from the summary graph in step 3.
graph expansion step, where additional edges are added to create a fully dense graph on the sentence-level. These steps result in a single connectedsource graph. A subset of the nodes and arcs from the source graph are then selected for inclusion in the summary graph. Ideally this is a condensed repre-sentation of the most salient semantic content from the source.
We briefly review AMR and JAMR (§2), then present the dataset used in this paper (§3). The main algorithm is presented in§4, and we discuss our sim-ple generation step in§5. Our experiments (§6) mea-sure the intrinsic quality of the graph transformation algorithm as well as the quality of the terms selected for the summary (using ROUGE-1). We explore variations on the transformation and the learning al-gorithm, and show oracle upper bounds of various kinds.
2 Background: Abstract Meaning Representation and JAMR
AMR provides a whole-sentence semantic repre-sentation, represented as a rooted, directed, acyclic graph (Fig. 1). Nodes of an AMR graph are labeled withconcepts, and edges are labeled withrelations.
Concepts can be English words (“dog”), PropBank event predicates (“chase-01,” “run-02”), or special keywords (“person”). For example, “chase-01” rep-resents a PropBank roleset that corresponds to the first sense of “chase”. According to Banarescu et al. (2013), AMR uses approximately 100 relations. The rolesets and core semantic relations (e.g., ARG0 to ARG5) are adopted from the PropBank annotations in OntoNotes (Hovy et al., 2006). Other semantic re-lations include “location,” “mode,” “name,” “time,” and “topic.” The AMR guidelines2 provide more
detailed descriptions. Banarescu et al. (2013) de-scribe AMR Bank, a 20,341-sentence corpus anno-tated with AMR by experts.
Step 1 of our framework converts input document sentences into AMR graphs. We use a statistical se-mantic parser, JAMR (Flanigan et al., 2014), which was trained on AMR Bank. JAMR’s current perfor-mance on our test dataset is 63%F-score.3 We will
analyze the effect of AMR parsing errors by com-paring JAMR output with gold-standard annotations of input sentences in the experiments (§6).
In addition to predicting AMR graphs for each sentence, JAMR provides alignments between spans of words in the source sentence and fragments of its predicted graph. For example, a graph fragment headed by “date-entity” could be aligned to the to-kens “April 8, 2002.” We use these alignments in our simple text generation module (step 3;§5). 3 Dataset
To build and evaluate our framework, we require a dataset that includes inputs and summaries, each with gold-standard AMR annotations.4 This allows
us to use a statistical model for step 2 (graph summa-rization) and to separate its errors from those in step 1 (AMR parsing), which is important in determining whether this approach is worth further investment.
Fortunately, the “proxy report” section of the AMR Bank (Knight et al., 2014) suits our needs. A
2http://www.isi.edu/˜ulf/amr/help/
amr-guidelines.pdf
3AMR parse quality is evaluated using smatch (Cai and
Knight, 2013), which measures the accuracy of concept and re-lation predictions. JAMR was trained on the in-domain training portion of LDC2014T12 for our experiments.
4Traditional multi-document summarization datasets, such
# Docs. Ave. # Sents.Summ. Doc. Nodes Edges ExpandSource Graph Train 298 1.5 17.5 127 188 2,670 Dev. 35 1.4 19.2 143 220 3,203 Test 33 1.4 20.5 162 255 4,002
Table 1: Statistics of our dataset. “Expand” shows the number of edges after performing graph expansion. The numbers are averaged across all documents in the split. We use the official split, dropping one training document for which no summary sentences were annotated.
proxy report is created by annotators based on a sin-gle newswire article, selected from the English Gi-gaword corpus. The report header contains metadata about date, country, topic, and a short summary. The report body is generated by editing or rewriting the content of the newswire article to approximate the style of an analyst report. Hence this is a single doc-ument summarization task. All sentences are paired with gold-standard AMR annotations. Table 1 pro-vides an overview of our dataset.
4 Graph Summarization
Given AMR graphs for all of the sentences in the in-put (step 1), graph summarization transforms them into a single summary AMR graph (step 2). This is accomplished in two stages: source graph construc-tion (§4.1); and subgraph prediction (§4.2).
4.1 Source Graph Construction
The “source graph” is a single graph constructed us-ing the individual sentences’ AMR graphs by merg-ing identical concepts. In the AMR formalism, an entity or event is canonicalized and represented by a single graph fragment, regardless of how many times it is referred to in the sentence. This princi-ple can be extended to multiprinci-ple sentences, ideally resulting in a source graph with no redundancy. Be-cause repeated mentions of a concept in the input can signal its importance, we will later encode the frequency of mentions as a feature used in subgraph prediction.
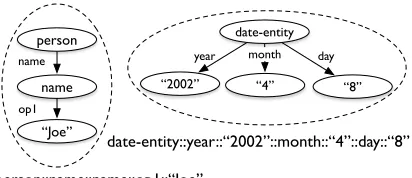
Concept merging involves collapsing certain graph fragments into a single concept, then merging all concepts that have the same label. We collapse the graph fragments that are headed by either a date-entity (“date-date-entity”) or a named date-entity (“name”), if
day year
date-entity
“2002” “4” “8” month
name
“Joe” name person
op1
date-entity::year::“2002”::month::“4”::day::“8”
person::name::name::op1::“Joe”
Figure 2: Graph fragments are collapsed into a single concept and assigned a new concept label.
the fragment is a flat structure. A collapsed named entity is further combined with its parent (e.g., “per-son”) into one concept node if it is the only child of the parent. Two such graph fragments are illus-trated in Fig. 2. We choose named and date entity concepts since they appear frequently, but most of-ten refer to different entities (e.g., “April 8, 2002” vs. “Nov. 17”). No further collapsing is done. A collapsed graph fragment is assigned a new label by concatenating the consisting concept and edge la-bels. Each fragment that is collapsed into a new con-cept node can then only be merged with other iden-tical fragments. This process won’t recognize coref-erent concepts like “Barack Obama” = “Obama” and “say-01” = “report-01,” but future work may incor-porate both entity coreference resolution and event coreference resolution, as concept nodes can repre-sent either.
Due to the concept merging step, a pair of con-cepts may now have multiple labeled edges between them. We merge all such edges between a given pair of concepts into a single unlabeled edge. We remem-ber the two most common labels in such a group, which are used in the edge “Label” feature (Table 3). To ensure that the source graph is connected, we add a new “ROOT” node and connect it to every con-cept that was originally the root of a sentence graph (see Fig. 3). When we apply this procedure to the documents in our dataset (§3), source graphs contain 144 nodes and 221 edges on average.
[image:3.612.79.296.60.122.2]Graph Expansion see-01
dog i
name
person run-02
chase-01
dog cat
garden ROOT
“Joe”
Merging
Collapsing
2 1
[image:4.612.77.300.60.186.2]Sentence A: I saw Joe’s dog, which was running in the garden. Sentence B: The dog was chasing a cat.
Figure 3: A source graph formed from two sentence AMR graphs. Concept collapsing, merging, and graph expansion are demonstrated. Edges are unlabeled. A “ROOT” node is added to ensure connectivity. (1) and (2) are among edges added through the optional expan-sion step, corresponding to sentence- and document-level expansion, respectively. Concept nodes included in the summary graph are shaded.
Summary Edge Coverage (%) Expand Labeled Unlabeled Sent. Doc. Train 64.8 67.0 75.5 84.6 Dev. 77.3 78.6 85.4 91.8 Test 63.0 64.7 75.0 83.3
Table 2: Percentage of summary edges that can be cov-ered by an automatically constructed source graph.
graph (§4.2). In Table 2, columns one and two re-port labeled and unlabeled edge coverage. ‘Unla-beled’ counts edges as matching if both the source and destination concepts have identical labels, but ignores the edge label.
In order to improve edge coverage, we explore expanding the source graph by adding every possi-ble edge between every pair of concepts within the same sentence. We also explored adding every pos-sible edge between every pair of concepts in the en-tire source graph. Edges that are newly introduced during expansion receive a default label ‘null’. We report unlabeled edge coverage in Table 2, columns three and four, respectively. Subgraph prediction became infeasable with the document-level expan-sion, so we conducted our experiments using only sentence-level expansion. Sentence-level graph
ex-pansion increases the average number of edges by a factor of 15, to 3,292. Fig. 3 illustrates the moti-vation. Document-level expansion covers the gold-standard summary edge “chase-01” → “garden,” yet the expansion is computationally prohibitive; sentence-level expansion adds an edge “dog” →
“garden,” which enables the prediction of a struc-ture with similar semantic meaning: “Joe’s dog was in the garden chasing a cat.”
4.2 Subgraph Prediction
We pose the selection of a summary subgraph from the source graph as a structured prediction prob-lem that trades off among including important in-formation without altering its meaning, maintain-ing brevity, and producmaintain-ing fluent language (Nenkova and McKeown, 2011). We incorporate these con-cerns in the form of features and constraints in the statistical model for subgraph selection.
LetG= (V, E)denote the merged source graph, where each node v ∈ V represents a unique con-cept and each directed edge e ∈ E connects two concepts. Gis a connected, directed, node-labeled graph. Edges in this graph are unlabeled, and edge labels are not predicted during subgraph selection. We seek to maximize a score that factorizes over graph nodes and edges that are included in the sum-mary graph. For subgraph(V0, E0):
score(V0, E0;θ,ψ) = X
v∈V0
θ>f(v)+X
e∈E0
ψ>g(e)
(1)
wheref(v)andg(e)are the feature representations of nodevand edgee, respectively. We describe node and edge features in Table 3.θandψare vectors of empirically estimated coefficients in a linear model. We next formulate the selection of the subgraph using integer linear programming (ILP;§4.2.1) and describe supervised learning for the parameters (co-efficients) from a collection of source graphs paired with summary graphs (§4.2.2).
4.2.1 Decoding
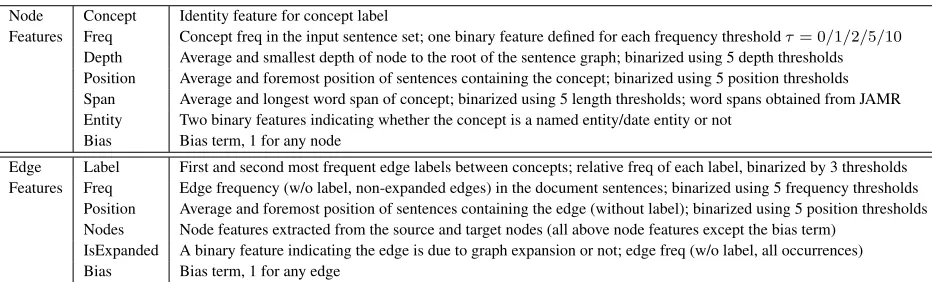
[image:4.612.85.285.340.423.2]Node Concept Identity feature for concept label
Features Freq Concept freq in the input sentence set; one binary feature defined for each frequency thresholdτ= 0/1/2/5/10 Depth Average and smallest depth of node to the root of the sentence graph; binarized using 5 depth thresholds Position Average and foremost position of sentences containing the concept; binarized using 5 position thresholds Span Average and longest word span of concept; binarized using 5 length thresholds; word spans obtained from JAMR Entity Two binary features indicating whether the concept is a named entity/date entity or not
Bias Bias term, 1 for any node
Edge Label First and second most frequent edge labels between concepts; relative freq of each label, binarized by 3 thresholds Features Freq Edge frequency (w/o label, non-expanded edges) in the document sentences; binarized using 5 frequency thresholds
Position Average and foremost position of sentences containing the edge (without label); binarized using 5 position thresholds Nodes Node features extracted from the source and target nodes (all above node features except the bias term)
[image:5.612.73.539.59.200.2]IsExpanded A binary feature indicating the edge is due to graph expansion or not; edge freq (w/o label, all occurrences) Bias Bias term, 1 for any edge
Table 3: Node and edge features (all binarized).
index0. LetN be the number of nodes in the graph. Letvi andei,j be binary variables. viis 1 iff source nodeiis included;ei,jis 1 iff the directed edge from nodeito nodejis included.
The ILP objective to be maximized is Equation 1, rewritten here in the present notation:
N X
i=1
vi θ| {z }>f(i) node score
+ X
(i,j)∈E
ei,jψ| {z }>g(i, j) edge score
(2)
Note that this objective is linear in{vi, ei,j}i,j and that features and coefficients can be folded into node and edge scores and treated as constants during de-coding.
Constraints are required to ensure that the selected nodes and edges form a valid graph. In particular, if an edge(i, j)is selected (ei,j takes value of 1), then both its endpointsi,jmust be included:
vi−ei,j ≥0, vj−ei,j ≥0, ∀i, j≤N (3) Connectivity is enforced using a set of single-commodity flow variables fi,j, each taking a non-negative integral value, representing the flow from nodeitoj. The root node sends out up toNunits of flow, one to reach each included node (Equation 4). Each included node consumes one unit of flow, re-flected as the difference between incoming and out-going flow (Equation 5). Flow may only be sent over an edge if the edge is included (Equation 6).X
i
f0,i− X
i
vi = 0, (4)
X
i
fi,j− X
k
fj,k−vj = 0, ∀j≤N, (5)
N·ei,j−fi,j ≥0, ∀i, j≤N. (6)
The AMR representation allows graph reentran-cies (concept nodes having multiple parents), yet reentrancies are rare; about 5% of edges are re-entrancies in our dataset. In this preliminary study we force the summary graph to be tree-structured, requiring that there is at most one incoming edge for each node:
X
j
ei,j≤1, ∀j≤N. (7)
Interestingly, the formulation so far equates to an ILP for solving the prize-collecting Steiner tree problem (PCST; Segev, 1987), which is known to be NP-complete (Karp, 1972). Our ILP formula-tion is modified from that of Ljubi´c et al. (2006). Flow-based constraints for tree structures have also previously been used in NLP for dependency pars-ing (Martins et al., 2009) and sentence compres-sion (Thadani and McKeown, 2013). In our exper-iments, we use an exact ILP solver,5 though many
approximate methods are available.
Finally, an optional constraint can be used to fix the size of the summary graph (measured by the number of edges) toL:
X
i X
j
ei,j =L (8)
The performance of summarization systems depends strongly on their compression rate, so systems are only directly comparable when their compression rates are similar (Napoles et al., 2011).Lis supplied to the system to control summary graph size.
4.2.2 Parameter Estimation
Given a collection of input and output pairs (here, source graphs and summary graphs), a natural start-ing place for learnstart-ing the coefficients θ and ψ is the structured perceptron (Collins, 2002), which is easy to implement and often performs well. Alterna-tively, incorporating factored cost functions through a structured hinge loss leads to a structured support vector machine (SVM; Taskar et al., 2004) which can be learned with a very similar stochastic opti-mization algorithm. In our scenario, however, the gold-standard summary graph may not actually be a subset of the source graph. In machine transla-tion,ramp losshas been found to work well in situ-ations where the gold-standard output may not even be in the hypothesis space of the model (Gimpel and Smith, 2012). The structured perceptron, hinge, and ramp losses are compared in Table 4.
We explore learning by minimizing each of the perceptron, hinge, and ramp losses, each optimized using Adagrad (Duchi et al., 2011), a stochastic op-timization procedure. Letβbe one model parameter (coefficient fromθorψ). Letg(t)be the
subgradi-ent of the loss on the instance considered on thetth iteration with respect toβ. Given an initial step size
η, the update forβon iterationtis:
β(t+1) ←β(t)−qP η t
τ=1(g(τ))2
g(t) (9)
5 Generation
Generation from AMR-like representations has re-ceived some attention, e.g., by Langkilde and Knight (1998) who described a statistical method. Though we know of work in progress driven by the goal of machine translation using AMR, there is currently no system available.
We therefore use a heuristic approach to gener-ate a bag of words. Given a predicted subgraph, a system summary is created by finding the most fre-quently aligned word span for each concept node. (Recall that the JAMR parser provides these align-ments; §2). The words in the resulting spans are generated in no particular order. While this is not a natural language summary, it is suitable for unigram-based summarization evaluation methods like ROUGE-1.
6 Experiments
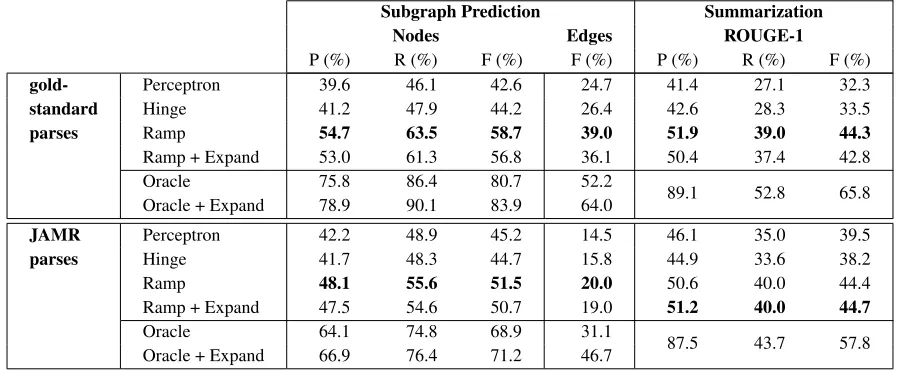
In Table 5, we report the performance of subgraph prediction and end-to-end summarization on the test set, using gold-standard and automatic AMR parses for the input. Gold-standard AMR annotations are used for model training in all conditions. During testing, we apply the trained model to source graphs constructed using either gold-standard or JAMR parses. In all of these experiments, we use the num-ber of edges in the gold-standard summary graph to fix the number of edges in the predicted subgraph, allowing direct comparison across conditions.
Subgraph prediction is evaluated against the gold-standard AMR graphs on summaries. We report pre-cision, recall, andF1for nodes, andF1for edges.6
Oracle results for the subgraph prediction stage are obtained using the ILP decoder to minimize the cost of the output graph, given the gold-standard. We assign wrong nodes and edges a score of −1, correct nodes and edges a score of 0, then decode with the same structural constraints as in subgraph prediction. The resulting graph is the best summary graph in the hypothesis space of our model, and provides an upper bound on performance achiev-able within our framework. Oracle performance on node prediction is in the range of 80% when using gold-standard AMR annotations, and 70% when us-ing JAMR output. Edge prediction has lower perfor-mance, yielding 52.2% for gold-standard and 31.1% for JAMR parses. When graph expansion was ap-plied, the numbers increased to 64% and 46.7%, re-spectively. The uncovered summary edge (i.e., those not covered by source graph) is a major source for low recall values on edge prediction (see Table 2); graph expansion slightly alleviates this issue.
Summarization is evaluated by comparing sys-tem summaries against reference summaries, using ROUGE-1 scores (Lin, 2004)7. System summaries
are generated using the heuristic approach presented in§5: given a predicted subgraph, the approach finds the most frequently aligned word span for each con-cept node, and then puts them together as a bag of words. ROUGE-1 is particularly usefully for
eval-6Precision, recall, and F
1 are equal since the number of
edges is fixed.
7ROUGE version 1.5.5 with options ‘-e data -n 4 -m -2 4 -u
Structured perceptron loss: −score(G∗) + max
G score(G)
Structured hinge loss: −score(G∗) + max
G (score(G) +cost(G;G ∗))
Structured ramp loss: −max
G (score(G)−cost(G;G
∗)) + max
[image:7.612.81.532.186.372.2]G (score(G) +cost(G;G ∗))
Table 4: Loss functions minimized in parameter estimation. G∗denotes the gold-standard summary graph. score(·)
is as defined in Equation 1.cost(G;G∗)penalizes each vertex or edge inG∪G∗\(G∩G∗). Sincecostfactors just
like the scoring function, eachmaxoperation can be accomplished using a variant of ILP decoding (§4.2.1) in which the cost is incorporated into the linear objective while the constraints remain the same.
Subgraph Prediction Summarization
Nodes Edges ROUGE-1
P (%) R (%) F (%) F (%) P (%) R (%) F (%)
gold- Perceptron 39.6 46.1 42.6 24.7 41.4 27.1 32.3
standard Hinge 41.2 47.9 44.2 26.4 42.6 28.3 33.5
parses Ramp 54.7 63.5 58.7 39.0 51.9 39.0 44.3
Ramp + Expand 53.0 61.3 56.8 36.1 50.4 37.4 42.8
Oracle 75.8 86.4 80.7 52.2 89.1 52.8 65.8
Oracle + Expand 78.9 90.1 83.9 64.0
JAMR Perceptron 42.2 48.9 45.2 14.5 46.1 35.0 39.5
parses Hinge 41.7 48.3 44.7 15.8 44.9 33.6 38.2
Ramp 48.1 55.6 51.5 20.0 50.6 40.0 44.4
Ramp + Expand 47.5 54.6 50.7 19.0 51.2 40.0 44.7
Oracle 64.1 74.8 68.9 31.1 87.5 43.7 57.8
Oracle + Expand 66.9 76.4 71.2 46.7
Table 5: Subgraph prediction and summarization (to bag of words) results on test set. Gold-standard AMR annotations are used for model training in all conditions. “+ Expand” means the result is obtained using source graph with expansion; edge performance is measured ignoring labels.
uating such less well-formed summaries, such as those generated from speech transcripts (Liu and Liu, 2013).
Oracle summaries are produced by taking the gold-standard AMR parses of the reference sum-mary, obtaining the most frequently aligned word span for each unique concept node using the JAMR aligner (§2), and then generating a bag of words summary. Evaluation of oracle summaries is per-formed in the same manner as for system sum-maries. The above process does not involve graph expansion, so summarization performance is the same for the two conditions “Oracle” and “Oracle + Expand.”
We find that JAMR parses are a large source of degradation of edge prediction performance, and a smaller but still significant source of degradation for concept prediction. Surprisingly, using JAMR parses leads to slightly improved ROUGE-1 scores. Keep in mind, though, that under our bag-of-words
generator, ROUGE-1 scores only depend on concept prediction and are unaffected by edge prediction. The oracle summarization results, 65.8% and 57.8%
F1 scores for gold-standard and JAMR parses,
re-spectively, further suggest that improved graph sum-marization models (step 2) might benefit from future improvements in AMR parsing (step 1).
Across all conditions and both evaluations, we find that incorporating a cost-aware loss function (hinge vs. perceptron) has little effect, but that us-ing ramp loss leads to substantial gains.
without edge expansion. On the other hand, it in-creases the oracle performance by a large margin. This suggests that with more training data, or a more sophisticated model that is able to better discrimi-nate among the enlarged output space, graph expan-sion still has promise to be helpful.
7 Related and Future Work
According to Dang and Owczarzak (2008), the ma-jority of competitive summarization systems are ex-tractive, selecting representative sentences from in-put documents and concatenating them to form a summary. This is often combined with sentence compression, allowing more sentences to be in-cluded within a budget. ILPs and approximations have been used to encode compression and extrac-tion (McDonald, 2007; Martins and Smith, 2009; Gillick and Favre, 2009; Berg-Kirkpatrick et al., 2011; Almeida and Martins, 2013; Li et al., 2014). Other decoding approaches have included a greedy method exploiting submodularity (Lin and Bilmes, 2010), document reconstruction (He et al., 2012), and graph cuts (Qian and Liu, 2013), among others. Previous work on abstractive summarization has explored user studies that compare extractive with NLG-based abstractive summarization (Carenini and Cheung, 2008). Ganesan et al. (2010) pro-pose to construct summary sentences by repeatedly searching the highest scored graph paths. (Gerani et al., 2014) generate abstractive summaries by modi-fying discourse parse trees. Our work is similar in spirit to Cheung and Penn (2014), which splices and recombines dependency parse trees to produce ab-stractive summaries. In contrast, our work operates on semantic graphs, taking advantage of the recently developed AMR Bank.
Also related to our work are graph-based summa-rization methods (Vanderwende et al., 2004; Erkan and Radev, 2004; Mihalcea and Tarau, 2004). Van-derwende et al. (2004) transform input to logi-cal forms, score nodes using PageRank, and grow the graph from high-value nodes using heuristics. In Erkan and Radev (2004) and Mihalcea and Ta-rau (2004), the graph connects surface terms that co-occur. In both cases, the graphs are constructed based on surface text; it is not a representation of propositional semantics like AMR. However, future
work might explore similar graph-based calculations to contribute features for subgraph selection in our framework.
Our constructed source graph can easily reach ten times or more of the size of a sentence depen-dency graph. Thus more efficient graph decoding algorithms, e.g., based on Lagrangian relaxation or approximate algorithms, may be explored in future work. Other future directions may include jointly performing subgraph and edge label prediction; ex-ploring a full-fledged pipeline that consists of an au-tomatic AMR parser, a graph-to-graph summarizer, and a AMR-to-text generator; and devising an eval-uation metric that is better suited to abstractive sum-marization.
Many domains stand to eventually benefit from summarization. These include books, audio/video segments, and legal texts.
8 Conclusion
We have introduced a statistical abstractive summa-rization framework driven by the Abstract Meaning Representation. The centerpiece of the approach is a structured prediction algorithm that transforms mantic graphs of the input into a single summary se-mantic graph. Experiments show the approach to be promising and suggest directions for future research. Acknowledgments
The authors thank three anonymous reviewers for their insightful input. We are grateful to Nathan Schneider, Kevin Gimpel, Sasha Rush, and the ARK group for valuable discussions. The research was supported by NSF grant SaTC-1330596, DARPA grant FA8750-12-2-0342 funded under the DEFT program, the U. S. Army Research Laboratory and the U. S. Army Research Office under contract/grant number W911NF-10-1-0533, and by IARPA via DoI/NBC contract number D12PC00337. The views and conclusions contained herein are those of the au-thors and should not be interpreted as necessarily representing the official policies or endorsements, either expressed or implied, of the sponsors.
References
de-composition and multi-task learning. InProceedings of ACL.
David Bamman and Noah A. Smith. 2013. New align-ment methods for discriminative book summarization. InarXiv:1305.1319.
Laura Banarescu, Claire Bonial, Shu Cai, Madalina Georgescu, Kira Griffitt, Ulf Hermjakob, Kevin Knight, Philipp Koehn, Martha Palmer, and Nathan Schneider. 2013. Abstract meaning representation for sembanking. InProceedings of Linguistic Annotation Workshop.
Taylor Berg-Kirkpatrick, Dan Gillick, and Dan Klein. 2011. Jointly learning to extract and compress. In
Proceedings of ACL.
Shu Cai and Kevin Knight. 2013. Smatch: an evaluation metric for semantic feature structures. InProceedings of ACL.
Giuseppe Carenini and Jackie Chi Kit Cheung. 2008. Extractive vs. NLG-based abstractive summarization of evaluative text: The effect of corpus controversial-ity. InProceedings of the Fifth International Natural Language Generation Conference (INLG).
Jackie Chi Kit Cheung and Gerald Penn. 2014. Unsu-pervised sentence enhancement for automatic summa-rization. InProceedings of EMNLP.
Michael Collins. 2002. Discriminative training meth-ods for hidden Markov models: Theory and experi-ments with perceptron algorithms. InProceedings of EMNLP.
Hoa Trang Dang and Karolina Owczarzak. 2008. Overview of the TAC 2008 update summarization task. InProceedings of Text Analysis Conference (TAC). Bonnie Dorr, Nizar Habash, and David Traum. 1998.
A thematic hierarchy for efficient generation from lexical-conceptual structure. In David Farwell, Lau-rie Gerber, and Eduard Hovy, editors,Machine Trans-lation and the Information Soup: Proceedings of the Third Conference of the Association for Machine Translation in the Americas, Lecture Notes in Com-puter Science. Springer.
John Duchi, Elad Hazan, and Yoram Singer. 2011. Adaptive subgradient methods for online learning and stochastic optimization. Journal of Machine Learning Research.
G¨unes Erkan and Dragomir R. Radev. 2004. LexRank: Graph-based lexical centrality as salience in text sum-marization. Journal of Artificial Intelligence Re-search.
Jeffrey Flanigan, Sam Thomson, Jaime Carbonell, Chris Dyer, and Noah A. Smith. 2014. A discriminative graph-based parser for the abstract meaning represen-tation. InProceedings of ACL.
Kavita Ganesan, ChengXiang Zhai, and Jiawei Han. 2010. Opinosis: A graph-based approach to abstrac-tive summarization of highly redundant opinions. In
Proceedings of COLING.
Shima Gerani, Yashar Mehdad, Giuseppe Carenini, Ray-mond T. Ng, and Bita Nejat. 2014. Abstractive sum-marization of product reviews using discourse struc-ture. InProceedings of EMNLP.
Dan Gillick and Benoit Favre. 2009. A scalable global model for summarization. In Proceedings of the NAACL Workshop on Integer Linear Programming for Natural Langauge Processing.
Kevin Gimpel and Noah A. Smith. 2012. Structured ramp loss minimization for machine translation. In
Proceedings of NAACL-HLT.
Zhanying He, Chun Chen, Jiajun Bu, Can Wang, Lijun Zhang, Deng Cai, and Xiaofei He. 2012. Document summarization based on data reconstruction. In Pro-ceedings of AAAI.
Eduard Hovy, Mitchell Marcus, Martha Palmer, Lance Ramshaw, and Ralph Weischedel. 2006. OntoNotes: The 90% solution. InProceedings of NAACL. Richard M. Karp. 1972. Reducibility Among
Combina-torial Problems. InComplexity of Computer Compu-tations, pages 85–103. Springer US.
Robert T. Kasper. 1989. A flexible interface for linking applications to Penman’s sentence generator. In Pro-ceedings of the DARPA Speech and Natural Language Workshop.
Gunhee Kim, Leonid Sigal, and Eric P. Xing. 2014. Joint summarization of large-scale collections of web im-ages and videos for storyline reconstruction. In Pro-ceedings of CVPR.
Kevin Knight, Laura Baranescu, Claire Bonial, Madalina Georgescu, Kira Griffitt, Ulf Hermjakob, Daniel Marcu, Martha Palmer, and Nathan Schneider. 2014. Abstract meaning representation (AMR) annotation release 1.0 LDC2014T12. Web Download. Philadel-phia: Linguistic Data Consortium.
Polina Kuznetsova, Vicente Ordonez, Tamara L. Berg, and Yejin Choi. 2014. TREETALK: Composition and compression of trees for image descriptions. Transac-tions of ACL.
Irene Langkilde and Kevin Knight. 1998. Generation that exploits corpus-based statistical knowledge. In
Proceedings of COLING.
Chen Li, Yang Liu, Fei Liu, Lin Zhao, and Fuliang Weng. 2014. Improving multi-documents summarization by sentence compression based on expanded constituent parse tree. InProceedings of EMNLP.
Chin-Yew Lin. 2004. ROUGE: a package for auto-matic evaluation of summaries. InProceedings of ACL Workshop on Text Summarization Branches Out. Fei Liu and Yang Liu. 2013. Towards abstractive speech
summarization: Exploring unsupervised and super-vised approaches for spoken utterance compression.
IEEE Transactions on Audio, Speech, and Language Processing.
Ivana Ljubi´c, Ren´e Weiskircher, Ulrich Pferschy, Gun-nar W. Klau, Petra Mutzel, and Matteo Fischetti. 2006. An Algorithmic Framework for the Exact Solution of the Prize-Collecting Steiner Tree Problem. In Mathe-matical Progamming, Series B.
Andre F. T. Martins and Noah A. Smith. 2009. Summa-rization with a joint model for sentence extraction and compression. In Proceedings of the ACL Workshop on Integer Linear Programming for Natural Language Processing.
Andre F. T. Martins, Noah A. Smith, and Eric P. Xing. 2009. Concise integer linear programming formula-tions for dependency parsing. InProceedings of ACL. Ryan McDonald. 2007. A study of global inference al-gorithms in multi-document summarization. In Pro-ceedings of ECIR.
Rada Mihalcea and Paul Tarau. 2004. TextRank: Bring-ing order into text. InProceedings of EMNLP. Courtney Napoles, Benjamin Van Durme, and Chris
Callison-Burch. 2011. Evaluating Sentence Com-pression: Pitfalls and Suggested Remedies. In Pro-ceedings of the Workshop on Monolingual Text-To-Text Generation, MTTG ’11, pages 91–97, Stroudsburg, PA, USA. Association for Computational Linguistics. Ani Nenkova and Kathleen McKeown. 2011. Automatic
summarization. Foundations and Trends in Informa-tion Retrieval.
Xian Qian and Yang Liu. 2013. Fast joint compression and summarization via graph cuts. InProceedings of EMNLP.
Norman Sadeh, Alessandro Acquisti, Travis D. Breaux, Lorrie Faith Cranor, Aleecia M. McDonald, Joel R. Reidenberg, Noah A. Smith, Fei Liu, N. Cameron Russell, Florian Schaub, and Shomir Wilson. 2013. The usable privacy policy project. Technical Report, CMU-ISR-13-119, Carnegie Mellon University. Arie Segev. 1987. The Node-Weighted Steiner Tree
Problem. Networks, 17(1):1–17.
Ben Taskar, Carlos Guestrin, and Daphne Koller. 2004. Max-margin Markov networks. InAdvances in Neural Information Processing Systems 16.
Kapil Thadani and Kathleen McKeown. 2013. Sentence compression with joint structural inference. In Pro-ceedings of CoNLL.
Lucy Vanderwende, Michele Banko, , and Arul Menezes. 2004. Event-centric summary generation. In Proceed-ings of DUC.