Neutron and X-ray diffraction and empirical potential structure
re
fi
nement modelling of magnesium stabilised amorphous calcium
carbonate
G. Cobourne
a, G. Mountjoy
a,⁎
, J.D. Rodriguez-Blanco
b,c, L.G. Benning
b, A.C. Hannon
d, J.R. Plaisier
eaSchool of Physical Sciences, University of Kent, Ingram Building, Canterbury CT2 7NH, UK b
School of Earth and Environment, University of Leeds, Leeds LS2, 9JT, UK
c
Department of Chemistry, University of Copenhagen, Universitetsparken 5, 2300 Copenhagen, Denmark
d
ISIS Facility, Rutherford Appleton Laboratory, Chilton, Didcot OX11 0QX, UK
e
Elettra Sincrotrone Trieste S.C.p.A., Strada Statale 14, km 163.5, 34149 Basovizza, Ts Italy
a b s t r a c t
a r t i c l e i n f o
Article history:
Received 3 October 2013
Received in revised form 15 December 2013 Available online xxxx
Keywords:
Amorphous calcium carbonate; EPSR modelling;
Neutron diffraction; X-ray diffraction
Amorphous calcium carbonate (ACC) plays a key role in biomineralisation processes in sea organisms. Neutron and X-ray diffraction have been performed for a sample of magnesium-stabilised ACC, which was prepared with a Mg:Ca ratio of 0.05:1 and 0.25 H2O molecules per molecule of CO3. The empirical potential structure
refinement method has been used to make a model of magnesium-stabilised ACC and the results revealed a fair agreement with the experimental diffraction data. The model has well-defined CO3and H2O molecules.
The average coordination number of Ca is 7.4 and is composed of 6.8 oxygen atoms from CO3molecules and
0.6 oxygen atoms from H2O molecules. The average Ca\O bond length is 2.40 Å. The distribution of Ca in the
model is homogeneous with a uniformly distributed Ca-rich network and no evidence of the Ca-poor channels as previously reported for a reverse Monte Carlo model of ACC.
© 2013 Elsevier B.V. All rights reserved.
1. Introduction
Amorphous calcium carbonate (ACC) is believed to play a key role in biomineralisation processes within organisms, including sea urchins, crustaceans and sea shells (Bivalvia)[1], which use the crystalline calci-um carbonate(s) as structural building blocks. Most notably, ACC has been proposed to be the form of calcium carbonate prior to its crystallisation to aragonite or calcite to form new structural elements of the organism[1]. ACC may thus have an analogous role to the mam-malian equivalent, amorphous calcium phosphate (ACP), which is in-volved in biomineralisation of crystalline calcium phosphates within human bones[2].
Greater understanding of biomineralisation processes should in-clude detailed knowledge of the atomic structure of all calcium carbon-ate phases, including ACC, and of the mechanisms and pathways of crystallisation of ACC in biomineralisation processes, as well as the rela-tion between ACC and the structures of crystalline calcium carbonate phases. The composition of ACC has been reported as CaCO3.nH2O
where n = 1–1.6[3–6]. The variation in water content, n, is related to the process by which ACC is obtained from a calcium source and two
common reactants for carbonate ions are CO2 gas molecules and
carbonate ions in solution. Furthermore, ACC water content depends on the presence of impurities and on ageing. It is known that ACC dehy-drates with time before transforming to crystalline CaCO3, and that this
dehydration is faster with increasing temperature and slower with in-creasing Mg content[4,7–9]. The composition of ACC phases is thus sim-ilar to that of monohydrocalcite CaCO3· H2O. At ambient temperature,
pure ACC is less stable than any of the crystalline polymorphs of calcium carbonate CaCO3(i.e. calcite, aragonite, vaterite, monohydrocalcite and
ikaite) and rapidly crystallises upon dehydration, typically within 2 min in aqueous solution and in less than 1 day at room temperature in air, to either vaterite or calcite[8–10](the crystallisation to aragonite does not occur at ambient temperatures in a pure system).
Although the term amorphous calcium carbonate has been used for approximately a century[11]it remains to be presented a comprehen-sive set of structural data and corresponding structural model for an ACC phase. Structural characterisation of ACC using infrared and Raman spectroscopy are frequently reported[e.g. 12,13]but are difficult to interpret in terms of disordered atomic structures. X-ray absorption spectroscopy has provided the most direct probe of Ca in ACC phases, and a Ca\O bond length of 2.40 Å and a Ca\O coordination number of approximately 6 is typically reported[14]. A key experimental tech-nique for studying the atomic structure of amorphous materials is dif-fraction over a large angular range of scattering sufficient to obtain information about the pair distribution function[15]. However, such diffraction studies of ACC have been limited due to its inherent Journal of Non-Crystalline Solids xxx (2013) xxx–xxx
⁎ Corresponding author. Tel.: +44 1227 823228; fax: +44 1227 827558.
E-mail address:[email protected](G. Mountjoy).
0022-3093/$–see front matter © 2013 Elsevier B.V. All rights reserved.
http://dx.doi.org/10.1016/j.jnoncrysol.2013.12.023
Contents lists available atScienceDirect
Journal of Non-Crystalline Solids
instability. Notably there was a high energy X-ray diffraction study of two types of ACC reported by Michel et al. in 2008[3]that was used for reverse Monte Carlo (RMC) modelling by Goodwin et al. in 2010
[16]. The RMC study reported that the same results were obtained for two different starting configurations: a disordered monohydrocalcite model (i.e. n = 1), and a random model containing the same molecular units. The RMC model obtained for ACC was reported to have a calcium rich network (referring to Ca\O\Ca linkages) and Ca-poor channels (regions more than 4 Å away from a calcium atom). In addition, a recent study of the structure of ACC[17]combined43Ca NMR measurements
and molecular dynamics (MD) modelling and used the Goodwin et al. (2010) model as a starting point, and found that the rich and Ca-poor channels proposed by Goodwin et al. (2010) undergo“significant structural reorganization”and“shrink in size”during the 2 ns MD simulation.
One way to facilitate diffraction studies is to work with more stable forms of ACC, which allow more time consuming experiments to be performed, particularly neutron diffraction. The use of both neutron and X-ray diffraction provides important complementary information due to the different atomic scattering for neutrons and X-rays. It has been reported that ACC can be stabilised with various additives such as magnesium[18–20,25], phosphate[19], and poly(aspartic acid)
[19]. The present study is focused on Mg-stabilised ACC. The addition of a very small amount of magnesium greatly increases the lifetime of ACC. The most likely cause is the high dehydration energy of the Mg2+-aquo ion compared to the Ca2+ion[21]that would slow down
the dehydration dynamics of ACC[20]. Another benefit of adding mag-nesium is the smaller size of the Mg ion compared to other ions and thus the Mg ions should have a minor effect on the structure of“pure” ACC. The use of Mg stabilised ACC has made it possible to measure neu-tron and X-ray diffraction data which are reported here for thefirst time.
Modelling of diffraction data is also a key technique in the study of amorphous materials. The empirical potential structure refinement (EPSR) method[22]was specifically developed for modelling the struc-ture of molecular liquids[23], but it is also applicable to amorphous solids with molecular units, such as ACC. The EPSR method has some similar features to RMC[24]. EPSR is similar to RMC in that it uses a Monte Carlo method which samples different structures against an “acceptance”criterion, but unlike RMC, the acceptance criteria is the energy minimum based on the inter-atomic potentials. EPSR is like RMC in using the diffraction data to guide the modelling process, but unlike RMC, the difference between the simulated and experimental diffraction is used to adjust the inter-atomic potential. The present study reports a new EPSR model of Mg-stabilised ACC. Some features of this model are found to be different to the previously reported RMC model of ACC[16].
2. Method
2.1. Sample preparation
Magnesium stabilised ACC (Mg-ACC) was synthesised using the fol-lowing method based on Rodriguez-Blanco et al.[25]and Jiang et al.
[18]. 100 mM solutions of CaCl2and Na2CO3were prepared. 1 mL of a
500 mM solution of MgCl2was added to 5 mL of the CaCl2solution
and this was then rapidly mixed with 5 mL of the Na2CO3solution (to
give an ion ratio of 1:1:1 Ca:Mg:CO3). This mixing produced a white
pre-cipitate which was then rapidlyfiltered and washed with isopropanol and dried inflowing air[25].
The precipitate was found to have a Mg:Ca ratio of 0.05:0.95 as determined by X-rayfluorescence. The precipitate was further dried and heat-treated for 1 h at 150 °C to reduce the water content. Thermo-gravimetric and differential thermal analyses showed weight losses of 18% and 21% up to temperatures of 150 °C and 350 °C respectively, the latter being when calcite crystallises. These weight losses are
consistent with a water content of n = 1.45 before and n = 0.25 after heat treatment at 150 °C. This reduction of water content is important for neutron diffraction because it reduces the detrimental effects of inelastic and incoherent scattering from protons. The heat-treated sam-ple, denoted Mg-ACC, was confirmed amorphous by lab-based powder X-ray diffraction and to remain amorphous for a period of at least two weeks. The density of Mg-ACC after heat treatment was measured to be 2.19 g/cm3using a He pycnometer. Note that the above parameters
differ from the parameters n = 1.0 and density of 2.43 g/cm3reported for ACC in Ref.[16], which were taken to be equal to those in crystalline monohydrocalcite.
2.2. Neutron diffraction
Neutron diffraction data were measured using the Small Angle Neu-tron Diffractometer for Liquids and Amorphous Samples (SANDALS)
[26]at the ISIS pulsed neutron source, UK. The sample was produced 24 h before measurement and sealed until it was loaded into aflat plate sample holder with 25 micron thick vanadium plates that were 4 mm apart. The sample holder was sealed and maintained at a temper-ature of 5 °C during the experiment. Time-of-flight data were collected over a wide range of momentum transfer, Q, with a useful maximum of 30 Å−1(where Q = 4πsinθ/λ). Experimental corrections of the data
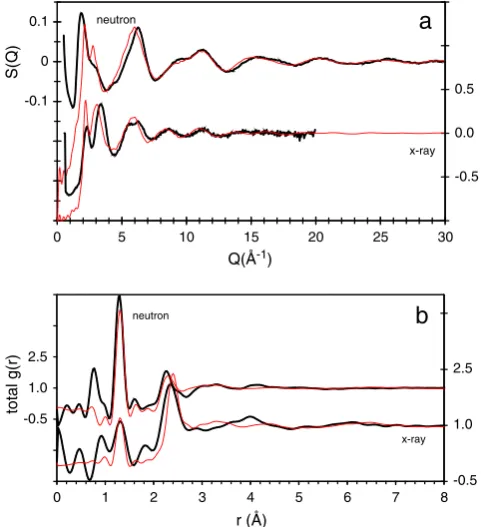
were performed using the Gudrun program[27]. The SANDALS diffrac-tometer has a forward scattering geometry, which helps reduce the severity of the inelasticity correction, which can be problematic for sam-ples containing hydrogen[26]. There remained a background contribu-tion due to inelastic scattering from H, and this is removed by EPSR (using a back Fourier transform of the part of the real space data in the region rb1.5 Å). The structure factor S(Q) from neutron diffraction is shown inFig. 1, including a factor ofb2(wherebis the average
coher-ent neutron scattering length).
-0.5 0.0 0.5 -0.1
0 0.1
S(Q)
Q(Å-1) neutron
x-ray
a
-0.5 1.0 2.5
-0.5 1.0 2.5
0 5 10 15 20 25 30
0 1 2 3 4 5 6 7 8
total g(r)
r (Å)
x-ray
[image:2.595.306.547.419.683.2]neutron
b
Fig. 1.(a) Experimental structure factors S(Q) of Mg-stabilised ACC (black lines) for neutron and X-ray diffraction together with the simulated functions (red lines) for the EPSR model (note S(Q) for neutron diffraction includes the factorb2in barns
2.3. X-ray diffraction
X-ray diffraction data were collected at the MCX beamline[28]at the ELETTRA synchrotron, Italy, using a wavelength ofλ= 0.620 Å. The sample was produced 2 days before travelling to the synchrotron and sealed until it was loaded into a 10-micron thick 1.0 mm diameter boro-silicate glass capillary. The capillary was rotated at 180 rpm during the experiment. X-ray diffraction data were collected up to 2θof 162° or Q = 20 Å−1. The processing of the raw data included corrections for the background scattering, polarization, sample thickness, absorption, capillary, Compton scattering, and the sharpening function (equal to the square of the average form factor per atom)[15]. The structure factor S(Q) from X-ray diffraction is shown inFig. 1.
2.4. Empirical potential structural refinement modelling
Empirical potential structure refinement (EPSR)[22,29]is a suitable method for generating and refining models of amorphous structures based on molecular units. The present study used the EPSR18 package. Structurally realistic molecular units were initially constructed using GHEMICAL4.0 software[30]. A cubic box with length L = 39.55 Å con-taining 950 Ca, 50 Mg, 1000 CO3and 250 H2O units (total 5750 atoms)
was assembled using the EPSR shell. This model corresponds to the measured density for Mg-ACC of 2.19 g/cm3. The density and H
2O
content was based on experimental data as discussed inSection 2.1, and the effect on EPSR results of varying these parameters was not explored. The molecules were randomly translated so they move apart throughout the box. To further separate the molecules, the molecules were randomly rotated and translated 10,000 times.
The EPSR procedure initially relaxed the random starting confi gura-tion to an energy minimised structure using a simulated annealing ap-proach with a sequence of temperatures: 10,000 K, 5000 K, 1000 K, 500 K and 300 K. At each temperature EPSR carries out Monte Carlo sampling of structures until reaching an equilibrium minimum energy. Starting inter-molecular potentials for each inter-atomic pair correla-tion i–j were generated by EPSR using built-in parameters for Lennard–Jones potentials for each pair of elements. Coulomb interac-tions are included with formal charges for ions.
The potential refinement was then implemented within the EPSR. The difference between the simulated and experimental neutron and X-ray diffraction data are used to adjust the inter-atomic potentials. The comparison between simulation and experiment is carried out using the structure factors S(Q) (seeFig. 1). The adjusted potentials are then used for a new Monte Carlo sample of structures until reaching equilibrium minimum energy. This process was iterated 20,000 times.
3. Results
Thefinal level of agreement obtained between simulated and exper-imental diffraction data is shown inFig. 1. The model obtained is shown inFig. 2. The partial pair distribution functions (PDFs) gij(r) have been
calculated from the model. Fig. 3 shows the PDFs involving CO3
and H2O molecules respectively. The continuous lines show
intra-molecular correlations, and the dashed lines show inter-intra-molecular cor-relations. Thefirst four peaks in the intra-molecular PDFs (solid lines) represent the internal structure of the molecules: O\H and H\H distances in H2O, and C\O and O\O distances in CO3. The
inter-molecular PDFs (dashed lines) show H…H and H…O correlations be-tween H2O (light dashed), and C…O and O…O correlations between
all molecules (heavy dashed). These correlations and their peak dis-tances are summarised inTable 1.
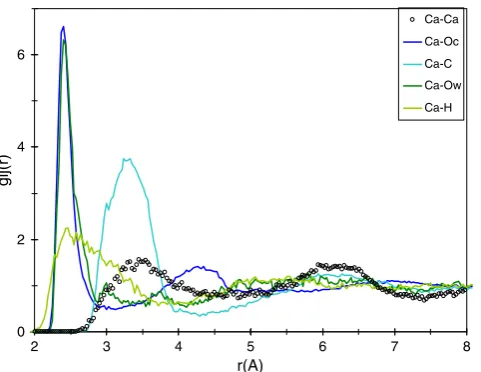
Fig. 4shows the PDFs involving Ca. Most prominent are the Ca\O distances due to Ca bonding to the oxygen atoms which are present in CO3and H2O molecules, where the peak distance is 2.40 Å. The derived
average coordination number of Ca is 7.4 which is composed of 6.8 oxygen atoms from CO3molecules and 0.6 oxygen atoms from H2O
molecules. These features of the model are in good agreement with the EXAFS results of Michel et al.[3]for ACC prepared by a similar meth-od: Ca\O coordination number of 6.7 ± 1.7 and peak distance of 2.41 ± 0.02 Å. Due to the coordination of Ca to oxygen in CO3and
H2O molecules, there are consequently noticeable correlations of Ca…
C and Ca…H. The PDFs for Mg are similar to those for Ca, but they are not presented in detail because of the poor statistics due to the small number of Mg in the model.
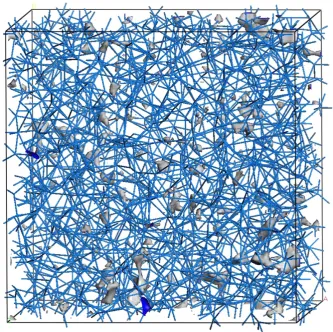
Thefirst peak at 3.3–4.5 Å in the Ca\Ca PDF (seeFig. 4) corresponds to two calcium ions which share bonds with a common oxygen, i.e. Ca−
[image:3.595.318.555.52.297.2]O−Ca.Fig. 5shows these Ca\O\Ca configurations as single blue lines originating from and terminating at the positions of Ca ions. This feature Fig. 2.EPSR model of Mg-stabilised ACC containing 5750 atoms with box length of 39.55 Å (oxygen is red, carbon is grey, hydrogen is white, calcium is blue, magnesium is green). (For interpretation of the references to colour in thisfigure legend, the reader is referred to the web version of this article.)
0 5
0.5 1.5 2.5 3.5 4.5
gij
(r)
r(A)
H-O (÷20) H-O C-O (÷5) C-O H-H (÷3) H-H
O-O O-O
[image:3.595.318.554.505.690.2]C-H C-C
Fig. 3.Pair distribution functions (PDFs) gij(r) for Mg-stabilised ACC from the EPSR model.
Intra-molecular PDFs (solid lines) represent the internal structure of the molecules: O\H and H\H distances in H2O, and C\O and O\O distances in CO3. Inter-molecular PDFs
(dashed lines) show H…H and H…O correlations between H2O (light dashed), and C…O
of the structure was previously referred to as the“Ca-rich network”[16], andFig. 5indicates that such a“Ca rich network”is homogeneously distributed throughout the present model. The grey surfaces around re-gions more than 3.3 Å distant from Ca represent the structural feature which was previously referred to as“Ca-poor channels”[16].Fig. 5
shows that there are only a few marginal volumesfitting this criterion. In the previous study[16]a less stringent limit of 4 Å was used and the present model has no such volumes.
4. Discussion
This study uses both neutron and X-ray diffraction data as a more stringent test of simulation than previous studies (e.g.[16]). Note that the two techniques employed have different sensitivity to inter-atomic correlations, due to the different inter-atomic scattering factors for neutrons and X-rays. In particular, neutrons are more sensitive to oxy-gen and hydrooxy-gen, whereas X-rays are more sensitive to calcium. The
final level of agreement obtained is shown inFig. 1. In terms of the struc-ture factor S(Q), there is fair quantitative agreement for QN4 Å−1
corresponding to short range order, and fair qualitative agreement 1bQb4 Å−1corresponding to medium range order. In terms of the
total pair distribution function g(r), there is fair quantitative agreement in short range order up to 3 Å.
The EPSR method has been successful at incorporating well-defined CO3and H2O molecular units with the expected intra-molecular
corre-lations. The inter-molecular correlations (seeTable 1) include H…O and O…O peaks due to hydrogen bonding of H2O molecules, although
the peak distances are slightly shorter than expected for typical H…O
hydrogen bond lengths of 1.6–2.0 Å. H2O molecules are outnumbered
4 to 1 by CO3molecules, so the presence of hydrogen bonding would
suggest a tendency for H2O molecules to be found near to one another.
This is thefirst model to be reported for Mg-stabilised ACC, and the
first model of any kind of ACC to be compared with experimental neu-tron diffraction data. The Ca\O coordination is composed of relative contributions of CO3and H2O of 6.8 and 0.6 respectively. These are in
the ratio of 12:1. In comparison the available oxygens are 3 per CO3
mol-ecule and 1 per H2O molecule, and these molecules are in a ratio of 4:1.
Thus, the available oxygen from CO3and H2O molecules are in the ratio
of 12:1, the same ratio as observed in the contributions to Ca\O coordi-nation. The average Ca…C coordination number is 6.6 which is almost the same as the average number, 6.8, of Ca bonds to oxygen in CO3
mol-ecules. This means that on average each carbonate oxygen which is bonded to calcium is from a separate carbonate molecule. The number of Ca bonds to carbonate oxygens is 6.8 times the number of Ca in the model. Since the ratio of Ca to carbonate oxygen in the model is 1:3, this means that the number of carbonate oxygen bonds to Ca is 6.8 divided by 3 or 2.2. So each O in a CO3unit is typically bonded to 2
dif-ferent Ca neighbours, i.e. Ca\O\Ca linkages are common.
The present EPSR model of Mg-ACC has Mg:Ca ratio of 0.05:0.95 and a water content of n = 0.25. This is a somewhat different composition to the previously reported RMC model of ACC, which had no Mg and n = 1.0[16]. Nevertheless, it is interesting to compare the Ca distribu-tion in these two models. The previously reported RMC model of ACC had a“Ca-rich network”(based on Ca\O\Ca linkages), which was inhomogeneously distributed, and interspersed with significant vol-umes of“Ca-poor channels”(based on the limit of volumes more than 4 Å distant from Ca). The homogeneous Ca distribution in the present EPSR model of Mg-ACC fails to reproduce the inhomogeneous features in the previously reported RMC model of ACC.
In the present study, the proton content of the sample was reduced by using heat treatment. An alternative approach is to deuterate the sample by substituting protons for deuteriums, D, which has the benefits of reducing incoherent and inelastic scattering, and providing scattering contrast due to the different neutron scattering length for D compared to protons. In the present study, an unsuccessful attempt was made to produce a deuterated ACC sample, but the authors plan to attempt this again in future work.
5. Conclusions
Preparation of Mg-stabilised ACC has enabled thefirst neutron dif-fraction measurement of Mg-stabilised ACC. The EPSR modelling meth-od has used this neutron diffraction data, together with X-ray diffraction data, to build a model of Mg-stabilised ACC, which is in fair agreement with the experimental diffraction data. The model contains the expect-ed molecular units of CO3and H2O with some hydrogen bonding of H2O.
Calcium has an average coordination of 7.4, with a peak distance of 2.40 Å, in agreement with previously reported EXAFS results[3]. The Ca coordination is comprised of approximately 6.7 oxygens from sepa-rate CO3molecules, and Ca\O\Ca linkages are prevalent throughout
the structure. The Ca distribution is homogeneous and does not show the inhomogeneous characteristics which were previously reported for an RMC model of ACC[16].
Acknowledgements
[image:4.595.32.287.86.172.2]We gratefully acknowledge O.L.G. Alderman, University of Warwick, for assistance with the EPSR method. Beamtime awards from ISIS and ELETTRA facilities are gratefully acknowledged. Funding for JDRB and LGB from the Marie Curie EU-FP6 Mineral Nucleation and Growth Kinet-ics (MIN-GRO) Research and Training Network under contract MRTNCT-2006-035488 is gratefully acknowledged.
Table 1
Inter-atomic correlations involving CO3and H2O molecular units (distances shown in
brackets are approximate, and the corresponding correlation is also shown in brackets).
Distance (Å) Atoms types i–j Type of correlation between molecular units
0.93 and (1.2)⁎ H\O Intra and (inter)⁎H2O
1.32 C\O Intra CO3
1.56 and (1.9)⁎ H\H Intra and (inter)⁎H2O
2.22 O\O Intra CO3
(2.4) C\H Inter CO3and H2O
(2.8) O\O Inter CO3and H2O
(3.3) C\O Inter CO3and H2O
(3.5) C\C Inter CO3
⁎ Denotes correlations involving hydrogen bonding as discussed in the text.
0 2 4 6
2 3 4 5 6 7 8
r(A)
Ca-Ca
Ca-Oc
Ca-C
Ca-Ow
Ca-H
gij(r)
Fig. 4.Pair distribution functions (PDFs) gij(r) for Mg-stabilised ACC from the EPSR
model. PDFs involving calcium are shown (note Oc and Ow refer to oxygens in CO3and
[image:4.595.42.283.523.709.2]References
[1] L. Addadi, S. Raz, S. Weiner, Adv. Mater. 15 (2003) 959.
[2] C. Combes, C. Rey, Acta Biomat. 6 (2010) 3362.
[3] F.M. Michel, J. MacDonald, J. Feng, B.L. Phillips, L. Ehm, C. Tarabrella, J.B. Parise, R.J. Reeder, Chem. Mater. 20 (2008) 4720.
[4] A.V. Radha, T.Z. Forbes, C.E. Killian, P.U.P.A. Gilbert, A. Navrotskya, Proc. Nat. Acad. Sci 107 (2010) 16438.
[5] K. Kojima, A. Kawanobe, T. Yasue, Y. Arai, J. Cer. Soc. Jpn. 101 (1993) 1145.
[6] N. Koga, Y. Nakagoe, H. Tanaka, Thermochim. Acta 318 (1998) 239.
[7] P. Raiteri, J.D. Gale, J. Am. Chem. Soc. 132 (2010) 17623.
[8] J.D. Rodriguez-Blanco, S. Shaw, L.G. Benning, Nanoscale 3 (2011) 265.
[9] J.D. Rodriguez-Blanco, P. Bots, T. Roncal-Herrero, S. Shaw, L.G. Benning, J. Alloys Comp. 536 (2012) S477.
[10] E. Loste, R.J. Park, J. Warren, F.C. Meldrum, Adv. Funct. Mater. 14 (2004) 1211.
[11] J. Johnson, H.E. Merwin, E.D. Williamson, Am. J. Sci. 111 (1916) 33.
[12] F.A. Andersen, L. Brecevic, Acta Chem. Scand. 45 (1991) 1018.
[13] D. Wang, L.M. Hamm, R.J. Bodnar, P.M. Dove, J. Raman, Spectrosc. 43 (2012) 543.
[14] C. Günther, A. Becker, G. Wolf, M. Epple, Z. Anorg, Allg. Chem. 631 (2005) 2830.
[15] H.E. Fischer, A.C. Barnes, P.S. Salmon, Rep. Prog. Phys. 69 (2006) 233.
[16] A.L. Goodwin, F.M. Michel, B.L. Phillips, D.A. Keen, M.T. Dove, R.J. Reeder, Chem. Mater. 22 (2010) 3197.
[17] J.W. Singer, A.Ö. Yazaydin, R.J. Kirkpatrick, G.M. Bowers, Chem. Mater. 24 (1828) 2012.
[18] J. Jiang, M.R. Gau, Y.H. Qiu, S.H. Yu, Nanoscale 2 (2010) 2358.
[19] J. Ihli, Y.Y. Kim, E.H. Noel, F.C. Meldrum, Adv. Funct. Mater. 23 (2012) 1575.
[20] A.V. Radha, A. Fernandez-Martinez, Y. Huc, Y.-S. Jun, G.A. Waychunas, A. Navrotsky, Geoch. Cosmoch. Acta 90 (2012) 83.
[21] D. Di Tommaso, N.H. De Leeuw, Phys. Chem. Chem. Phys 12 (2010) 894.
[22] A.K. Soper, Chem. Phys. 202 (1996) 295.
[23] A.K. Soper, J. Mol. Liquids 78 (1998) 179.
[24] R.L. McGreevy, L. Pusztai, Mol. Simulation 1 (1988) 359.
[25] J.D. Rodriguez-Blanco, S. Shaw, L.G. Benning, Mineral. Magazine 72 (2008) 283.
[26] ICANS-XI International Collaboration on Advanced Neutron Sources, in: A.K. Soper, M. Misawa, et al., (Eds.), National Laboratory for High Energy Physics, KEK: KEK, Tsukuba, Japan, 1990, p. 809.
[27] A.K. Soper, Rutherford Appleton Laboratory Technical Report, RAL-TR-2011-013, 2011.
[28]A. Lausi, E. Busetto, M. Leoni, P. Scardi, Synchrotron Radiation in Natural Science 5 (2006) 100.
[29] A.K. Soper, Rutherford Appleton Laboratory Technical Report, RAL-TR-2011-012, 2011.
[image:5.595.134.468.51.383.2][30] T. Hassinen, M. Peräkylä, J. Comput. Chem. 22 (2001) 1229.