Proceedings of the Joint Workshop on
Linguistic Annotation, Multiword Expressions and Constructions (LAW-MWE-CxG-2018), pages 133–143 Santa Fe, New Mexico, USA, August 25-26, 2018.
133
Developing and Evaluating Annotation Procedures for Twitter Data
during Hazard Events
Kevin Stowe1, Martha Palmer1, Jennings Anderson1, Leysia Palen1, Kenneth M. Anderson1,
Marina Kogan2,Rebecca Morss3, Julie Demuth3, Heather Lazrus3 1University of Colorado, Boulder, CO, 80309
2University of New Mexico, Albuquerque, NM, 87131
3National Center for Atmospheric Research (NCAR), Boulder, CO, 80307
Abstract
When a hazard such as a hurricane threatens, people are forced to make a wide variety of deci-sions, and the information they receive and produce can influence their own and others’ actions. As social media grows more popular, an increasing number of people are using social media plat-forms to obtain and share information about approaching threats and discuss their interpretations of the threat and their protective decisions. This work aims to improve understanding of natural disasters through social media and provide an annotation scheme to identify themes in user’s social media behavior and facilitate efforts in supervised machine learning. To that end, this work has three contributions: (1) the creation of an annotation scheme to consistently identify hazard-related themes in Twitter, (2) an overview of agreement rates and difficulties in identify-ing annotation categories, and (3) a public release of both the dataset and guidelines developed from this scheme.
1 Background
People’s responses to hurricane events encompass a variety of factors, including their behavior, attitudes, and perceptions of information. As social media becomes more and more prevalent, analysis of data from platforms such as Twitter offers potential to build understanding of how and why people make different protective decisions as a hazard approaches. This understanding can then be used to help design strategies to enhance hazard risk communication and support protective decision making (Morss et al., 2017).
Ethnographic and qualitative content analyses of Twitter data from recent hazard events indicate that careful analysis of data can reveal new insights about how people interpret different types of information, evaluate and respond to risks, and manage impacts as a hazard approaches and arrives. Such analyses are resource-intensive, however, taking time and computing power both in terms of selecting a suitable sample and in reading and analyzing the data. Automated extraction offers significant potential for helping narrow down the vast volume of Twitter data to that which is likely to be of greatest interest for research focused on different topics, thus supporting in-depth qualitative analyses. Machine learning can also aid the quantitative analysis of macroscale patterns in the data, such as how mentions of different topics evolve over time.
Here, we are interested in what is salient to people who are at risk from a hazard as they gather and process information, assess risks, and decide how to respond as the threat and its impacts evolve. Our qualitative analyses of Twitter narratives to date indicate that these data can help reveal how people use forecasts, evacuation orders, environmental and social cues, and other information to help assess risks. These analyses also reveal that Twitter data contains content related to people’s cognitive risk perceptions, their affective responses to the risk and the event’s impacts, and their protective and coping behaviors (Anderson et al., 2016; Demuth et al., 2018; Mileti and Sorenson, 1990). Thus, the annotation reported here focuses on identifying these types of topics, as they are represented in the Twitter data.
2 Data Collection
Our annotation study is based on Twitterers active during Hurricane Sandy, which made landfall in the US in New Jersey on October 29th, 2012. This event affected millions of people in and around the New York City area. In order to identify and study protective decision making behavior, our annotation is aimed at users rather than individual tweets. Social media studies in a variety of domains tend to focus on individual tweets, but this approach often lacks the depth necessary to properly understand an individual’s behavior. Recent work indicates that using data beyond individual tweets is critical to understanding user response during disaster events (Palen and Anderson, 2016; Kogan and Palen, 2018). Without the context of a user’s entire stream of tweets, we are often unable to determine which tweets reference particular behaviors. Additionally if we work at the user level, this allows us to mitigate biases accumulated by specific heuristic based methods for tweet collection, which are often based on search terms that miss important tweets and include irrelevant tweets due to alternate uses of the terms.
For these reasons, we annotated based on users. However, finding the most relevant users for this task is difficult. Despite the weakness of collecting on search terms only, our user selection process begins with a set of users that used a Hurricane Sandy related keyword. We then employ multiple other filters. To obtain the first data set annotated, we removed users who tweeted less than 50 times as well as those whose tweets were primarily non-English. Most importantly, we limited our users to those that had at least 3 geo-tagged tweets within a mandatory evacuation zone. This allowed us to leverage Twitter’s geo-location feature to refine our selection of users to only those that are likely to have been directly impacted by the storm’s physical affects and were required to make a protective decision.
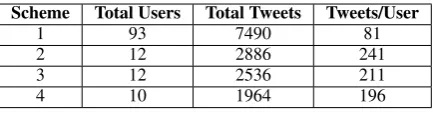
Over the course of developing our annotation scheme, we went through four different variations (re-ferred to as Scheme 1, 2, 3, and 4). Our initial dataset (used for Scheme 1) includes 93 of the nearly 5,000 users that satisfied these requirements. It should be noted that the mandatory evacuation zone included very dense parts of Manhattan, Brooklyn, and Staten Island.
Through coding this first set of users we identified a bias in which types of users are tweeting with location services enabled. Our data had a disproportionate amount of high school aged persons that were not necessarily discussing their protective decisions or actions, but were instead affected by those decisions of their families. Occasionally, we could identify decisions to evacuate or take other protective actions through a user’s comments (often complaints) about their family’s location.
To improve this sample, rather than use the evacuation zone, we looked for users with ”Far Rockaway” listed in their location or used in their tweets. Far Rockaway, located on the east end of the Rockaway Peninsula was under mandatory evacuation and impacted heavily by the storm. Filtering for these users identified 263 users that likely had to take protective action. We further filtered this list down to 53 users local to the area with descriptive tweet content that we could code. From these 53 users, we randomly selected subsets to annotate. This process yielded 12 users for scheme 2, 12 users for scheme 3, and 10 users for scheme 4.
Note that there is still significant bias in this data: Twitter users do not represent the entire population, and our collection methods aimed at identifying those at risk necessarily introduce additional bias into the sample. As we remove users that are not primarily in English, we also lose a substantial portion of users that may have been affected. To address these issues, our team also conducted focus groups with affected populations in New York City, with the goal of identifying risk factors for those who may not have access to Twitter and primarily non-English speaking populations (Lazrus et al., 2017).
Scheme Total Users Total Tweets Tweets/User
1 93 7490 81
2 12 2886 241
3 12 2536 211
[image:3.595.191.408.61.118.2]4 10 1964 196
Table 1: Tweet and User counts by Scheme
data is now more than five years old. In other investigations, we have reached out to specific users before (re)publishing their public tweets alongside our in-depth analysis of their decisions (Anderson et al., 2016).
3 Annotation Overview
We initially developed a coding scheme via an iterative process, inspecting vulnerable Twitterers and identifying the kinds of protective decisions, attitudes, and information sources they were tweeting about. After determining a general idea of what kind of information users made explicit in tweets, we attempted to devise a scheme that is both exhaustive and mutually exclusive. We then pulled data for new users and applied the coding scheme to those. New users allowed us to identify new tweet categories that weren’t covered by previous iterations. This process was repeated until the scheme settled, and no persistent new categories appeared. Our goal was to develop a scheme that covered every possible type of tweet that was of interest, and then narrow down to only those that reflected particularly informative tweets that were also consistently identifiable by non-domain experts.
This process was completed four times. Scheme 1 is multidimensional, including top-level and lower level categories for a broad spectrum of behaviors we found in the data1. We then ran three more iter-ations based on what we could consistently identify in the data. Scheme 2 refined the guidelines and added a small number of categories domain experts found particularly important. Scheme 3 compressed these down into a single layer, using only top-level categories, but still contained a large number of pos-sible annotations. Finally, with Scheme 4, we settled on the 6 most important high level concepts, thus allowing annotation to be done with reasonable agreement while still capturing important behaviors.
The annotation process was done by giving the annotators all of a user’s tweets from three weeks before landfall to three weeks after. This allows them to use contextual information to better understand user behavior. Each user was double annotated. Annotators met with members of the research team regu-larly to better understand the guidelines and help inform decisions about categories that were potentially difficult to distinguish. Annotators all had backgrounds in linguistics, with varying degrees of experi-ence with Twitter. Over the course of the project we employed 5 different annotators. We recognize the possibility that variation in annotators may lead to bias in agreement rates. However, we annotated a handful of the same users using the same guidelines with different pairs and saw no significant difference in agreements, so we believe this concern is minimal.
4 Annotation Categories
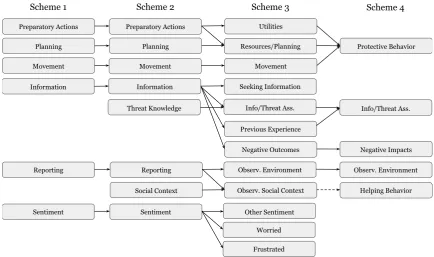
Each category has been refined and clarified through the four different schemes. Across all schemes, we first annotated tweets forRELEVANCE. This allowed us to determine, at a high level, what tweets were related to the event and what tweets were not. Beyond relevance, there are a variety of important themes that we attempted to find and classify. For a general overview of high level categories, see Figure 1. These themes fall broadly into the six categories, which will be explored in the follow sections. Each relevant tweet can be annotated as one or more of these categories as many tweets expressed multiple propositions and behaviors.2
1
We will use small caps forTOP-LEVELcategories, anditalicsfor subcategories. Schemes 3 and 4 include onlyTOP LEVEL categories.
Social Context Information
Movement Planning Preparatory Actions
Reporting
Sentiment
Information Planning
Reporting Preparatory Actions
Movement
Sentiment
Info/Threat Ass. Movement
Previous Experience Utilities
Worried
Frustrated Other Sentiment Seeking Information
Negative Outcomes
Observ. Social Context Observ. Environment
Resources/Planning
Negative Impacts Protective Behavior
Observ. Environment
Helping Behavior
Scheme 1 Scheme 2 Scheme 3 Scheme 4
[image:4.595.81.516.61.318.2]Info/Threat Ass. Threat Knowledge
Figure 1: Evolution of the top-level categories. Note that subcategories were significantly shifted in Schemes 1 and 2 to promote coherence, and subsequently dropped for Schemes 3 and 4. Relevance was annotated across all schema. The dashed line indicates that Helping Behavior was only a small part of the original Observ. Social Context category.
Scheme Count % Agreement
1 1662 26.8 .592
2 478 34.8 .920
3 889 29.4 .917
4 440 22.4 .911
Table 2:Relevance: Counts and Agreement Rates for annotation ofrelevanttweets
4.1 Relevance
Anything referencing the event or its effects was annotated as RELEVANT. This goes beyond the sit-uational awareness annotation of Verma et al (2011), in that it includes tweets that don’t exhibit any awareness but still refer to the event, including jokes, retweets, and speculation.
As our goal is to capture all tweets that relevant, we allowed annotators to use the full contextual stream to make decisions about relevant tweets. While this can often disambiguate difficult tweets, it also posed some difficulties in the level of inference possible, which will be explored in Section 5.1.2.
The RELEVANCE category was not changed over the course of the annotation, but the annotation guidelines were updated to include better descriptions and examples as we encountered border cases. This is reflected in agreement rates, which greatly improved from Scheme 1 to Scheme 2 (Table 2). Most difficult are cases of short tweets that contain little information which can not be disambiguated through context.
4.2 Preparatory Action
[image:4.595.219.380.399.455.2]4.2.1 Supplies and Electricity
We created a top-levelPREPARATORY ACTIONcategory based on material supplies and electricity that is necessarily broad, including various kinds of information. This category contains five subcategories for Schemes 1 and 2:
• General Electricity(household power, generators, etc)
• Electricity for Communication(electricity preparation specific to communicative devices such as phones and computers)
• Material Assets and Supplies(food, flashlights, etc) • Drugs and Alcohol
• Preparing Home and Property(actions taken to protect property)
These categories remained the same from Scheme 1 to Scheme 2, but were merged to provide better distinctions in Scheme 3. We combined any mention of electrical power with mentions of other utilities such as sewage, water, and phone service. This became a singleUTILITIEScategory. We then condensed any mention of household resources (such as food, water, and alcohol) along with physical preparation, yielding a singleHOUSEHOLD PREPARATIONcategory. The goal of this change is to improve top-level
consistency, so removing electricity related tweets from material assets seemed necessary.
4.2.2 Planning
Making plans for the event and possible actions that may be required in the future are both kinds of prepa-ration. For Scheme 1 we attempted to identify four different types of planning: changing,considering, and maintaining plans, as well as transportation planning. However these subcategories were found to be less important and hard to identify, and were lumped into a single PLANNINGtop-level category for Scheme 2. For Scheme 3 these were lumped into the HOUSEHOLD RESOURCES AND PLANNING
category.
4.2.3 Movement
A critical user behavior is movement: either evacuating, deliberately sheltering in place, or returning from an evacuation. For Schemes 1 and 2, we includedMOVEMENTas a top-level category, with evac-uation,sheltering in place, andreturning from evacuationas fine-grained subcategories. Our goal was to differentiate different types of movement because the different behaviors plausibly represent different risk and vulnerability profiles that are interesting for examination, both here and across different weather hazards. However, they are sparse in the data, and for scheme 3, these were collapsed. We rely on only the top-level MOVEMENTcategory, and for Scheme 4 these were included in the broadPREPARATORY ACTIONcategory.
Agreement forMOVEMENTtweets is difficult, largely because they are so infrequent. Most users don’t reference their positional behavior, either as evacuation or protective sheltering. This leads to difficulty in finding good examples, and also limits the potential of using supervised machine learning to identify movement tweets, as training data will likely be insufficient.
Due to persistent difficulty in distinguishing various preparatory behaviors, for Scheme 4 all three of the subcategories were included in a singlePREPARATORY ACTION category, including any mention of household resources, electricity or other utilities, household preparation, and any movement-related behavior.
4.3 Information
The question of how people acquire and distribute information from social media is critical to the analysis of the roles different types of information play in protective decision making. We began with a top levelINFORMATIONcategory, with subcategories forpassing on information, including retweets, direct quotes, and paraphrases, as well as any tweetsseeking informationfrom outside sources.
• evacuation factors, which indicates references to specific factors affecting the user’s ability to evac-uate, such as pets or immobile family members
• threat knowledge, which includes information from any sources about their perceptions of the level of severity of the approaching event
• previous experience, which includes mentions of their responses and opinions about previous hur-ricane events.
For Scheme 3 we collapsed these three items along withforecasts andpublic officials into a single category, INFORMATION AND THREAT ASSESSMENT. We also split out ASKING QUESTIONS, as it doesn’t directly reflect a person’s threat information and appeared relatively easy to classify separately. Thepass on informationcategory was dropped.
For Scheme 4, we added previous experience to theINFORMATION AND THREAT ASSESSMENT cate-gory, with significant guideline clarifications, ensuring that the category captures any mention of future damage from the event. We dropped theASKING QUESTIONScategory as it was deemed not critical to
capture.
4.4 Environment Observations
People’s first-hand reports of their surrounding environment are critical for assessing their risk and vul-nerability. For Scheme 1 and Scheme 2, the REPORTING category captures these reports. It includes subcategories for reports ofnatural environment(including weather and flooding), reports of built en-vironment (road and structure damage), reports of immediate personal environment (including direct observations of the person’s current location), and reports ofwhat other people are doing, later folded into the social context themes covered in Section 4.5.
These categories proved somewhat confusing for annotators and contained significant overlap, so for Scheme 3 they were condensed into one key observation category : ENVIRONMENT OBSERVATIONS
(including natural, built, and personal). A key difficulty in identifying observations of environment is the distinction between a tweeter’s own observations and those of others - it is often unclear whether they are directly reporting or relaying the reports of others. This was clarified to allow only direct observations in Scheme 3, with indirect reports being a type of threat assessment, and thus falling in theINFORMATION
AND THREAT ASSESSMENTcategory.
For Scheme 4, all observations of any impacts, including weather, physical damage, and other envi-ronmental factors, are included in the sameENVIRONMENT OBSERVATIONScategory. We also relaxed the guidelines to include any mention of environment observation regardless of source. This allows for a broader and easier to define category that still captures the necessary tweets.
4.5 Social Observations
Along with observations of their physical environment, people’s observations of social context are strong indicators of their ability to prepare for and cope with disaster. Additionally, observations of other people taking preparatory actions may influence a user’s own decisions.
For Scheme 1, social observations are captured only through a subcategory of REPORTING, what others are doing. This was difficult to annotate, perhaps due to its potentially vague or ambiguous nature. In order to better capture the full extent of observations relating to social context, a new top level category was created for Scheme 2: SOCIAL CONTEXT. Fine-grained categories for this top-level
category are mentions of the user’s social network, which indicates ability to lower one’s risk and/or vulnerability, mentions ofcommunity organizations, and mentions ofsensitive populations: those that may be disadvantaged in preparing for or responding to the event.
For Scheme 3, all of these codes were condensed into one top level code,SOCIAL CONTEXT, as distin-guishing between them proved difficult. Scheme 3 also included thewhat others are doingsubcategory
ofREPORTINGin the newSOCIAL CONTEXTcategory.
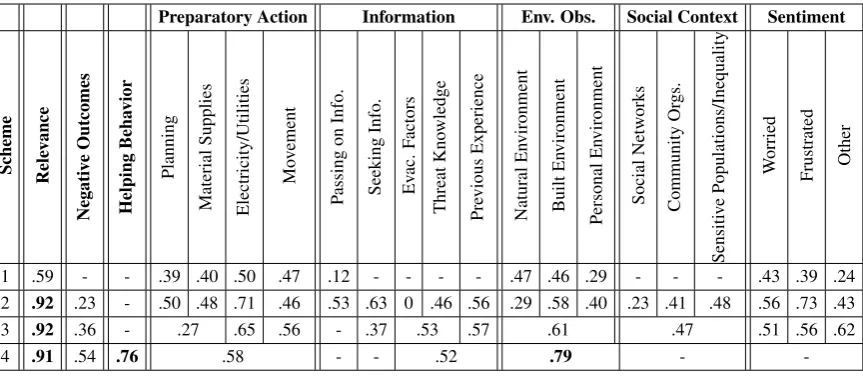
Preparatory Action Information Env. Obs. Social Context Sentiment Scheme Rele v ance Negati v e Outcomes Helping Beha vior Planning Material Supplies Electricity/Utilities Mo v ement P assing on Info. Seeking Info. Ev ac. F actors Threat Kno wledge Pre vious Experience Natural En vironment Built En vironment Personal En vironment Social Netw orks Community Or gs. Sensiti v e Populations/Inequality W orried Frustrated Other
1 .59 - - .39 .40 .50 .47 .12 - - - - .47 .46 .29 - - - .43 .39 .24
2 .92 .23 - .50 .48 .71 .46 .53 .63 0 .46 .56 .29 .58 .40 .23 .41 .48 .56 .73 .43
3 .92 .36 - .27 .65 .56 - .37 .53 .57 .61 .47 .51 .56 .62
4 .91 .54 .76 .58 - - .52 .79 -
-Table 3: Inter-annotator Agreement as F1 across Schema. Bold numbers are those that showed agreement over .75.
4.6 Negative Social and Economic Outcomes
Particularly important to researchers studying the effects of hazard events are the negative outcomes that follow. This category is specifically designed to capture indirect effects - lifestyle disruption, personal loss (of jobs, wellbeing, etc.), and damages to mental and physical health (physical or emotional suf-fering, loss of life, injury, illness, etc.). Introduced as a subcategory of INFORMATION in Scheme 2, it was pulled out into its own category in Schemes 3 and 4, along with substantial clarifications to the guidelines. This category is hard to consistently annotate, as it is broad and not very frequent, but we’ve maintained it due to its importance to the understanding of hazard events.
4.7 Sentiment
SENTIMENTis the most traditional category of annotation, having received a large amount of treatment for social media (see Barnes et al (2017) for a recent review of sentiment models and tasks). Our goal was ambitious - we aimed to capture a large set of diverse sentiments, rather than simply positive/negative. For Schemes 1 and 2, we included 8 different subcategories of sentiment. These are awe, boredom,
excitement,humor,frustration,positive coping,worry, and beingsettled.
For Scheme 3, we removed categories that were rare (awe, boredom, settled, excitement), as well as those with very low agreement rates (positive coping, humor). We kept three different sentiment categories as top level categories : WORRY,FRUSTRATION, and anOTHER category which is used for
any of the other sentiments. This allows us to capture the most common sentiments as well as those that are relevant to people’s decision making. It also allows us to capture any other sentiment at a general level, and this data can be further analyzed to find specific themes.
In annotating these sentiment categories, we encountered numerous problems. First, we were largely unable to consistently distinguish between the fine-grained categories. There were a large number of instances that annotators did not agree on the correct sentiment even after discussion. This was particu-larly prevalent for categories likehumor, where the subjective nature of the emotion makes it difficult to obtain reliable agreement, and in differentiatingWORRYandFRUSTRATIONwhich are indistinguishable
in many cases. Second, most of the fine-grained categories showed fairly sparse results, making them impractical to use for machine learning.
[image:7.595.85.517.61.249.2]5 Analysis
Inter-annotator agreement for each category over time are shown in Figure 3. Agreement was calculated as F1 between annotators, as the distribution is highly skewed. We considered agreement rates over .75 to be ”good”, and preliminary results show this evaluation roughly matches ”good” arguments calculated scores via Cohen’s kappa.
With clarification, guideline improvements, and merging of difficult themes, some categories became clearer and better defined. Others remained difficult despite category compression and clarification. Relevance agreement was greater than .90 from Scheme 2 to Scheme 4, showing that it can be reliably coded across users. With the clarification ofENVIRONMENT OBSERVATIONS, agreement reached .79 in Scheme 4, also showing that it can be reliably captured. The new category HELPING BEHAVIORalso achieved an agreement rate over .75. TheNEGATIVE OUTCOMES,PREPARATORY ACTION, andTHREAT ASSESSMENTcategories all proved much more difficult, showing agreement rights between .5 and .6.
The release of this data will include all of the relevance annotation as agreement is generally good, as well as all of the data annotated for the most current guideline, Scheme 4. The data annotated for this research will be made available in compliance with Twitter’s terms of service, meaning that tweets that have been deleted or made private by their owners will not be retrievable. The contextual streams we annotated are available through Twitter, and thus this process can be replicated (provided these users allow their tweets to remain public) and applied to new users. We will also release the guidelines for the current version of Scheme 4, with the knowledge that some categories can be consistently annotated while others require further improvement.
We observed a variety of challenges in the disagreements that demonstrate difficulties in these anno-tations.
5.1 Disagreements
Two related, dependent properties are present in a large number of disagreements. One is that the level of inferencing deemed possible given only a short text varies between annotators. The other is that there often isn’t sufficient content in a tweet to allow interpretation. These factors are related - short tweets often allow for varying levels of interpretation. However, they aren’t always the same - there are tweets that contain a full amount of content that still pose inference problems, and there are short tweets that are unambiguous.
5.1.1 Inference
The key problem for most of the disagreements is the degree to which the annotators made inferences from the text. While there are many cases where users exhibit a clear behavior from their tweet, there are many more that yield some insight into what they are experiencing but are unclear as to the exact extent that they are affected.
We found it difficult to restrict annotators to a specific level of inference. While it may be possible to only allow them to use information directly present in a single tweet, this will lead to the omission of a large amount of data that does indicate relevant and important behavior but requires world knowledge to understand the user’s intent. The inferencing problem, where annotators disagreed on how much to read into a particular tweet, is primarily caused by three factors: insufficient context, insufficient content, and the modality of the information.
5.1.2 Insufficient Context
1. The news goes to the blocks that always flood and sit out here like oh no it’s flooded..Lol 2. @user 2 nah stop watching the news.../they full of shit
In this example, tweet 2 is ambiguous without context: it could refer to hurricane or non-hurricane related news. However, their previous tweet 1 is about the untrustworthiness of news broadcasters during disaster events, so it seems reasonable to infer that tweet 2 is also about the hurricane. This doesn’t always clarify matters, however, especially with regard to tweets that are short and contain minimal context and content:
1. Im extremely bored! 2. ... #nvm
3. I’ve never heard that but it makes so much sense. Lol
In this context, these tweets are all still indeterminate, showing the difficulty of assessing user’s be-havior given the limited nature of the text produced. While we tend to mark these as irrelevant, it can be difficult to tell which tweets play a part in their decisions and which are irrelevant, and annotators often disagreed about how to interpret contextual information.
5.1.3 Content
From the data we observed that there are numerous tweets that contain very little content. These are difficult to annotate with any category, and require extensive inferencing from context to determine the user’s experience. For this reason, we instructed annotators to mark tweets that appeared lacking in content as irrelevant. Many of these cases are straightforward:
1. @user1 lmaooo 2. Got real quick
Our guidelines indicate that tweets with this extreme deficit of content can be marked as irrelevant. However, there are also cases where a small amount of content is present, and it becomes difficult to determine if the content is relevant or indicative of a particular behavior.
1. Turn on the light!
2. @user2 u can come here :) 3. Store run
These cases are indeterminate without context, and even within user streams they are difficult to assess. While we attempted to decipher the users’ situations from their contextual stream, in many cases the context is also sparse and we theorized that the lack of content may lead to disagreement.
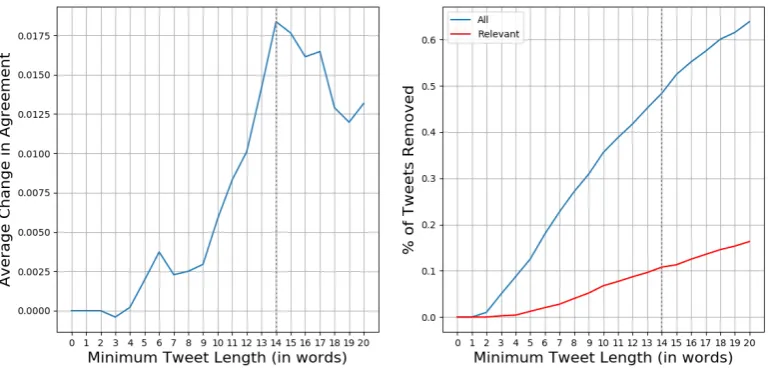
As an experiment, we removed tweets that contained less than a given number of words from the data and then reassessed agreement rates. The results for change of agreement rates without these short tweets, as well as the percentage of tweets removed, are displayed in Figure 2.
This analysis shows that removing only very short tweets yields no significant result in terms of an-notator agreement. Most short tweets aren’t relevant, the percentage of short tweets removed increases slower. Removing tweets up to 14 words improves agreement performance by only 1.5%, requiring the removal of 40% of the data (over 10% of the relevant tweets). Thus only minimal gain is achieved while sacrificing large amounts of data. This shows the danger in trimming Twitter data based on word count, as large of amounts of data may be removed without improving the quality of the dataset. This can also introduce extra biases in the data, and compounding this with the biases already present in Twitter data will yield a final dataset with extensive sampling issues.
5.1.4 Modality
Figure 2: Agreement rates and data size after removing tweets below a certain word count.
1. @user2 did you evacuate?
2. Tight I’m not getting any of these emergency alerts on my phone
3. How Siri can’t tell me where sandy is at tho? Siri is really good for nothing
In 1, the user is asking a friend if they evacuated. Were it a first person reference, we could assume protective decision making behavior. That not being the case, annotators disagreed on how far to infer. If she knows people are considering evacuation, does that also reflect her evacuation decision? In 2 and 3, the user lacks information about the threat due to technical problems. Does their demonstrating that they lack knowledge indicate that they consider the threat to be more serious, or that they should take some decision? Lack of context and level of inference both cause this kind of tweet to be difficult to consistently annotate.
6 Future Work
Although our initial development and testing of the annotation scheme reported here uses Twitter data from Hurricane Sandy, the scheme was developed using knowledge about the factors that affect decision making for hurricanes and other weather-related hazards (e.g., tornadoes, floods) based on the body of existing literature on these topics that has been developed using other research methods (e.g., (Brotzge and Donner, 2013), (Gladwin, 2007), (Lindell and Perry, 2012), (Ruin et al., 2014), (Morss et al., 2017)). Thus, we anticipate that with minor modifications based on the context, the approach discussed here will also be applicable for studying other hurricanes that threaten the US, and other types of weather hazards. Our ongoing research will be testing the utility of the approach for Hurricane Matthew, which occurred in 2016, and tornado events.
Tornadoes are rapid-onset, spatially localized hazards as compared to hurricanes. Thus, they represent information, risk assessment, and response behaviors that are similar to hurricanes but that are time-compressed and plausibly different in other ways. We aim to apply the coding scheme developed here to such events as a test of its external validity and use these events to refine the scheme so that it can be more broadly useful for other hazards.
Acknowledgements
References
Jennings Anderson, Marina Kogan, Leysia Palen, Kenneth Anderson, Kevin Stowe, Rebecca Morss, Julie Demuth, Heather Lazrus, Olga Wilhelmi, and Jennifer Henderson. 2016. Far far away in far rockaway: Responses to risks and impacts during hurricane sandy through first-person social media narratives. In Proceedings of the Information Systems for Crisis Response and Management (ISCRAM) Conference.
Jeremy Barnes, Roman Klinger, and Sabine Schulte im Walde. 2017. Assessing state-of-the-art sentiment models
on state-of-the-art sentiment datasets. InProceedings of the 8th Workshop on Computational Approaches to
Subjectivity, Sentiment and Social Media Analysis, pages 2–12, Copenhagen, Denmark, September. Association for Computational Linguistics.
J. Brotzge and W. Donner. 2013. The tornado warning process: A review of current research, challenges, and opportunities.Bulletin of the American Meteorological Society, 94(11):1715–1733.
Julie Demuth, Rebecca Morss, Leysia Palen, Kenneth Anderson, Jennings Anderson, Marina Kogan, Kevin Stowe, Melissa Bica, Heather Lazrus, Olga Wilhelmi, and Jen Henderson. 2018. ”sometimes da #beachlife ain’t always da wave”: Understanding people’s evolving risk assessments and responses during hurricane sandy using twitter (in press). Weather, Climate and Society.
C. Fiesler and N. Proferes. 2018. ”Participant” perceptions of twitter research ethics. Social Media + Society, 4(1).
M. Finn and K. Crawford. 2015. The limits of crisis data: analytical and ethical challenges of using social and mobile data to understand disasters.GeoJournal, 80(4):491–502.
Nicole Dash Hugh Gladwin. 2007. Evacuation decision making and behavioral responses: Individual and
house-hold. Natural Hazards Review, 8(3):69–77.
Marina Kogan and Leysia Palen. 2018. Conversations in the eye of the storm: At-scale features of conversational
structure in a high-tempo, high-stakes microblogging environment. InProceedings of the 2018 CHI Conference
on Human Factors in Computing Systems, CHI ’18, pages 84:1–84:13, New York, NY, USA. ACM.
H. Lazrus, O. Wilhelmi, J. Henderson, R. E. Morss, and A. Dietrich. 2017. Information as intervention: How can hurricane risk communication reduce vulnerability?
Michael K. Lindell and Ronald W. Perry. 2012. The protective action decision model: Theoretical modifications and additional evidence. Risk Analysis, 32(4):616–632.
D.S. Mileti and J.H. Sorenson. 1990. Communication of Emergency Public Warnings: A Social Science
Perspec-tive and State-of-the-ART Assessment. Oak Ridge National Laboratory Rep. ORNL-6609.
Rebecca E. Morss, Julie L. Demuth, Heather Lazrus, Leysia Palen, C. Michael Barton, Christopher A. Davis, Chris Snyder, Olga V. Wilhelmi, Kenneth M. Anderson, David A. Ahijevych, Jennings Anderson, Melissa Bica, Kathryn R. Fossell, Jennifer Henderson, Marina Kogan, Kevin Stowe, and Joshua Watts. 2017. Hazardous
weather prediction and communication in the modern information environment. Bulletin of the American
Me-teorological Society, 98(12):2653–2674.
Leysia Palen and Ken M. Anderson. 2016. Crisis informatics: New data for extraordinary times. Science,
353(6296):224–225.
Isabelle Ruin, Cline Lutoff, Brice Boudevillain, Jean-Dominique Creutin, S. Anquetin, M. Bertran Rojo, L. Boissier, L. Bonnifait, M. Borga, L. Colbeau-Justin, L. Creton-Cazanave, G. Delrieu, J. Douvinet, E. Gaume, E. Gruntfest, J.-P. Naulin, O. Payrastre, and O. Vannier. 2014. Social and hydrological responses to extreme pre-cipitations: An interdisciplinary strategy for postflood investigation. Weather, Climate, and Society, 6(1):135– 153.