THE ECONOMIC AND SOCIAL RESEARCH INSTITUTE COUNCIL
*TOMAS F. (~ COFAIGH, LL.D., President of the Institute.
*D. F. McALEESE, B.COMM., M.A., M.ECON.SC., PH.D., Chairman of the Council.
D. J. BUCKLEY, Vice President and General Manager, Merck, Sharp and Dohme (Ireland) Ltd., Co. Tipperary.
L. CONNELLAN, B.E., C.ENG., M.I.E.I., Director General, Confederation of Irish hldustry.
*SEAN CROMIEN, B.A., Secretary, Department of Finance.
MICHAEL P. CUDDY, M.AGR.SC., PH.D., Professor, Department of Economics, University College, Galway.
G. DEAN, M.D., F.R.C.P.
*MARGARET DOWNES, B.COMM., F.C.A., Director, Bank of Ireland. *MAURICE F. DOYLE, B:A., B.L., Governor, Central Bank of Ireland.
P. W. FLANAGAN, Secretary, Department of Health.
N. J. GIBSON, B.SC.(ECON.), PH.D., Pro-Vice-Chancellor, University of Ulster, Colerabw.
PATRICK A. HALL, B.E., M.S., DIP.STAT., Director of Research, Institute of Public Administration.
MICHAEL F. KEEGAN, B.A., B.COMM., D.P.A., F.I.P.M., Secretary, Depart-ment of Labour.
*KIERAN A. KENNEDY, M.ECON.SC., B.PHIL., PH.D., Director of the Institute. T. P. LINEHAN, B.E., B.SC., Director, Central Statistics Office.
P. LYNCH, M.A., M.R.I.A.
*EUGENE McCARTHY, M.SC.(ECON.), D.ECON.SC., Director, Trinity Bank Ltd. JOHNJ. McKAY, B.SC., D.P.A., B.COMM., M.ECON.SC., Chief Executive Officer,
Co. Cavan Vocational Education Committee. *D. NEVIN, Dublin.
REV. J. R. M. NOLAN, M.A., D.D., M.A.(Cantab.), Professor, Department of Log# and Psychology, University College, Dublin.
JOYCE O’CONNOR, B.SOC,SC., M.SOC.SC., PH.D., Director, Social Research Centre, College of Humanities, National Institute for Higher Education, Limerick.
MAURICE O’GRADY, M.SC(MGMT), Director General, Irish Management Institute. PIERCE RYAN, B.AGR.SC., M.SC., PH.D., M.R.I.A., Director, Teagasc. S. SHEEHY, B.AGR. SC., PH.D., Professor, Department of Applied Agricultural Economics,
University College, Dublin.
J. SPENCER, B.SC. (ECON)., Professor, Department of Economics, The Queen’s University, Belfast.
T. C. TONER, B.COMM., M.B.A., Chairman, Arnotts plc.
*B. M. WALSH, B.A., M.A., PH.D., Professor, National Economics of Ireland and Applied Economics, University College, Dublin.
*REV. C. K. WARD, B.A., S.T.L., PH.D., Professor, Department of Social Science, Uuiversity College, Dublin.
*T. K. WHITAKER, M.SC.(ECON.), D.ECON.SC., LL.D.
*P. A. WHITE, B.COMM., D.P.A., Managing Director, Industrial Development Authority, Dublbz.
THE ECONOMIC AND SOCIAL RESEARCH INSTITUTE
Medium-Term Review:
1989-1994
J. BRADLEY J. FITZ GERALD
Copies of this paper may be obtained from The Economic and Social Research Institute (Limited Company No. 18269), (Registered Office) 4 Burlington Road, Dublin 4.
Price IR£ 17.50
John Bradley and John Fitz Gerald are Senior Research Officers at The Economic and Social Research Institute. The Review has been accepted for publication by the Institute, which is not responsible for either the content or the views expressed therein.
Table of Contents
ACKNOWLEDGEMENT SUMMARY
SECTION 1 GENERAL INTRODUCTION AND REVIEW 1.1 GENERAL INTRODUCTION
1.2 REVIEW
SECTION 2 BASELINE ASSUMPTIONS 2.1 THE WORLD ECONOMIC OUTLOOK 2.2 DOMESTIC ASSUMPTIONS
SECTION 3 THE CENTRAL FORECAST 3.1 OVERVIEW
3.2 THE SUPPLY SIDE OF THE ECONOMY 3.3 PRICES AND WAGE RATES
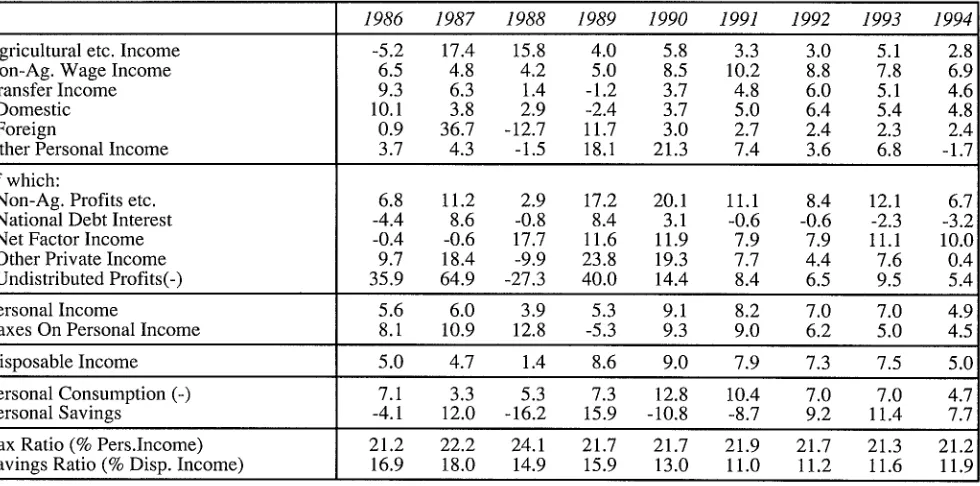
3.4 INCOMES
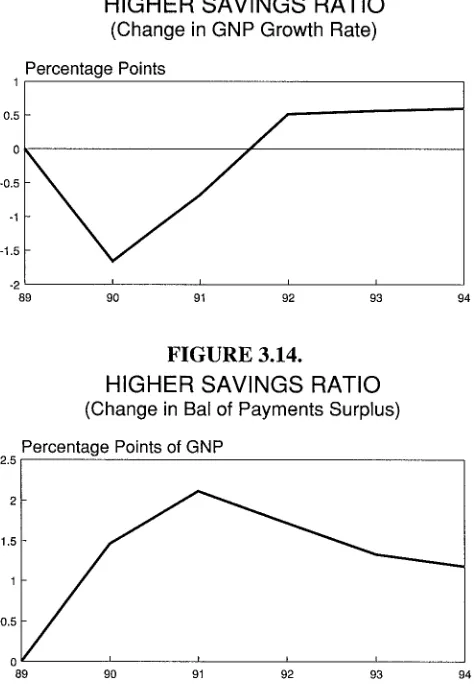
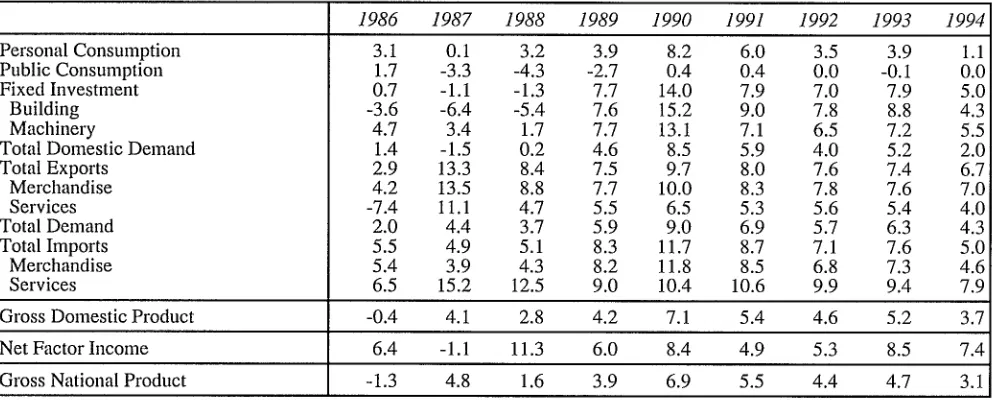
3.5 THE SAVINGS RATIO 3.6 EXPENDITURE ON GNP
3.7 THE BALANCE OF PAYMENTS
3.8 EMPLOYMENT AND THE LABOUR FORCE 3.9 THE PUBLIC FINANCES
3.10 THE MONETARY SECTOR 3.11 UNCERTAINTIES
3.12 CONCLUSIONS
SECTION 4 THE EC STRUCTURAL FUNDS AND ECONOMIC GROWTH 4.1 INTRODUCTION
4.2 THE PLAN EXPENDITURES
4.3 THE MACROECONOMIC CONSEQUENCES 4.4 CONCLUDING COMMENTS
SECTION 5 MACROECONOMIC EFFECTS OF 1992 by L. O’Sullivan
5.1 THE PRINCIPAL EFFECTS OF 1992 5.2 REMOVAL OF CUSTOMS BARRIERS 5.3 PUBLIC PROCUREMENT
5.4 FINANCIAL MARKET INTEGRATION 5.5 SUPPLY-SIDE EFFECTS
5.6 TAX HARMONISATION
5.7 THE COMBINED EFFECTS OF 1992 SECTION 6 ECONOMIC POLICY IN THE 1990s
6.1 THE ECONOMY IN THE 1990S 6.2 OPPORTUNITIES AND RISKS 6.3 IMMEDIATE POLICY ISSUES 6.4 LONGER-TERM POLICY ISSUES 6.5 CONCLUSIONS
APPENDIX
iv vii
1 1 2 11 ll 13 17 17 18 23 25 26 27 30 31 32 34 35 37 39 39 41 43 49
51 51 52 54 55 57 59 60 63 63 63 64 67 70 71
ACKNOWLEDGEMENT
The authors would like to acknowledge the very valuable contribution made by Liam O’Sullivan of the Department of Finance over the last year in developing
the macroeconomic model used in this Review. Major assistance was also received from David Hurley, Bernard Donoughue and our colleagues in the ESRI. The
authors, of course, remain solely responsible for the way the economic model was used and, in particular, for the content of this publication. Finally the authors would like to thank Mary McElhone of the ESRI for her assistance in the final production of the Review.
Table of Tables
1.1: Comparison of Forecasts for GNP Growth Rate
3.1: Central Forecast - Major Aggregates
3.2: Output: GDP at Factor Cost
3.3: Price Deflators and Wage Rates
3.4: Personal Income
3.5: Expenditure on GNP
3.6: Employment and the Labour Force
3.7: The Public Finances
3.8: The Flow of Funds
3.9: Growth Rate of GNP Without 1992
4.1: National Development Plan: Main Sectoral Categories
4.2: Macroeconomic Consequences
4.3: Consequences for the Total Industry Sector
4.4: The Labour Market
4.5: The Public Authorities Finances
5.1: Removal of Customs Barriers: Ex-Ante Changes
5.2: Removal of Customs Barriers: Main Effects
5.3: Public Procurement: Ex Ante Changes
5.4: Public Procurement: Main Results
5.5: Financial Market Integration: Ex-Ante Changes
5.6: Financial Market Integration: Main Results
5.7: Supply-Side Effects: Ex-Ante Change
5.8: Supply-Side effects: Main Results
5.9: Tax Harmonisation: Main Results
5.10: The combined Effects of 1992: Ex-Ante Changes
5.11: Combined Effects of 1992: Main Results
5.12: Combined Effects of 1992 for the EC
2
17
19
24
25
28
32
33
34
37
40
43
45
47
48
52
53
54
55
55
57
57
58
59
60
61
62
SUMMARY
MAIN FEATURES
We project a pattern of sustained growth of GNP for the next five-year period, 1989-94. The average annual growth rate should be in the region of 5 per cent, with higher growth in 1990 and 1991 followed by a slow-down in later years. As with all forecasts five years ahead, this projection is subject to great uncertainty. However, it represents our best estimate of the likely time-path for the economy in the period to 1994. Our central forecast takes account of the likely effects of both 1992 and of the substantial increase in payments to Ireland from the EC Structural Funds. It also allows for some limited reduction in direct taxes and increases in welfare benefits. Otherwise it assumes that there is no volume increase in government expenditure or real cuts in taxation. Any departure from such a strict regime, which did not match changes in expenditure and
rev-enue, would affect the forecast.
On the basis of these assumptions we expect the balance of payments to remain in substantial surplus of between 2 and 3 per cent of GNP. The Exchequer borrowing requirement, having fallen from almost 13 per cent of GNP in 1986 to about 4 per cent this year, is set to go into surplus in 1991. Under present policies this surplus would reach almost 4 per cent of GNP by 1994. Consequently the debt/GNP ratio is likely to fall rapidly from its current level of 135 per cent of GNP to just under 85 per cent by the end of 1994.
The inflation rate, currently at 3.5 per cent, will rise by around 1 percentage point in the next two years and will only fall back to present levels towards the end of the forecast period.
Total employment will rise rapidly during the five-year period by almost 80,000 jobs. However, the rate of unemployment, presently at 16 per cent of the labour
force, will only fall to just under 13 per cent by 1994.
FORECAST DETAILS
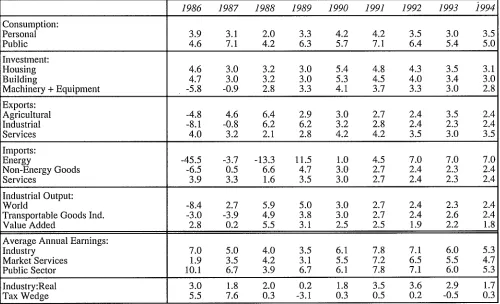
Table 1 gives details of the central forecast for certain key economic aggregates. The most striking feature is
the very high growth rate projected for 1990. A key factor underlying this is the level of support from the EC Structural Funds. This stimulus will come on top of an already buoyant economy to give a record growth rate.
The growth of the economy slows appreciably in subsequent years so that by 1994 it is down to just over 3 per cent (Figure 1). The preparation for 1992 reduces growth by a small amount in 1990 and 1991 while it provides a substantial offset to the reduction in the underlying rate of growth in the period 1992-4.
Even without the effects of the EC Structural Funds and 1992 the pattern of growth of the economy would show a definite peak in 1990 with a slow-down there-after. This underlying pattern reflects the fact that we are benefiting from the effects of postponed growth from the 1980s. In particular, the fall in the savings ratio which we forecast for the period 1989-91 represents a recovery of confidence by consumers, a confidence which was severely dented in the 1980s by the wide-spread fiscal cut-backs.
Over the three year period 1987-89 the rate of growth has been substantially reduced by the necessity of pursuing a restrictive fiscal policy. In 1987 and 1988 fiscal policy reduced the growth rate by between 1 per cent and 2 per cent a year. The underlying growth rate for those three years (under a hypothetical neutral fiscal policy), was thus around 4.5 per cent. We see this process of recovery reaching a peak in 1990, even without the benefit of the stimulus from the Structural Funds. The effects of the fall in the savings ratio represents the response of consumers to the postpone-ment of normal consumption in the uncertain years of the 1980s.
The rate of inflation rises in 1990 and 1991 due, in part, to an acceleration in world inflation but also to the rapid growth in domestic demand (Figure 2). This rate of domestic inflation is initially stimulated by a rise in profit margins. However, by 1991 rising domestic costs play an increasing role. The rate of inflation falls from
1992 onwards, partly because of the effects of 1992 and partly due to the slow-down in the economy.
As a result of this economic resurgence, there is a substantial rise in employment over the period 1989-94 (82,000). However, the labour force also shows a large rise of 46,000 so that unemployment only falls by 37,000 (Figure 3). As a percentage of the increasing labour force unemployment falls from 16 per cent in 1989 to 12.7 per cent in 1994. The rise in the labour force reflects a reduction in emigration from its present exceptionally high level, due to the improved domestic labour market conditions.
The balance of payments surplus is boosted by the increase in transfers from the EC Structural Funds (Figure 4). This helps keep the surplus relatively unchanged over the five year period.
Vlll
growth in the volume of GNP, combined with repay-lnent of debt from 1991 onwards, is a fall in the debt/GNP ratio flom the 1988 level of around 135 per cent of GNP to under 85 per cent in 1994 (Figure 6).
BACKGROUND ASSUMPTIONS
Underlying our central forecast are a set of assnmptions concerning key external variables and the stance of domestic policy. In the case of the external variables we do not attempt to develop our own inde-pendent view of the medium-term prospects for the world economy. For this we rely on the work of a number of major international organisations.
World real growth over the 1990-94 period is assumed to be approximately 4 per cent per annum. The effects of 1992 account for around 1 percentage point of this growth in the latter part of our forecast period. After a world inflation rate of around 5 per cent this year, we assume inflation will fall, and will average 3 per cent in the medium tenn. We assume that the Irish pound maintains its parity in the EMS with the DM and that sterling and the US dollar depreciate slightly against the DM in 1990 and 1991.
With respect to the domestic economy there are certain key policy variables which can affect the fore-cast. Government expenditure and taxation instruments were generally indexed over the forecast period. This involves the maintenance of strict control on expendi-ture in the medium-term. However, the recently pub-lished National Development Plan departs from indexation of many public capital expenditures. Our assumptions reflect the details of the Plan. Since it is stated as government policy, we have also included some cuts in direct tax rates rather than strict indexation. The details of our assumptions conceruing the world economic environment and the likely stance of domestic economic policy are set out in Section 2 of this Review.
THE SOURCES OF GROWTH
The fact that a recovery has been underway in the economy for a number of years has, to some extent, been masked by the severe fiscal regime in force for much of the 1980s. With an end in sight to the cutbacks, a major stimulus to growth from the increased expenditure paid for by the EC Structural Funds, and a probable fall in the personal savings ratio, the underlying upward trend in GNP will be greatly accelerated in 1990. Thereafter, the rate of growth will fall gradually. Up to 1994 it will remain well above the trend growth experienced in the 1980s, more in line with the achievements of the 1960s and the 1970s.
From an average growth rate of 0.5 per cent a year in the period 1980-88 we forecast a growth rate of almost 5 per cent a year over the six years 1989-94. The primary factors underlying this turn-round of 4.5 percentage points are: the reversal in the outflow of debt interest due to the improvement in the public finances; the change in the fortunes of the building industry; the improved prospects for manufacturing industry. Underlying all these changes is the fall in real interest rates from their peak in the early 1980s. While these
MEDIUM TERM REVIEW: 1989-1994 factors are, in many ways, interrelated, this decom-position helps explain some of the key mechanisms driving the economic recovery.
The turn-round in the balance of payments which is, in turn, largely due to the improvement in the public finances, will make a major contribution to the econ-omic recovery forecast for the next five years. There will be a direct addition to growth of 1 percentage point a year from the slower growth in net factor income paid abroad, due primarily to the fall off in interest payments abroad.
The need for restrictive fiscal policy throughout most of the 1980s had an especially severe impact on
the building industry. However, due to the improved domestic environment arising from the fall in real interest rates and the increased expenditure from the EC Structural Funds, the downward trend in building will be reversed. Instead of being a major factor reducing the growth of GNP, as in the 1980-88 period, building will contribute significantly to growth from 1989 onwards. This factor accounts for 1 percentage point of the increase in the growth rate compared to the 1980-88 period.
As a result of the improved competitive position of the economy, dating back to at least 1986, the manu-facturing sector will grow more rapidly in the next five years than it did, on average, over the 1980-88 period. Even allowing for increased profit repatriations, this will contribute around 1 percentage point to the turn-round in the growth rate in the medium term.
The remaining 1.5 percentage points turn-round in the growth rate is due to the induced effects of the other changes on the market services sector of the economy. The increase in income and employment in the industrial sector increases domestic demand. The improvement in the government sector’s accounts sees an end to the very restrictive fiscal policy stance pursued for much of the 1980s. This, in turn, allows more of the benefits of increased output to flow to the household sector, raising consumption.
The fall in the savings ratio, while adding 1.7 percentage points to the growth rate in 1990, only adds around 0.1 percentage points to the average growth rate over the period to 1994. This is partly due to the fact that the savings ratio rises again over the 1992-4 period. It is also partly due to the fact that the increase in
consumption reduces investment and that this affects growth in the longer-term.
UNCERTAINTIES AND RISKS
The central forecast shows a robust economic recovery underway. However, it also highlights a number of new potential dangers any one of which could cause major problems in the medium term. It is important to stress that our central forecast is only one of a wide range of possible outcomes for the economy. While we feel that it is, on balance, the single most likely path for the economy in the medium term, it is vital to
SUMMARY ix
TABLE 1. : Central Forecast - Major Aggregates
GNP % Change
Balance of Payments, % of GNP
Exchequer Borrowing Requirement, % of GNP Debt / GNP Ratio
Total Employment (000) Unemployment Rate % Consumer Prices %
1986 1987 1988 1989 1990 1991 1992 1993 1994 -1.2 5.4 1.6 4.0 7.1 5.6 4.6 4.8 3.2 -3.1 1.3 2.3 3.0 2.6 2.4 2.8 2.4 3.1 -12.9 -10.0 -3.3 -4.0 -1.3 1.2 2.3 2.9 3.9 139.0 139.4 134.1 130.4 119.4 108.7 99.9 91.3 83.7 1081 1080 1086 1092 1112 1131 1145 1160 1174 17.3 17.7 16.6 16.0 14.6 13.4 13.0 12.8 12.7 3.9 3.1 2.0 3.3 4.2 4.2 3.5 3.0 3.5
FIGURE 1
REAL GNP GROWTH RATE
Annual Percentage Change
86 87 88 89 90 91 92
FIGURE 2
PRICE AND WAGE INFLATION
Annual Percentage Change
93 94
,... ..’"’’’’’"-.4
6 ,
"’’--...
2
0 i i i i i i i
86 87 88 89 90 91 92 93 94
Prices .... Wages
FIGURE 3
UNEMPLOYMENT RATE
Per cent of Labour Force
18
17
16
15
14
13
12
86 87 88 89 90 91 92 93 94
FIGURE 4
BALANCE OF PAYMENTS SURPLUS
Per cent of GNP
86 87 88 89 90 91 92 98 94
FIGURE 5
EXCHEQUER BORROWING REQUIREMENT
Per cent of GNP
150
86 87 88 89 90 91 92 93 94
Per cent of GNP
FIGURE 6
DEBT/GNP RATIO
140
130
120
110
100
90
80
X
The most obvious source of concern is the external environment on which our forecast crucially depends. Recent events, in particular the rise in international
inflation and the related rise in interest rates is a cause for concern. However, there has not been a significant increase in real interest rates. However, any additional changes which served to raise German (and hence Irish) real interest rates could substantially reduce the growth rate in Ireland.
The possibility of a very high growth rate in 1990 must accentuate fears of domestic profit induced inflation in 1990 and 1991. This possibility is the most
immediate domestic danger to the recovery of the economy in the medium tenn.
The timing and magnitude of the forecast rise in domestic inflation is uncertain. While the central pro-iection assumes that wage and price formation behav-tour over the next five years will be in line with the experience of the 1980s, a return to the pattern of behaviour of the 1970s could give a much stronger boost to domestic inflation. This would affect competitiveness and endanger our position within the EMS which would, in tuna, further aggravate the problems of the economy. If the projected growth in employment in the central forecast is to be safeguarded it is essential that such a vicious circle of domestic inflation should be averted.
While it is quite possible that the savings ratio will not fall as far or as rapidly as we forecast, it is also possible that it will fall further or even more rapidly. In the central forecast the rise in consumption will add to inflationary pressures in the economy. A more rapid increase could be quite serious. On the other hand, a slower rise in the volume of consumption would represent postponed rather than lost growth, while, at the same time, reducing inflationary dangers. Thus the risks in the medium term of differing outcomes on the savings ratio are not symmetrical.
Our central forecast is very sensitive to alternative assumptions about profit repatriation. If domestic firms were to perform worse than we have assumed, with greater reliance on the contribution from multinationals, the growth rate in the medium-term would be signifi-cantly reduced. The uncertainty about the rate of profit repatriation highlights the potential benefit to be gained from a greater reliance on growth in domestic industry. The possibility that the expenditure under the Structural Funds may be slower to build up and may turn out to be lower than envisaged in the National
Development Plan must be recognised. The appropriate
policy response and the need to consider the detailed provisions of the National Development Plan in this light, and in the light of the potential for domestically generated inflation, are discussed in detail in this
Review.
Finally, there is uncertainty about the effects of 1992 on the EC and, hence, on the Irish economy. We estimate that the growth rate in the 1993-94 period would be approximately 0.75 per cent lower if this boost were not to materialise or if it were delayed. In addition, the magnitude of the boost to EC growth from this source
MEDIUM TERM REVIEW: 1989-1994 is still very much a matter for debate. This highlights the uncertainty about the growth rate in the medium-term.
Taken together these uncertainties highlight the need for caution in formulating public policy. While a strong recovery is undoubtedly under way there are many dangers facing the economy in the medium term. The experience of the last ten years shows that mistakes in economic management tend to feed on themselves while the benefits of prudence also tend to multiply.
POLICY IMPLICATIONS
Facing into the 1990s the combination of the econ-omic recovery with the increase in the EC Structural Fund payments will provide an opportunity to tackle the deep-seated structural problems of the economy. This combination of circumstances may not be repeated again and, as a result, it is vital that good use is made of them. Over the last eight years policy makers had to concentrate on the pressing problem of the debt. It is now time that horizons be broadened to consider how best to deal with the longer-term problems of the economy, in particular unemployment. The improved environment does not mean that immediate or easy answers are possible but it lays the foundations for steady progress up to the end of the decade.
In the short term it is clear that the economy is growing very rapidly and does not need any stimulus from fiscal policy. In fact there is an urgent need to prevent a build-up in domestic inflationary pressures. In Section 6.3 of this Review we deal with this issue in detail.
In the medium-term it is vital that the opportunities presented by the economic recovery are not wasted. Policies are needed to deal with the major structural problems facing the economy. In Section 6.4 we discuss some of the key issues. The EC Structural Funds must be used to fund investment which will produce a lasting growth in domestic output. There is a need to reconsider policies for industrial development, education and training, tax reform, and tackling unemployment and poverty.
Until now the objective for the public finances was quite straightforward. However, with the EBR moving into surplus in 1991 or, at the latest, in t992, the need for a longer-term policy on the public finances is pressing. While it is of considerable importance to cut our level of national debt to reduce the potential expo-sure of the economy to world financial problems, it is important to view the public finances in a wider context. While there is no prospect that increasing debt will be a profitable policy in the future, there is an issue as to how rapidly the debt should be repaid.
SECTION 1
GENERAL INTRODUCTION AND REVIEW
1.1 GENERAL INTRODUCTION
The Role of the Medium-Term Review
This Medium-Term Review fulfils a number of different roles. First, it aims to provide a guide to how the Irish economy will develop over a longer time horizon than is normal for economic forecasts. Such forecasts are needed by those who have to plan for more than a single year ahead. Secondly, it permits us to explore the implications of current economic policies within a wider time frame than is usual. This is especially important when examining the effects of policies which affect the supply side of the economy, such as the recently published National Development
Plan. Thirdly, it provides a testbed to evaluate how
policy might be changed to meet evolving economic problems and needs. In the case of this Review, we have pushed our forecasts forward to 1994, covering the first years of the completed EC internal market (1992). While the full effects of 1992 will take a long time to work through, the first consequences are already being felt in Ireland.
In preparing such a forecast we are conscious that events rarely turn out exactly as forecast. As a result, it is useful to explore the sensitivity of our central pro-jection to alternative assumptions concerning key economic variables. This serves to highlight the importance of initial assumptions in determining the final forecast, and also allows readers to evaluate the extent to which the forecast may be disproved by the changing scene at home and abroad. In addition, we have separated out the effects of the National Development
Plan and of 1992, two crucial new factors affecting the
Irish economy over the next five years.
The ESRI economic model, HERMES, was used to carry out this analysis in a consistent manner1. In preparing the central forecast we have experimented with a range of different assumptions concerning vari-ables such as the savings ratio and the rate of profit repatriation. The results of some of these tests are described in the text.
Background
The Irish economy is in a period of transition. To date in the 1980s there has been a pressing need for drastic fiscal measures to stem the outflow of interest payments arising from the evergrowing foreign debt. The initial response to this problem was to raise tax rates
and to cut the rate of increase in public expenditure. In spite of the severe impact of the rise in world interest rates in the first half of the 1980s, this policy response effected a reduction in the Exchequer borrowing requirement up to 1985. By early 1986, when the ESRI’s first Medium-Term Outlook was published, we foresaw a turn-round in the public sector fiscal imbalance. However, fiscal policy faltered that year in the face of an unexpected decline in the world rate of inflation. This postponed the eventual recovery in the public finances by twelve months.
Against the background of a minority government since March 1987, public policy has proceeded with fairly broad support from across the main political parties. The need for a continuation of the policy of fiscal retrenchment was recognised and wide-scale cuts in public expenditure and in the level of publicly provided
services m health and education were passed by Daft Eireann. When we published our second Review at the end of 1987 we forecasted that the public finances would come under control by 1989 and that there would be less need for further cuts. As these fiscal problems are coming under control, the agenda of public policy has widened and now embraces issues which, of necessity, were neglected during the last few years. This Review takes up some of these issues.
While the prospects for the medium term appear better now than they did even in our last Review, the central forecast presents both a number of new problems for policy and the seeds of new opportunities for future growth. In the light of our analysis, we discuss in detail in Section 6 of the Review how current policy needs to be changed and how, looking to the end of the century, new/policy initiatives will be required. In particular, the problems posed for the economy by 1992 and the opportunities provided by the increase in EC Structural Fund payments are considered.
While the problem of the public finances is coming under control we are still left with the primary underlying problem in the Irish economy, the high level of unemployment and of renewed emigration. Here the solutions are not so obvious and opinions differ as to how public policy should face up to a scale of emigration not previously encountered since the late 1950s. The recently published National Development Plan
1989-1993 comments that the Irish labour market is "not
particularly encumbered by regulation" and identifies the problem of unemployment as arising from a low
MEDIUM-TERM REVIEW: 1989-1994 TABLE 1.1: Comparison of Forecasts for GNP Growth Rate
1986 1987 1988 1989 1990 1991 1992 1993 1994
Review 1986 2.5 3.3 3.5 3.0 3.0
Review 1987 -0.4 3.0 3.3 3.7 3.6
This Review 4.0 7.1 5.6 4.6 4.8 3.2
Latest Estimate -1.3 5.1 1.6
Source: 1986 and 1987 are National Income & Expenditure data from the CSO. The data for 1988 are from the April 1989 issue of the QEC.
demand for labour due to "inadequate output growth and to structural characteristics of the economy". Conse-quently, if in the future the economy is to generate a demand for labour sufficiently great to reduce numbers unemployed to the levels of the 1970s then in addition to boosting growth, these "structural characteristics" must be altered.
Ireland’s future economic environment is now paradoxically characterised at once both by great cer-tainty and uncercer-tainty. The cercer-tainty concerns the knowledge that the completion of the internal European market is under way and scheduled to take full effect by end 1992. The Irish economy will by then have emerged perforce from behind what little shelter remains from the rigours of international competitive forces and will be fighting for its place in the post-1992 market place. The uncertainty concerns the performance of our economy when faced with these new forces even though the transition to the new competitive environment will be assisted by large-scale transfers of investment capital from expanded Structural Funds.
These issues provide our present Review with its main themes: preparing for 1992 and tackling the unemployment problem and its accompanying maldis-tribution of income. The policy dilemma will be the reconciliation of the need for economic efficiency with the desirability of social equity or, in the phrase of Alan Blinder in his recent analysis of US policy options, the need for "hard heads and soft hearts".
The Organisation Of The Review
Following a review of past developments in the remainder of this Section, Section 2 sets out the baseline assumptions which underlie our central forecast. There is a remarkable find untypical unanimity among the international forecasting agencies upon which we have based our view of the world economy. In addition, we l~ave incorporated the findings of the Cecchini Report on the impact of the completion of the European internal market. The domestic policy assumptions are made in the light of the stated views of the Government on future fiscal actions and on the recently published National
Development Plan. For both 1988 and 1989, the
pro-jected outturns are broadly aligned with those published in the April 1989 Quarterly Economic Commentary.
Section 3 presents and discusses our central forecast fox" the period 1989 to 1994 on the basis of the above
assumptions. The preparation of this forecast has been based on the use of the ESRI’s medium-term model of the Irish economy.
In Section 4 we carry out a detailed analysis of the recently published National Development Plan. This document describes the use to which the expanded EC Structural Funds will be put and provides our key assumptions for handling public sector capital expenditure over the coming years.
The effects of completing the EC internal market
(1992) are examined in Section 5. Here we attempt to
provide a preliminary analysis of how the 1992 process will impact on the Irish economy, an analysis already performed by Cecchini for the larger EC economies.
Finally, in Section 6 we consider whether our fore-cast warrants changes in current policy and we attempt the very hazardous task of looking beyond our self-imposed five-year time horizon of 1994. This is not something we have done before but the advent of 1992 and the long-tailed consequences of the Structural Fund projects makes it necessary to look further than 1994,
albeit in a qualitative fashion.
1.2 REVIEW
The 1986 and 1987 Medium-Term Reviews
Before reviewing the progress of the Irish economy over the recent past it is useful to consider how our view of the prospects for the economy has evolved over time. In the first Review, published at the beginning of 19862, and again in the second issue at the end of 19873, we consistently expressed the view that, while painful in the short term, fiscal retrenchment would pay dividends within two or three years. As shown in Table 1.1, as long ago as 1986, we forecast a return to growth of over 3 per cent in 1989 and 1990. Again in our 1987 issue we foresaw an average growth in the medium term of around 4 per cent. This picture was generally charac-terised at the time of publication as being overoptimistic. However, the outturn suggests that we were unduly pessimistic and in this Review we have further revised upwards our estimate of the medium-term growth rate to around 5 per cent.
2 Medium-Term Outlook: 1986-90, by Peter Bacon.
GENERAL INTRODUCTION AND REVIEW
Where we have been less successful has been in forecasting the turning point. Identifying turning points is made even more difficult by events such as the recent tax amnesty. At the end of 1987 we greatly underesti-mated the growth in 1987 and 1988, expecting the recovery to begin in 1989. It now appears that the turning point occurred in 1987 and the underlying growth in the economy has continued at a high level since that date. These problems in forecasting the turning point in economic growth have been repeated by all the other forecasts prepared at the same time.
This highlights some of the problems facing policy makers. It is dangerous to make plans which depend too heavily on a specific economic outcome in the short term. What is necessary is first, to formulate plans to deal with the structural problems of the economy which only change slowly over time and secondly, to formulate policy in a flexible way so that it can adapt to rapidly changing short-term conditions. With this in mind we review the past performance of the economy to help identify what are the key problems which will arise over the next five years.
A Retrospective View
In the real world there is always a pressing need to focus on the "here-and-now" at the expense both of the past and the future. Any economic commentary carries with it an implicit time frame over which relevant changes occur. For example, when talking about exchange rates, interest rates or the valuation of equities, this time frame may be as short as a few days, hours, or even minutes. Movements in commodity markets are usually discussed in a frame of weeks or months. The effects of fiscal policy, ignoring instantaneous announcement effects, operate over months or a couple of years. However, when examining the process of economic growth, the appropriate time frame can be decades.
In this section we take a look at some aspects of the evolution of the Irish economy over the period 1966 to 1989, i.e., up to the start of our medium-term forecasting period of 1989-1994. The data up to 1987 are compi-lations from the CSO, while for the last two years we use the most up-to-date short-term forecasts available at the time of writing. Our purpose in presenting this material is to set the central forecast for the period 1989-1994 (treated in detail in Sections 2 and 3 below) in context since our projections for the future behaviour of the economy depart considerably from the pattern which characterised the last few years. Needless to say history seldom repeats itself exactly so such a retro-spective examination can at best be suggestive as to future possibilities and, at worst, could be grossly misleading.
The Pattern of Aggregate Growth
It is well known that the pattern of growth in Ireland (Figure 1.1) tends to track the pattern of growth in the international economy, particularly in the economies of our main trading partners.
FIGURE 1.1
REAL GROSS NATIONAL PRODUCT Percentage Change
8
6
4
2
0
-2
-4
66 70 75 80 85 89
FIGURE 1.2
NET FACTOR INCOME FROM ABROAD Percentage of GNP
2
0
-2
-4
-6
-8
-10
-12
-14
66 70 75 80 85 89
High growth characterised both the world and the Irish economies in the pre-OPEC era. A strong recovery after 1975 peaked in a growth rate of 6.1 per cent in 1978 (equal to the previous highest level attained in 1968). With the on-set of the OPEC-II oil price rises in 1979 and the subsequent world recession, the economy faltered and a period of unstable, mainly negative, growth followed for the years 1982 to 1986. Some of the reasons for the recovery of 1987-89 were treated in the last issue of the Review and in Section 3 below we consider the issue of how sustainable this recovery is likely to prove.
However, movements in GNP concealed two pat-terns in its subcomponents, namely Gross Domestic Product (GDP) and net factor payments fi’om abroad. The latter moved steadily towards a large outflow (Figure 1.2) driven by large-scale repatriation of profits by foreign multinational firms and by rapidly escalating foreign debt interest payments.
4
Living Standards
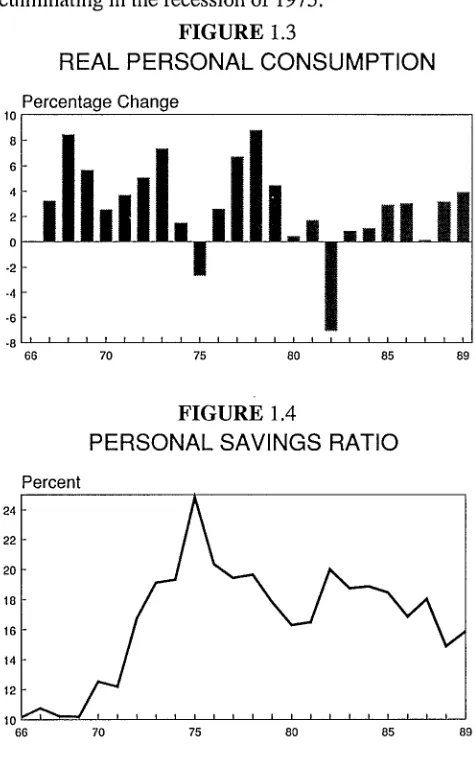
[image:14.583.41.279.120.500.2]In many ways the pattern of real household con-sumption (Figure 1.3) mirrored movements in GNP, the period of high and sustained growth from 1967 to 1972 cuhninating in the recession of 1975.
FIGURE 1.3
REAL PERSONAL CONSUMPTION
Percentage Change
10
8
6
4
2
?0
-8
66 70 75 80 85 89
MEDIUM-TERM REVIEW: 1989-1994 period was a key factor in explaining the changes in the incidence and composition of poverty. Thus the low or negative aggregate consumption growth over the 1980s appears to have been distributed in an uneven fashion.
The Role of the Public Sector
In Figures 1.5 and 1.6 we show the pattern of growth in real public consumption (mainly wages and salaries in public administration, health and education) and the share of public consumption in overall GNP.
FIGURE 1.5
REAL PUBLIC CONSUMPTION Percentage Change
10
8
6
4
FIGURE 1.4
PERSONAL SAVINGS RATIO
24
22
20
18
16
14
12
10 66
Percent
70 75 80 85 89
There followed four years further growth, the highest being the record 8.8 per cent achieved in 1978. This came to an abrupt halt in 1979 and, thereafter, growth has been at an historically tow level4.
Movements in the personal savings ratio are shown in Figure 1.4.
The ratio rose sharply in the early 1970s to a temporary peak in 1975. There was a subsequent fall during the boom years of the late 1970s with a rise to a new high-point in 1982 at the onset of a recession in the domestic economy. Since then there has been a limited reduction to its current level.
Behind these somewhat anodyne national account-ing aggregates there were significant shifts in the distribution of income. A recent study by the ESRIs found that the percentage of people below a wide range of relative income poverty lines increased between 1980 and 1987. The marked rise in unemployment over the
66 70 75 80 85 89
FIGURE 1.6
SHARE OF PUBLIC CONSUMPTION IN GNP Percent of GNP
22
2O
18
16
14
12 66
I I [ I ~ I I I 1 I I I I I I I I I I I I I
70 75 80 85 89
The robust growth of the years before 1980 is apparent, when the public sector’s share of GNP rose from 13 per cent to a peak of 21 per cent in 1982. The main explanation for this pattern was the rise of public sector employment numbers (Figure 1.7), from the 1966 level of under 11 per cent of total employment in the economy, to a peak of just under 19.5 per cent in 19856. The subsequent decline after 1985 followed explicit policy decisions to shed labour in the public sector as part of a general package of fiscal cut-backs.
4 It should be noted that the consumption data are derived as a residual in the Irish National Accounts and carries the brunt of revisions and en’ors in other categories. The years 1975 and 1982 are particularly suspect.
5 Poverty and the Social Welfare System ill b’eland, published by the Combat Poverty Agency, 1988.
GENERAL INTRODUCTION AND REVIEW
FIGURE 1.7
PUBLIC SERVICES EMPLOYMENT
Percent
24 22
20
.+
.. ..
..""
10 11111111111~1111911111
66 70 75 80 85 89
-- % Total Employment .... % Market Employment
The Exchequer borrowing requirement (EBR)
moved into deficit in 1969 and this deficit rose to almost 16 per cent of GNP in 1981 (Figure 1.8)7.
FIGURE 1.8
EBR AND BALANCE OF PAYMENTS
Percentage of GNP
0
-5
-10
-15
-20 I i I i i p i i i i i i i i i i i i i i i i 66 70 75 80 85 89
-- EBR ... Bal of Payments
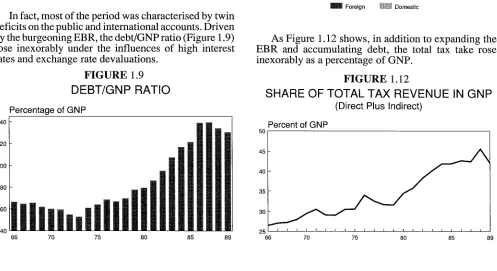
[image:15.589.307.544.135.507.2]In fact, most of the period was characterised by twin deficits on the public and international accounts. Driven by the burgeoning EBR, the debt/GNP ratio (Figure 1.9) rose inexorably under the influences of high interest rates and exchange rate devaluations.
FIGURE 1.9 DEBT/GNP RATIO
Percentage of GNP
140
120
100
8O
6O
40
An increasing portion of the national debt was denominated in foreign currencies (Figure 1.10), the interest payments on which were a direct outflow from the domestic economy (Figure 1.11).
FIGURE 1.10
FOREIGN & DOMESTIC DEBT/GNP RATIOS
Percentage of GNP
160 140
120 100 8O 60
40 2O 0
66 70 75 80 85 89
mm Foreign ~ Domestic
FIGURE 1.11
FOREIGN & DOMESTIC DEBT INTEREST
Percentage of GNP
10
8
6
4
2
0
66 70 75 80 85 89
m Foreign ,t~t~ Domestic
As Figure 1.12 shows, in addition to expanding the EBR and accumulating debt, the total tax take rose inexorably as a percentage of GNP.
FIGURE 1.12
SHARE OF TOTAL TAX REVENUE IN GNP
50
45
4O
35
30
25
66 70 75 80 85 89 66
(Direct Plus Indirect)
Percent of GNP
i i i F i i i i i i ~ i i i i i i i i i i i
70 75 80 85 89
[image:15.589.49.546.496.767.2]6
This was a result of explicit increases in direct and indirect tax rates as well as a failure to index the direct tax system when it was buffeted by the high and unstable inflation of the late 1970s and early 1980s. The actual curtailment of tax increases, facilitated by the reduction in total public sector current spending (i.e., public consumption as well as transfer payments) did not come until the mid-1980s, driven by explicit fiscal cuts and assisted by falling world interest rates (Figure 1.13).
FIGURE 1.13
TOTAL CURRENT GOV REVENUE & EXPENDITURE Percentage of GNP
56
51
46
41
36
31
26 66
MEDIUM-TERM REVIEW: 1989-1994 in the long run for open economies like Ireland, this highlights the fact that it is not price competitiveness but rather cost competitiveness that is important for the Irish trading sector. In Figure 1.15 we compare Irish consumption price inflation with industrial wage inflation.
FIGURE 1.15
PRICE AND WAGE INFLATION IN IRELAND Percentage Change
30
25
20
15
10
5
0 66
ii11111[11111111111111
70 75 80 85 89
... Consumption Prices ~ Industrial Wages
... Current Revenue ~ Current Expenditure
Inflation Here and Abroad
In seeking explanations for the en’atic performance of the economy an obvious question to ask is "did we inflict a major loss of competitiveness on ourselves through inflating faster than the rest of our trading partners"? In Figure 1.14 we show the inflation rates of the price of Irish consumption goods together with a weighted average of world producer price inflation (in Irish currency tertns).
FIGURE 1.14
IRISH AND WORLD INFLATION (Industrial Output Prices)
40
30
20
t0
0
-10 67
Percentage Growth
IIIIIIIl1111111111~11
70 75 80 85 89
irish ... World
With some differences in timing following on the OPEC price shocks, no significant deviation between Msh and world inflation is apparent8. Given that pur-chasing power parity (or the "law of one price") holds
Although running higher than price inflation for most of the period since 1966, the share of added-value in industry (the exposed trading sector) remained rela-tively static (with an upward blip in 1974) and has declined steadily since 1980 (Figure 1.16).
FIGURE 1.16
LABOUR SHARE OF ADDED-VALUE IN INDUSTRY
0.8
0.7
0.6
0.5
Fraction of Added-Value
0.4 i I I I I i i i i I I I I i t ~ I ~ ~ ~ ~ I 66 70 75 80 85 89
Part of the explanation lies in the changing com-position of the industrial base (as capital and R&D intensive modem firms displace labour intensive traditional firms)9. However the low level of pay awards in recent years has contributed as well. Such a decline in labour’s share is mirrored by an equivalent rise in the profit share of added-value, and serves to explain some of the phenomenally high industrial export growth of recent years. This is a point to which we will return in the discussion of our central forecast in Section 3 below. 8 See T. Callan and J. Fitz Gerald, "Price Determination in Ireland: Effects of Changes in Exchange Rates and Exchange Rate Regimes", The Economic and Social Review, Vol. 20, No. 2, January 1989, for a detailed study of price transmission mechanisms.
GENERAL INTRODUCTION AND REVIEW The External Account
For the period up to 1986 the Irish balance of international payments was in deficit (Figure 1.17).
FIGURE 1.17
BALANCE OF TRADE & INT PAYMENTS
15
10
5
0
-5
-10
-15
-20 66
Percentage of GNP
’,.."
I I q I I I I I ~ t I I I I I I I I I ~ I I
70 75 80 85 89
... Trade Balance Balance of Payments
The years 1979 to 1982 saw these deficits reach almost 14.5 per cent of GNP, but from 1983 the deficit reduced rapidly and passed into a surplus in 1987, for the first time since 1967. This surplus is now at around 3 per cent of GNP, driven mainly by a strongly growing surplus on the balance of trade which more than offsets the rising profit repatriations and foreign debt interest flows abroad. Since 1966 both exports and imports have been growing as a share of GNP (Figure 1.18), reflecting the increasing openness of the economy, particularly since Ireland became a member of the EC in 1973.
FIGURE 1.18
SHARES OF EXPORTS & IMPORTS IN GNP Percentage of GNP
80
70
60
50
40
3O
66 70 75 80 85 89
-- Exports .... Imports
We return to this issue, i.e., the emergence in recent years of what could almost be termed a "structural" surplus on the international account, in our discussion of our central forecast in Section 3.
The Labour Market
It is well known that the Irish and UK labour markets are closely linked through migration flows and, at least prior to the break with sterling in 1979, through wage
and price inflation transmission. Figure 1.19 shows that the evolution of the Irish and British rates of unem-ployment followed each other closely prior to 1976.
FIGURE 1.19
IRISH & BRITISH UNEMPLOYMENT RATES Percent of Labour Force
20
15
10
0 66
. ... -.. ... ..’’""
I I I I 1 I ~ I I I I I ~ I I I I I I I L I
70 75 80 85 89
Ireland .... Great Britain
Other things being equal, the difference between these rates should be relatively stable. As Figure 1.20 shows, advances were made in closing the unemploy-ment "gap" during the period 1975 to 1981 but the "gap" has widened sharply since then, reaching an historical high of over 7.5 percentage points in 1987, but falling to 6.2 points by 1989l°.
FIGURE 1.20
IRISH-BRITISH UNEMPLOYMENT DIFFERENTIAL Percentage Points
8
66 70 75 80 85 89
The corresponding movements in emigration flows and population growth are shown in Figure 1.21.
After a period of net inward migration from 1971 to 1979, outward migration has resumed in the 1980s and has now reached levels similar to the period preceding
The First Programme for Economic Recovery of the
1950s and early 1960s.
The migration mechanism lies at the centre of any discussion of functioning of the Irish labour market. If outward migration flows to the UK had not been facilitated in recent years by high growth in the UK, then the behaviour of the labour market would have been very different. In the presence of a weak demand for labour in industry and marketed services, the structural decline of employment in agriculture, the cessation of
FIGURE 1.21
EMIGRATION & POPULATION CHANGE
Thousands
60
0
20 ..
0
-29
-40 i i i i i i [ t t I I I I I ~ I ~ I I I I I 66 70 75 80 85 89
... Net Emigration ~ Population Change
MEDIUM-TERM REVIEW: 1989-1994 FIGURE 1.23
SECTORAL EXPORT SHARES
8O
6O
4O
20
Percentage of Total Exports
0 i i i i i i i i i [ [ i i I I i i i i I i I 66 70 75 80 85 89
Industrial ... Agricultural ----" Service
employment growth in public services and the relatively high natural growth in population have served to keep the rate of unemployment at a high level. A further serious aspect of the composition of unemployment is the increasing proportion of the long-term unem-ployed11.
Sectoral Issues
In the period since 1966 the relative importance of the main sectors of the economy has changed dramati-cally. Figures 1.22 and 1.23 illustrate how the agricul-tural sector has declined in importance as an employer of labour (down from 32 per cent of total employment to 14.5 per cent) and as a producer of goods for export.
FIGURE 1.22
SECTORAL EMPLOYMENT NUMBERS
450
400
350
300
Thousands
250
200
150
100 iiiiiIllllllllllllllll
66 70 75 80 85
f~ / J
.
[image:18.585.303.543.77.507.2]89
FIGURE 1.24
CAPITAL INTENSITY & REL. FACTOR PRICES
Indices : Base=l in 1966
3.4
2.9
2.4
1.9
1.4
0.9 66
i i i I i I I I I i i i I [ i i i i ~ I I I
70 75 80 85 89
[image:18.585.39.546.365.762.2]Capital/Lab Ratio ... Wages/Cost Capital
FIGURE 1.25
INDUSTRIAL PROFIT REPATRIATION
Percent
50.9
40.9
30.9
20.9
10.9
0.9111111111111[11111
70 75 80 85 89
Industry ... Agriculture ----" Market Services ~ % Of Profits ... % Of Exports
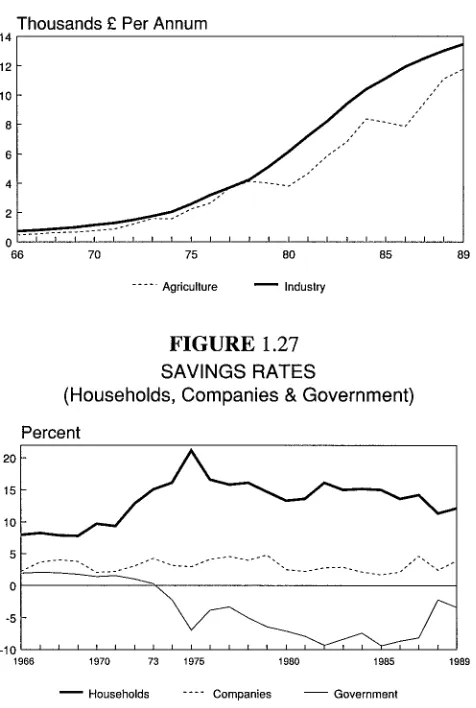
GENERAL INTRODUCTION AND REVIEW FIGURE 1.26
EARNINGS:INDUSTRY & AGRICULTURE (Average Annual Per Employed Person) Thousands £ Per Annum
14 12 10
8 6
4 2 0
66 70 75 80 85 89
[image:19.589.47.285.96.450.2]... Agricullure ~ Industry
FIGURE 1.27 SAVINGS RATES
(Households, Companies & Government) Percent
15
10
-5
-10
1966 1970 73 1975 1980 1985 1989
-- Households .... Companies -- Government
Industrial employment has fluctuated between a low of 27 per cent and a high of 32 per cent under the influence of cycles in the world economy. The pre-dominance of industrial exports is apparent from Figure
9 1.23 and, when takeh with the employment data, indicates massive rises in labour productivity over the period. The share of marketed services employment shows a pattern of fairly stable growth, from 30 per cent of the total in 1966 to its current 1989 share of over 40 per cent.
The employment behaviour of the industrial sector can be partly explained by Figure 1.24.
The steady rise in the cost of labour relative to the cost of capital was reflected in a corresponding increase in the capital intensity of production. This came about to some extent as a result of the Irish industrial policy of attracting multinational firms to the country by a combination of generous capital incentives and low corporate tax rates. One of the results of the gradual dominance of the industrial sector by foreign multi-nationals was the rapid rise in outflows of repatriated profits through the balance of payments (Figure 1.25, but refer also Figure 1.2 above).
In the agricultural sector, income per capita increased over the period but in a more erratic fashion than for industrial earnings (Figure 1.26).
The diminishing size of the agricultural sector and its progressive curtailment through quantity restrictions under the EC CAP, was a serious impediment to national growth because of the very high added-value generated within the sector and its links with the food processing
sector of industry.
Finally, turning to the financial aspects of the economy, Figure 1.27 shows the evolution of savings by the household sector, the corporate sector and the public sector, all expressed as a percentage of GNP.
SECTION 2
BASELINE ASSUMPTIONS
Underlying our central forecast for the Irish econ-omy are a set of assumptions concerning key external variables and the stance of domestic policy. In the case of the external variables we do not attempt to develop our own independent view of the medium-term pros-pects for the world economy. For this we rely on the work of a number of major international organisations. With respect to the domestic economy there are certain key policy variables which can affect the forecast. These include fiscal and monetary policy. Generally, the other domestic forces driving the economy, such as prices, output growth and employment, are jointly determined by the external assumptions, by the behaviour of the millions of individuals who make up the economy, and by domestic policy. This section sets out our assump-tions concerning the world economic environment over the next five years and the likely stance of domestic economic policy.
2.1 THE WORLD ECONOMIC OUTLOOK
In preparing our forecasts for the rest of the world we have relied heavily on a number of different sources: the OECD Economic Outlook published in December
1988; the National Institute Economic Review, February 1989; the London Business School Economic Outlook
1988-1992, February 1989. In deriving our assumptions
we have been handicapped by the fact that these sources do not forecast directly certain variables of importance to us in forecasting the behaviour of the Irish economy1. As a result, it was not possible to take any one set of external forecasts. Rather we had to blend the many different sources in order to develop our own set of assumptions with care to ensure their internal con-sistency.
Output
The last three years have seen a sustained high rate of growth in a number of major world economies, principally the UK and the United States. The rate of
growth has consistently exceeded the expectations of the major forecasters. However, due to capacity con-straints in a number of key economies, it is clear that this favourable set of circumstances cannot continue indefinitely. These capacity constraints have manifested themselves in increasing inflationary pressure.
In addition to the problems posed by capacity con-straints, a major factor overhanging the future prospects for the world economy is the problem of the fiscal and balance of payments problems of certain countries. The size of the US balance of payments and government deficits is such as to put major strain on world financial markets. In a smaller economy the deficits might be readily manageable. However, their absolute magni-tude, as distinct from their share of US GNP, involves a continuing major transfer of world savings to the US. While current proposals for the US budget for the next fiscal year do involve a significant reduction in gov-ernment borrowing, the optimism of the underlying forecasts on which the proposed budget is based gives cause for concern. In the past, we have seen in Ireland how overoptimistic forecasts contributed to major budgetary overshoots.
For the future, we have assumed that the US does in fact make slow progress towards correcting its fiscal imbalance and that this will contribute towards a sol-ution of its balance of payments problem. This soft
landing scenario is widely adopted in other international
forecasts. The slow improvement in the balance of payments will involve continued growth in US exports and industrial output2, while domestic demand grows much more slowly than in the recent past.
In the case of the UK it is the size of the balance of payments deficit, together with the rising rate of infla-tion, which is worrying. The policy action taken to deal with these twin manifestations of overheating is aimed at reducing domestic demand. When combined with the recent loss in competitiveness, it implies a much slower growth in UK industrial output in the immediate future.
Elsewhere we follow the international forecasters in assuming a slowdown in world growth in the short term. For the medium term, from 1991-94, we have adopted the forecast of NIESR of an underlying 3 per cent a year growth in industrial output in the OECD countries. As discussed in Section 5, we have adjusted this growth rate for 1992 and subsequent years to take account of the effects of the completion of the EC market. This results in a forecast growth in world industrial output in 1994 of approximately 4 per cent. This forecast for the rise in world output over the 1990-94 period is broadly in line with the forecast of the London Business School.
1 For example, the ESRI model used in this exercise sees the profit rate in the UK, Germany, and the USA as an important determinant of domestic industrial output.
12
This represents a similar world environment for the Irish economy to that experienced, on average, in the 1984-88 period.
Prices
Following on a period of very low inflation there has been a change in trend over the past year. The price of oil, which fell drastically in real terms in 1986, has risen considerably in recent months. To some extent, this change in trend is due to special factors in the North Sea and Alaska. However, we have adopted a forecast growth in oil prices, in dollar terms, of 7 per cent a year from 1990 onwards, well above the rate of inflation for other goods.
The consequence of the fall in oil prices was a significant deflationary stimulus to world prices in 1986 and 1987. The opposite is the case with the recent rise in oil prices. However, there are many other factors affecting the world price level, not least the level of capacity utilisation, discussed above. Together these factors will result in a rate of growth of the world price for manufactured goods, measured in EMS currencies, of around 5 per cent this year. In line with the latest international forecasts for the world economy, we have assumed an underlying 3 per cent rate of inflation for manufactured goods in the medium texan. Current trends suggest that this may be unduly optimistic for 1990, but the need to adopt a consistent set of forecasts for the rest of the world means that it is not desirable to vary the assumption for prices in one year without recalculating the assumed growth in other key international variables. As discussed later in Section 5, we have modified the underlying rate of inflation in the medium term to take account of the effects of 1992. This imparts a downward bias to prices from 1991 onwards.
The rate of inflation implied by these global assumptions will obviously vary from country to country. In the case of the UK, the current relatively high rate of inflation, compared to the EMS countries, is partly due to overheating but is also a result of a lagged adjustment of the UK price level to the depreciation of sterling in 1986. With an assumed renewed depreciation of sterling by the end of 1991, discussed below, the medium term world rate of inflation of 3 per cent is consistent with a somewhat higher trend in the UK over the next two years.
We have assumed that agricultural prices grow at the same rate as the price of world manufactured goods. While the pressures emanating from the GATT negotiations for a freeing of trade in agricultural produce should tend to reduce prices, we have assumed that this will be counteracted by internal forces within the EC. In particular, the need to abolish MCAs, consequent on
1992, will impart an upward bias to agricultural prices
affecting Irish farmers. The net result is a 3 per cent a year increase in prices to 1994.
Competitiveness
The future prospects for the Irish economy will depend not just on world growth, but also on the trend in domestic costs compared to costs in other competing countries. Research has shown that Irish industry tends to be a price taker on world markets. As a result, firms
MEDIUM-TERM REVIEW: 1989-1994 do not normally compete on price. Instead, whether firms grow or decline depends on how profitably they can produce at the going world price. Many factors affect competitiveness and, as a result, it is difficult to make suitable international comparisons.
The most readily available variable for international comparison is wage costs in the major economies. As shown in Figure 2.1, Ireland improved its competitive position compared to both Germany and the UK in the 1986-87 period. The improvement vis-d-vis the UK will continue until 1990. However, international forecasts suggest a slow down in the rate of growth in wage rates in the UK thereafter, while we see wage rates rising more rapidly in Ireland in 1991. Thus, on the yard stick of wage rates, the improving competitive position of the late 1980s will be reversed in the early 1990s.
FIGURE 2.1
1.5
TRENDS IN INTERNATIONAL WAGE RATES Index Base 1986=1
1.3
1.1
0.9
0.7
0.5 8O
// //
// i
82 84 86 88 90
.... Germany ~ Ireland ---- United Kingdom
However, wage rates are only one factor in the competitiveness calculus. In terms of wage costs per unit of output the trend in the medium term will be more favourable. In addition, there has been a major improvement in the competitiveness of the Irish econ-omy over the last five years due to the fall in real interest rates. The improvement in this aspect of Ireland’s cost structure has had indirect benefits in terms of lowering the cost of state services provided by heavily indebted semi-state companies. Among the other factors affec-ting competitiveness, the substantial improvement in telecommunications has brought the business infrastructure closer to international standards.
Exchange Rates
The assumptions about exchange rates are intimately related to the assumptions about interest rates which are, in turn, closely related to assumptions about rates of inflation. While short-term forecasts normally assume unchanged exchange rates, such a simplification is not realistic when dealing with a forecast over a five-year time horizon. The overhang of deficits (and surpluses) in major economies suggests that the bilateral current rates of exchange cannot remain unchanged indefi-nitely.
BASELINE ASSUMPTIONS
sterling from 1992 to 1994. The current rate of exchange in the UK is being maintained by means of a big interest rate differential between sterling and DM deposits.
This high interest rate policy is designed to control inflation in the UK in two ways. Over time, it directly reduces the level of demand and the degree of over-heating. Indirectly, by keeping the exchange rate parity high vis-~t-vis the DM, it squeezes profitability and operates directly on the UK price level. When the rate of inflation comes under control it will be possible to ease this tight monetary policy, resulting in our assumed limited depreciation in sterling vis-gt-vis the DM. While we are uncertain as to the precise timing of this change, the likelihood of such a depreciation in the medium term increases with the continuation of balance of payments deficits.
In the case of the dollar we have assumed a very similar pattern of depreciation vis d vis the EMS currencies. The need to control inflation and depress domestic economic activity has resulted in US interest rates being consistently higher than DM rates in the last few years. The need for a tight monetary policy has been accentuated by the failure to take radical action on the problem of the continuing US government deficit. However, if US domestic demand slows as expected, and if the Administration is successful in reducing the deficit, it should be possible to relax monetary policy in 1990 or 1991. The resulting depreciation of the dollar will help speed the adjustment in the US balance of payments.
We have assumed that the Irish pound maintains its current parity in the EMS vis-d-vis the DM up to the end of our forecast period. The continuation of a balance of payments surplus, and the radical improvement in the public finances forecast for the Irish economy, should make such a policy readily sustainable. While there will be some limited loss of competitiveness, especially in 1991 and 1992, the effects of the EC Structural Fund payments and the spin off effects of 1992 will help offset the resulting loss of output.
Interest Rates
As outlined above, the assumptions about exchange rates are closely related to our interest rate assumptions. While we have seen a significant rise in world nominal interest rates in recent months, the rise has only mirrored the rise in the expected rate of inflation. As a result, there has been little or no change in the underlying real rate of interest which is so important in determining the rate of economic activity. For Ireland, with an assumed fixed exchange rate vis-d-vis the DM, the German rate of interest is now crucial in determining domestic rates. When we were preparing our last Medium-Term Review and we made such an assumption it may have appeared unrealistic. However, within months of publication the inevitable detachment of the Irish rate of interest from UK rates occurred and recent trends have only served to confirm this new monetary regime.
The prospects for German interest rates obviously depend in the short term on the rate of inflation in Germany and the rates of interest elsewhere. With tight monetary policies in place in the UK and the US it has proved necessary to tighten monetary policy in Ger-many to limit the import of inflation through changes in
13 the exchange rate. In this sense the German rate of interest is not independent of economic policies and problems elsewhere. However, as we have assumed a gradual improvement in the world rate of inflation and a reduction in world financial imbalances in the medium term, we have also assumed that German interest rates will fall in nominal terms from 1990 to 1994. This reduction in real terms is assumed to be small.
The experience of the Netherlands, which has maintained a fixed exchange rate with the DM since the early 1980s, has been that their rates of interest have converged to DM rates. With time, and increasing confidence in the economic recovery, we would expect to see a similar process in Ireland. By 1994 we assume that the interest differential compared to the DM will be down to around 0.5 percentage points. With a long term world rate of inflation of around 3 per cent the yield on government bonds in Ireland is assumed to be between 6 per cent and 6.5 per cent in 1994, well below the current level of 9 per cent. The implied real rate of interest of over 3 per cent would be significantly above the Irish experience prior to the 1980s, though it would approximate more closely to the long-term norm in Germany.
European Labour Market
A further important set of international assumptions which will determine our economic progress over the next five years relates to the European labour market. The fact that the development of the domestic labour market has been closely related to that of the UK has been known for many years. However, demographic changes may mean that developments in the Irish economy should be viewed in a wider European context over the next five years.
Labour market conditions in the UK are likely to disimprove over the next two years as a result of the economic downturn there and the deflationary monetary policy currently being pursued. Other things being equal, this would significantly reduce Irish emigration to the UK. However, demographic changes mean that, in the forecast period, the number of school leavers will fall rapidly in the UK. The same process is underway already in Germany. The net result may be that whatever fall in demand for Irish labour occurs in the UK will be offset by a rise in the demand from other EC countries. For the forecast period we have assumed that these pressures will cancel out leaving the opportunities for young Irish emigrants to find employment elsewhere in the EC roughly unchanged. We have assumed also that the US will continue to be a major destination for Irish emigrants in spite of the difficulties obtaining work permits there.
2.2 DOMESTIC ASSUMPTIONS