THE ECONOMIC AND SOCIAL RESEARCH INSTITU’I~ COUNCIL
* W.G.H. QUIGLEY CB, President of the Institute. * JOSEPH F. HARFORD, Chai,wnan of the Council.
G.T. PAUL CONLON, Chairman, ESRI Fund-Raising Committee 199_5-2000. SEAN CROMIEN, Fo,rner Secreta,34 Department of Finance.
* MAURICE F. DOYLE, President of the Institute 199.5-1999.
* CONNELL FANNING, Professor, Department of Economics, University College Cork. MARY FINAN, Managing Directo,; Wilson Ha~vtnell Public Relations Limited.
PATRICK GEARY, Professo,, Department of Economics, National University of Ireland, Maynooth. PAUL HARAN, Secretary General, Depa,~tment of EnteJp,qse, Trade and Employment.
ALFIE KANE, Chief Executive, Telecom Eireann.
KEVIN J. KELLY, Group General Manager- AIB Bank, AIB Group plc. * EUGENE McCARTHY, Director; GE Capital Woodchester Bank Limited.
EDWARD F. McCUMISKEY, Chief Executive & Secreta,~y, Advertising Standards Autho,qty for Ireland.
ALAN MA’ITHEWS, Professor, Department of Economics, T~qnity College Dublin. MICHAEL J. MEAGHER, Fo,w2er Director; Bank of Ireland.
STEPHEN MENNELL, Professo,; Depa,~tment of Sociology, University College Dublin. * PATRICK MULLARKEY, Secreta,3t General, Department of Finance.
DONAL MURPHY, Director General, Central Statistics Office.
* D ONAL NEVIN, Former General Secreta,zy, I~qsh Congress of Trade Unions. * TOM/~S F. 6 COFAIGH, President of the Institute, 1987-199.5.
MAURICE O’CONNELL, Governor; Central Bank of h’eland. * MARIE O’CONNOR, Partnel, P,qcewaterhouseCoopem.
PATRICLA O’DONOVAN, Assistant General Secreta,~y, Irish Congress of Trade Unions. JERRY O’DWYER, Secreta,~y General, Department of Health and Children.
KEN O’HARA, Chief Executive, ElecHqcity Supply Board.
WILLIAM ROCHE, Professo,, The Michael Smu~t Graduate School of Business, University College Dublin.
ROELOF SCHIERBEEK, Chairman, Northern Ireland Economic Research Centre. * NOEL SHEEHY, Professol, Department of Psychology, Queen~ University of Belfast.
EDMOND SULLIVAN, Secreta*zF General, Department of Social, Community and Family Affairs. T.K. WHITAKER, President of the Institute 1971-198Z
* BRENDAN J. WHELAN, Director of the Institute.
* PADRAIC A. WHITE, Chairman, Northside Partnership Limited.
REVIEW
1999-2005
DAVID DUFFY,
JOHN FITZ GERALD, IDE KEARNEY, DLARMAm SMYTH
OCTOBER 1999 NUMBER
7
Copies of this paper may be obtained from The Economic and Social Research Institute (Limited Company No. 18269). Registered Office: 4 Burlington Road, Dublin 4.
Authors
John Fitz Gerald is a Research Professor, Ide Keamey is a Research Officer, David Duffy is an Assistant Research Officer and Diarmaid Smyth is a Research Assistant with the ESRI.
Contributors
REVIEW
1999-2005
DAVID DUFFY,
JOHN FrrZ GERALD, IDE KEARNEY, DIARMAID SMYTH
© THE ECONOMIC AND SOCIAL RESEARCH INSTITUTE DUBLIN, 1999
A CKNO WLEDGEMENTS
Work on this year’s Medium-Te~z Review has been an ongoing process, which involved many experts both from within and outside of The Economic and Social Research Institute. In particular we are very grateful to our colleagues from within the Institute who gave up their time and energy to give frequent helpful, incisive and constructive advice on the Review. A word of special thanks goes to Terry Baker who has just retired as editor of the Quarterly Economic Commentary, whose knowledge and assistance in formulating our forecasts proved vital.
Over the last six months, we have been in contact with several leading institutions and experts from various fields of the economy. Such meetings as always proved to be more than useful. In particular we would like to thank the Departments of Finance, Public Enterprise, Environment and Local Government, F/~S, Teagasc, Forffis, the CSO, the EPA, the ESB, the IDA, TESCO, SIPTU, John Beggs, Julian Binfield, Terry Corcoran, Gerry Duggan, Marion Finnegan, Colin Hunt, Jim O’Leary, Jim Power
and Brendan Riordan.
Once again the National Institute of Economic and Social Research, London, proved to be invaluable in offering advice and in allow~g us access to their global econometric model, NiGEM which enabled us to formulate the External Environment section of this year’s Review, as well as’ allowing us to carW out various shocks in the model.
The cartoons that appear in the summary were prepared by Jimmy Burns.
A CKNO WLEDGEMENTS SUMMARY
Chapter
1
2
’3 4 5 6 7 8
INTRODUCTION
UNDERSTANDING THE RECENT CONVERGENCE THE EXTERNAL ENVIRONMENT
DEMOGRAPHIC ASSUMPTIONS THE CENTRAL FORECAST
SHOCKS AND SURPRISES POLICY IMPLICATIONS CONCLUSIONS
Page
iv vii
1 5 35 48 61 113 130 152
Special Articles
CELTIC CUBS? REGIONAL MANUFACTURING IN IRELAND MEDIUM-TERM PROSPECTS FOR THE IRISH FINANCIAL SYSTEM APPENDIX TABLES
SUMMARY
Previous Medium-Term Reviews, which forecast relatively rapid growth in the economy, were greeted with a certain amount of incredulity at the time they were published, although history subsequently proved them to be somewhat pessimistic. This latest Review published by The Economic and Social Research Institute covers the period to 2005. This publication is unique in presenting a comprehensive forecast for the Irish economy over an extended period and it benefits from the
... wide range of research
...carried out in the ESRI. The analysis highlights a number of strategic issues which are crucial for the long-term development of the economy, issues which are often ignored in the debate on economic policy in Ireland.
Our analysis suggests that the Irish economy is fully wound up and moving very fast but that over the next decade it is likely to unwind gradually and eventually return to the EU average rate of growth after 2010. However, there remains the danger that either external shocks or domestic mistakes could put this benign scenario at risk.
The purpose of this publication is to explore the implications of this forecast, to consider how events might prove it wrong, to analyse the risks and opportunities which the economy currently faces, and to consider the policy options for the future.
Introduction
Understanding the Past
In order to understand the forces driving the economy the Review begins by examining Irish economic performance over the last 20 years. This analysis in Chapter 2 shows that there has been a steady convergence of productivity levels towards the EU average over the last 25 years, but it was not until the 1990s that this translated into a convergence in income levels and living standards.
The External Environment
As an exceptionally open economy, with total trade amounting to almost 200 per cent of GNP, Ireland is very much dependent on what happens in the rest of the world. Chapter 3 considers the medium-term prospects for Ireland’s key trading partners. Because of the underperfomance of many of the economies in the EU in the 1990s, there is significant scope for output in those countries to grow more rapidly in the coming years, using some of the spare capacity (including the reserves now evident in their high levels of
Demographic Assumptions
The Central Forecast
1998
GNP 7.9
Consumption Deflator 2 Employment 6.7 Balance of Payments 2.2 Debt - GNP Ratio 67.5 General Government 1.6
Balance
Unemployment Rate 8.4 (ILO)
unused labour). For the US, the medium-term prospects are also considered reasonably favourable, although there remains some uncertainty about the likelihood and nature of any future slow-down. Finally, the UK economy is performing somewhat better than might have been expected, given the strength of sterling, and this augurs well for its prospects over the next few years. All in all, the international outlook appears quite favourable for Ireland for the immediate future.
A key factor underlying the exceptionally strong performance of the Irish economy in the 1990s has been its unusual demographic structure. From having the highest rate of economic dependency in the EU in the 1980s, it will have one of the lowest by 2005.~ This affects the economy, directly through releasing a very large number of people into the paid labour force,
and indirectly through reducing the tax burden.
The combination of a large natural increase in working age population and rising female labour force participation has resulted in the labour force growing rapidly - by an average of 3 per cent a year over the period 1990-95. The numbers employed have also been swelled by the major fall in unemployment. However, in the next five year period to 2005, even with higher net immigration, the rate of growth in labour supply is forecast to fall to an average of 2 per cent a year, with a further fall to 1.5 per cent in the period to 2010. In addition, there is much less scope than in the 1990s for further fails in unemployment.
The Central Forecast for the economy to 2005 is described in Chapter 5. This represents our best estimate of the prospects for the economy - the actual outturn is as likely to be higher than forecast as lower. However, as discussed in Chapter 6, if the economy were to be hit by an adverse shock, the potential loss of output, and the resulting divergence from the Central Forecast, would be likely to be greater in absolute magnitude than would be the case if the economy exceeded expectations.
Underlying our forecast is an assumption that the next National Plan will provide for a major increase in public investment in infrastructure. Because of the dangers the economy could face from overheating, we also assume that the next two budgets provide for underindexation of tax bands and
allowances - a tightening of fiscal policy. Thereafter, once the economy has slowed down, we allow for major cuts in taxation over a period of years. These policies would see continuing budgetary surpluses over the next decade, culminating in the full repayment of the national debt by 2010 and would allow the government more scope to cushion the economy from any future shock through a countercyclical fiscal policy.
1999 2000 2001:. 2002 %
6.3 5.8 5.5 5;0 4.9 1.8 2.2
4.8 3.5 " .2.4 2.3!-1;9 % of GNP
0.1 -0.8 :-0.2 4 59.1 49,3 40.4 32.6 ~,26.~
2.3 3.6 4.5 % of the LabourForce
SUMMARY ix
Figure: Growth in GNP, Five Year Averages
Annual Average % Growth
B
7
1970-75 1980-85 1990-95 2000-05 2010-15 1975-80 1985-90 1995-00 2005-10
The main points that emerge from the analysis are:
¯ As shown in the Figure, the economy is currently fully wound up and growing very rapidly at over 6.5 per cent a year. The most likely scenario for the next decade is that it will gradually unwind, with a reversion to a "more normal" European growth rate after 2010. This would see a growth rate for GNP over the next 5 years of around 5 per cent a year, with Irish income per head reaching EU average levels by 2005. The superior performance of the economy to that of the EU as a whole is attributable to a much higher growth in labour supply, as well as a somewhat higher growth in productivity.
¯ There will be a gradual shift from high tech. manufacturing to market services, especially internationally traded services, as the engine of growth over the course of the next ten years. This pattern of development has already been seen in other developed economies. ¯ Investment will remain high over the period to 2005, reflecting the fact
that, while Ireland is enjoying an EU standard of living, it has not yet reached the average EU stock of wealth, especially in terms of infrastructure. The need for a high level of investment, especially in public physical infrastructure and housing, which is needed to close this gap, will limit the resources available for consumption.
¯ Provided that wage expectations do not run ahead of the ability of the economy to deliver, it seems possible that the labour market will see almost full employment in the medium term, with the unemployment rate hovering around 5 per cent (see Table).
¯ Over the past 20 years, in order to generate a major increase in employment, Ireland’s competitiveness had to improve dramatically through the share of profits in total output rising continuously. However, looking to the next decade, the rate of growth in employment is likely to be much lower (see Table), reflecting the expected sharp fall in the growth in the labour force. It will be sufficient if the level of competitiveness, as measured by the profit rate, stabilises at roughly its current level. While more of the benefits of growth in the 1990s were taken in the form of increasing employment than in increasing real wage rates, for the next decade real wage rates are expected to rise more rapidly.
Because of the dramatic fall in the dependency ratio, the burden of providing necessary public services is likely to fall in the period to 2005. Once the economy has slowed down, probably in 2002 or 2003, this will allow the possibility of fairly dramatic cuts in the level of taxation. This should be possible, while still providing for a high level of investment in infrastructure, full indexation of social welfare payments to wage rates, and a continuing limited improvement in public services. As shown in the Table this could result in full repayment of the national debt by 2010.
Shocks and Surprises
While the Central Forecast represents the best estimate of how the economy will progress out to 2005, it is almost certain that the actual outtum will be a more bumpy ride. Chapter 6 examines what would be the impact of a series of unpleasant surprises. This analysis suggests that the negative effects of external shocks could be magnified in the short-term by three domestic factors: a potential bubble in house prices, excessive wage inflation in the coming years and a failure to implement the necessary investment in physical infrastructure.
If, for example, there were to be a sudden shock to the US economy from collapsing equity prices, or to the EU economy from a monetary policy shock, the consequences could be a temporary dramatic fall in house prices, with other related effects on the domestic economy. Such a shock could see GNP reduced by 3 percentage points or more for a limited period, giving rise to a severe but temporary recession. Probably the most serious problems that the economy could encounter would be an external ¯shock along the lines of the oil crises of the 1970s, or a sustained explosion in labour costs, combined with escalating public sector pay problems, and a continuing failure to deal with the existing infrastructural deficits.
Finally, the possibility that theeconomy could grow more rapidly through higher immigration or through higher productivity growth is examined. In the case of the former, there would be an even greater need to upgrade the country’s physical infrastructure.
SUMMARY Xi
asymmetric shocks through counter-cyclical fiscal policy. This option was not available in the 1980s.
Policy Implications
Chapter 7 reviews the policy implications of the analysis in this Review. As discussed above, there is no certainty that the benign scenario of the Central Forecast will be realised. However, there are a range of policies which might be adopted which could help make the economy more robust in the face of shocks. The favourable scenarios painted in this Review also allow the possibility of making significant progress over the next decade in achieving a number of the long-term goals of economic and social development. It also seems certain that Ireland in 2010 will be a very different economy and society from today and this will require a rethinking of our strategic objectives.
Policy Measures
The policy measures that could help promote the benign Central Forecast are:
The successful implementation of the programme of investment in public physical infrastructure, identified as being necessary in the report on National Investment Priorities. To be successful there will have to be major changes in the planning and implementation process.
A renewed social partnership that guarantees a significant dividend from the rapid economic growth to all citizens, while still maintaining the country’s competitiveness. Providing that it dealt with the escalating problem of public service pay it could help ensure a stable domestic economic environment.
housing there is a need to concentrate state support on the area of social housing and to reform the current channels through which this latter support is currently provided.
There is an urgent need to improve the efficiency of many sectors of the economy, especially public utilities. Public Private Partnerships (PPPs) should not be used to raise finance - the state is not short of money. Where PPPs have an important role is in the efficient production of goods and services, a task where the private sector generally has a comparative advantage.
Living Standards
The most obvious first call on the fruits of future growth is to raise the living standards of the population as a whole.
¯ If the Central Forecast were to be achieved, it seems likely that real after-tax wage rates for those in employment could rise by around 3 per cent a year over the next decade, almost one per cent a year faster than in the 1990s.
¯ We have assumed that welfare rates will be indexed to average earnings so that those dependent on welfare will also share in the growth.
¯ While the single biggest group in poverty in the 1990s has been the unemployed, there are other groups that may be at particular risk in the medium-term. These include lone parents and their children, and those in low paid employment.
¯ A rapidly growing problem, contributing to poverty and hardship, is the shortage of social housing. Tackling this problem in the next five years will require substantial additional resources.
Strategic Priorities
The changing nature of Ireland’s economy and of the wider society raises issues about the strategic priorities for the country in the next decade.
¯ The change in lifestyles, in particular the rising participation of women in the paid labour force, will require more far-reaching changes in the way we organise society, and work in particular. In the interests of parents and children it will be necessary for the paid work place to show much more flexibility and for there to be a major development of child-care facilities. This is not specifically a labour market issue but, rather, an issue about the quality of life.
¯ Already there is substantial net immigration into Ireland, with the majority now no longer being Irish citizens. The bulk of the current irmnigrants are very highly educated and they are making a significant contribution to the growth of the economy. However, as Ireland becomes one of the most attractive labour markets in the world over the next decade, the traditional pattern is being reversed, with many foreigners seeking the type of access to Ireland that young Irish people had to such markets elsewhere in the past. While Ireland can not solve all the world’s problems, its growing wealth will require it to play a bigger role than in the past.
¯ The next ten years will see an unusually favourable demographic situation with the burdens on state services falling. The government should act to ensure that no single generation has to carry too heavy a burden of caring for the aged through the pension system. The current proposals to develop a state pension fund to help promote intergenerational equity are to be welcomed.
SUMMARY xiii
Articles
market. While Ireland will become a net contributor to the EU budget over the next decade, this will be a small change compared to the huge importance to the economy of market access. As a result, in the longer run, the enlargement of the EU is likely to benefit Ireland. These changes will require a change in the vision of Ireland’s strategic role in the EU, as well as the shouldering of a larger burden in supporting world economic development through overseas aid.
Bradley and Morgenroth in an article on "Regional Manufacturing in Ireland" examine the distribution of manufacturing output and employment across the regions in Ireland. The article discusses the factors that have given rise to this outcome. It shows that industry was quite concentrated in the Dublin region in 1960 but by 1980 it was much more evenly distributed. More recently, some regional heterogeneity has crept back. However, they suggest that the original policy of dispersion of foreign firms may have reduced the overall impact of the foreign investment on the economy. They conclude that policy over the period 2000-2006 should try to ensure that the more remote geographic areas are facilitated in their efforts to link into urban growth poles through the development of physical infrastructure and the identification of sectors that can thrive in non-urban environments.
1.1 Introduction
Previous Medium-Term Reviews, which forecast relatively rapid growth in the economy, were greeted with a certain amount of incredulity at the time they were published, though history subsequently proved them to be somewhat pessimistic. Today we are bemused by the large numbers of curious visitors who come to Ireland to seek "the secret of eternal growth". For those of us who have lived through the experience of the last two decades in Ireland there is a consciousness that the current success follows on a long period of failure - it is no miracle. The rapid growth today is making up for lost time, and it might have happened earlier but for a combination of bad management and bad luck. The analysis in this Review indicates that the economy is now fully wound up but that over the next decade it will gradually unwind as the growth rate slows.
The 1980s were a particularly difficult time for the economy. Dealing with the fall-out from the excessive fiscal stimulation in the late 1970s, and the resulting legacy of debt, took the best part of a decade. In 1989 and 1990 the economy was beginning to recover but the timing of German unification, and the consequences for European monetary policy, played a major role in postponing, once again, Ireland’s prospect of catching up on its EU neighbours.
This succession of misfortunes, not least those of Ireland’s own making, masked the fact that the economy was a part of Northern Europe and that market forces were working to produce a significant degree of convergence in living standards. What the success of the 1990s shows is that the economy was not damaged permanently by past mistakes. In fact, despite some serious policy errors, the key to the better than average performance in the 1990s had been laid over a long period as a result of a number of wise policy decisions. In particular:
¯ The consistency with which the policy of attracting foreign investment was pursued since the late 1950s is now bearing fruit; ¯ The belated recognition after 1967 of the need to invest in education
has been built on in the 1980s and the 1990s.
In preparing this Review we are conscious of the massive changes which have taken place, and are taking place, in the economy and society. In . forecasting the future there is a danger that one will remain a prisoner of today’s problems and fail to see the real driving forces for change.
Among the most important of these forces are the transformation in the educational attainment of the population; the shift from an economy based on agricultural production to one where products and seladces, unheard of in 1970, play a key role; and the opening up of the economy and society to the outside world.
2 MEDIUM-TERM REVIEW 1999-2005
of 16 or less and by 21 many had emigrated. Today, while emigration continues to be a significant feature of life with many young people leaving in their twenties, the pattern has changed. Like homing pigeons, after a few years abroad, the bulk return to live in Ireland. More recently the growth in the number of foreigners coming to Ireland, a significant number of whom are spouses or partners of returning emigrants, has further added to the forces for change. This changing migration pattern means that, instead of "brain drain", Ireland has benefited from the new skills and new ways of looking at things which those coming from abroad bring with them.
These changes will also affect the nature of social exclusion. In 1970, when the vast bulk of the adult population had been failed by a poor educational system, a limited education did not set one apart from the rest of society. By 2010 there is a serious danger that those who do not complete their second level education may find themselves set apart from the rest of the population in a multitude of different ways.
In this Review we present a detailed forecast for the Irish economy out to 2005 and a more limited set of projections out to 2010. In focusing on such a long time horizon we have no illusions that it is possible to provide accurate predictions so far into the future. However, this exercise helps us gain a better understanding of the important forces that are driving change today. With this understanding we hope that policy makers will be better able to influence the future course of events in Ireland.
1.2 Outline of
Review
For some of those watching Ireland from outside the question being asked at the time of the last Review was whether the success of one or two years’ rapid growth was real or was it all done by mirrors. Some external
~~ . , , j,1 ,
conm:entators still suffer today from a talry goctmotlaer complex, believing that the success was all brought by external forces, especially by the EU Structural Funds. However, the reality of successive years of growth in employment has convinced most observers that the convergence in incomes to EU levels is actually taking place. In Chapter 2 we analyse the factors which have given rise to this current performance.
The exceptional openness of the Irish economy means that it is in many senses a regional economy within the EU. Thus a key factor in determining what happens in Ireland is the outlook for the EU and the wider world economy. Chapter 3 discusses the likely external environment within which the Irish economy will operate over the next decade.
Previous Reviews have emphasised the importance of the demographic changes taking place in Ireland. Even over the last two years there has been evidence of changes, in particular in the area of immigration. Chapter 4 discusses recent developments in demographics, incorporating the insights obtained from recent research. It sets out the key demographic assumptions that underlie the analysis in subsequent chapters.
Looking to the next decade the question now being asked by sceptics watching the economy is "when will it explode"? Parallels are drawn with the Lawson boom in the UK or the collapse of the Scandinavian economies around 1990. In this Review we directly address this issue, presenting in Chapter 5 our best estimate, or Central Forecast, of what will happen over the next five years. The implications of this forecast for the housing market, energy demand, the environment, and regional output are also discussed.
Our analysis in Chapter 5 suggests that the Irish economy is currently like a clockwork mouse - it is fully wound up and moving very fast. However, over the next decade it is likely to gradually run down, eventually returning
1
to the EU average rate of growth after 2010. The factors that have contributed to the exceptional success over the last five years still have some years to play:
* The educational attainment of the labour force will continue to rise rapidly;
¯ The attractions of Ireland for foreign direct investment remain in place;
¯ The demographic structure is peculiarly favourable.
However, outside observers the OECD and the IMF are right when they warn that there are growing dangers that a combination of an external shock and internal developments within the economy could possibly cause a severe, if temporary, halt to progress. While in our Central Forecast, set out in Chapter 5, we express the view that a "soft landing" is still the most likely scenario, in Chapter 6 we consider some alternative scenarios. This analysis suggests that, if there were to be a sudden shock to the EU or US economies which slowed world growth, raised interest rates, or caused a fall-off in foreign direct investment, the consequences for Ireland could be unpleasant. The combination of the current potential bubble in the housing market and rising pressures in the labour market could turn a temporary slow-down elsewhere into a recession in Ireland.
The upside of this analysis suggests, however, that, even if the unfavourable scenarios were to play out over the next five years, the consequences would be very different to the experience of the UK and Scandinavia a decade ago. The underlying strength of the economy, the favourable demographic structure, and the advantages conferred by EMU mean that, if properly handled, the economy would quite rapidly return to the growth path set out in Chapter 5.
As discussed below, in five of the last six Reviews our forecasts have proved to be too pessimistic and we recognise that our Central Forecast in this Review is as likely to prove too optimistic as too pessimistic. Therefore, in Chapter 6 we also examine the possibility that the economy may outperform our expectations.
Having recognised the dangers that face the economy, and also the possibilities which the new situation presents, in Chapter 7 we consider the appropriate policy responses to the changing circumstances. First, there is a need to design policies that safeguard the current success and promote its continuation well into the next decade. Second, the rapid rise in living standards makes feasible many desirable objectives, all of which seemed beyond our reach a few years ago. We discuss how best these new found opportunities could be exploited. Finally, the changing nature of the economy and society calls for a new consideration of longer-term strategies:
¯ for developing our economy and society to meet the changing circumstances of the next decade;
¯ to develop our relationships with our neighbours in the EU and with the rest of the world.
Finally, in Chapter 8, we bring together the conclusions from our analysis.
Two additional articles are included in this Review that throw light on important aspects of the economic changes under way. The first of these articles, by Bradley and Morgenroth, examines the forces driving regional growth and regional differences in manufacturing performance. With the rapid growth in employment and pressures on infrastructure this issue is attracting increasing attention in Ireland.
4 MEDIUM-TEI~’I REVIEW 1999-2005
1.3
The Forecasting
Process
Forecasting anything in life, whether it be future GNP trends, unemployment rates or even the likely winner of next year’s Grand National, is a very uncertain business. Inevitably there will be surprises waiting down the road. Economic forecasting, in particular, which tries to predict human behaviour, is clearly a process fraught with difficulties! It has been said that:
All too often in economics the choice is between being roughly accurate or precisely wrong.2
In the Appendix to Chapter 5 we compare previous Medium-Term Review forecasts with actual outtums, so one can gauge the success of our past forecasts, as well as giving an insight into the likely margin of error in this year’s Review.
In our Central Forecasts in this Review, as in previous Reviews, we have aimed for "rough accuracy". While we present details of our forecast on a year by year basis, we put much more emphasis on the forecasts for five-year averages. As with all economic forecasts, it is very difficult to predict when turning points in the economic cycle will occur, but medium-term forecasts of trends are likely to be more reliable. An additional problem for forecasters is that, if the exercise is done correctly and future problems are identified, then policy makers are likely to remedy the situation. This may result in an improved economic performance while falsifying the economic forecasts. If this happens the "failure" of the forecasts will have performed a useful sereice.
CONVERGENCE*
2.1 Introduction
The growth performance of the Irish economy in the 1990s has consistently exceeded expectations.1 This has led to very rapid convergence of GDP per head with the EU average, so that by 1998 Irish GDP per head equalled the average of the EU-15 group of countries. It has also led to the development of a relatively unique structure in the Irish economy, where high-technology manufacturing industries account for a large percentage of both output and employment.
The convergence can be understood in terms of two processes. First, there has been a more rapid growth in productivity in Ireland than in the EU generally, and second, the Irish dependency ratio has recently converged on the EU average. In Section 2.2 we examine these two processes in detail. We also look at regional differences in output per head, which are mainly attributable to differences in measured productivity.
Since accession to the EU, Irish productivity levels have been converging slowly on the EU average. However, until this decade adverse changes in the economic dependency ratio, in terms of employment, labour force participation and age dependency rates, served to offset this convergence, so that GDP per capita remained well below EU levels. This changed in the 1990s when falling unemployment, increasing female participation and a reduction in the age dependency ratio have together accounted for almost half of the total per capita growth in GNP.
The strong growth in productivity is in large part driven by the growing importance of the foreign-owned multinational sector. This has produced an ever-widening gap between GDP and GNP measures of output. Furthermore, increasing specialisation in high-tech, exports means that terms
of trade movements since 1985 have driven a wedge between output and incomes in Ireland. This effectively means that output growth rates must continuously grow more rapidly to deliver a constant growth rate in income. The gap between output and income is examined in Section 2.3.
The unique structure of the Irish economy also has implications for the labour market. The high concentration in foreign-owned, high-technology sectors has in part led to the sustained decline in labour’s share of value added since the 1980s. Rising levels of education have increased the productive potential of the labour force. The rapid growth in GNP in recent years has also led to the recent emergence of constraints in the labour market, which have important implications for the future growth potential of the economy. In particular, it seems likely that the economy will have to undergo some worsening of its competitive position as wage demands rise
We wish to thank Frank O’Connor, University of Kentucky and Cohn Keamey, ESRI for their contributions to Sections 2.2.3 and 2.5.1 of this chapter.
1
MEDIUbI-TERM REVIEW 1999-2005
2.2 Convergence in Output Per Head: Productivity and Dependency
in line with the tightening of the labour market. These issues are explored in Section 2.4.
Finally in Section 2.5 we examine the domestic policy background against which this convergence took place. Industrial policy, aimed at attracting inward investment into Ireland, has been central to the convergence in productivity levels. Both monetary and fiscal policy have been broadly accommodating in the 1990s, against a stable macroeconomic background of low inflation, low interest rates and favourable demographic change. Nevertheless, the year-on-year fiscal policy stance has been decidedly pro-cyclical in the 1990s.
[image:20.576.175.507.327.502.2]W
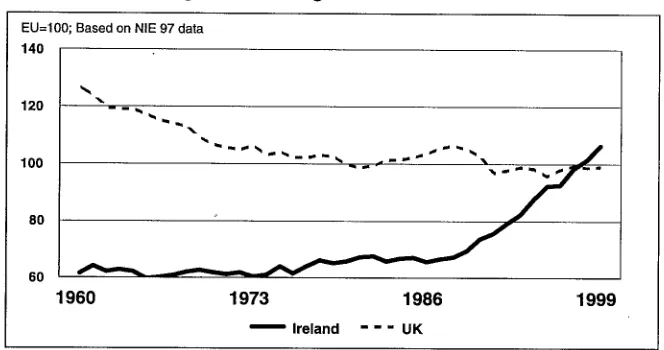
he Irish economy grew by almost 70 per cent between 1990 and 1998 (in GDP terms). This remarkable performance led to full convergence with EU average output levels in 1998. Figure 2.1 plots the ratio of Irish and UK GDP per capita to the EU average. In 1960 Irish GDP per head was 62 per cent of the EU average and over the next thirty years it increased to just under 74 per cent in 1990, a relatively slow pace of convergence. Since that time, the pace of convergence has accelerated dramatically so that by 1998 Irish GDP per head had reached parity with the EU average.Figure 2.1 : Ireland and UK Compared to EU Average, GDP per Head as a Percentage of EU Average
EU=100; Based on NIE 97 data
140
120 f x
100 8O 6O
1960 1973 1986 1999
Ireland --" UK
In this section we examine what lies behind this very rapid convergence in Irish output per head in the 1990s. We focus in particular on two key factors, convergence in productivity and convergence in economic dependency. The relationship between these two and GDP per head can be understood as follows:
GDP
= GDP Employment
Population Employment Population
v.._ _w_ _...~ ~________w____~
GDP per capita GDP per worker Economic Dependency (inverse)
convergence accelerated between 1987 and 1995 as Irish productivity growth rates increased, so that by 1995 Irish GDP per worker lay above the EU average. Since 1995, productivity growth rates have been broadly in line with EU rates. We examine the pattern of productivity growth over the past forty years in Section 2.2.1.
Figure 2.2: Ireland Compared to EU Average, GDP Per Person Employed and Dependency
EU=IO0; Based on NIE 97 data
160
140
120
100
80
60
# #, a, ,,,, a~S
1960 1965 1970 1975 1980 1985 1990 1995
Dependency ¯ - - GDP Per Person Employed
In terms of economic dependency, it was not until the beginning of this decade that the very high levels of Irish dependency started to fall (Figure 2.2). Indeed in the 1980s, differences in dependency worsened the GDP per capita gap between Ireland and the EU, negating the gains made in productivity. The rapid improvement in the Irish dependency ratio in the 1990s arose through falling unemployment, rising participation rates and demographic changes in the age structure of the population. To understand these changes we use the following decomposition:
Employment
Population
Dependency Ratio(inverse)
Employment Labour Force Pop 15 -64
LabourForc~e P--op15-7-~" -ff-oop~afion--~
Employmen~ Part.Rate Age D@endecy [
Rate Ratio(inverse) I
The first term on the right hand side of the equation measures employment as a proportion of the labour force. This is equal to one minus the unemployment rate. The second term measures the labour force participation rate. The third term is the inverse of one plus the age dependency ratio, the population aged below 15 and above 65 as a proportion of the population of working age. In Section 2.2.2 we examine the contribution of each of these factors to the overall growth performance of the Irish economy over the past forty years.
2.2.1 PRODUCTIVITY, HUMAN CAPITAL GROWTH AND COMPETITIVENESS
8 MEDIUM-TERM REVIEW 1999-2005
capita growth rate. In this section, we examine the structural changes underlying these changes in productivity growth.
Table 2.1: Indicators of Changing Structure of Economy, Sectoral Shares
Share of: 1960
GDP in current prices 25 19 GDP in constant prices 15 11 ,
Total Employment 38 ¯ 24 !5
In the 1960s there was significant restructuring in the Irish economy away from agriculture towards industry and services, even before accession to the EU. Between 1960 and 1973 the share of agriculture in GDP fell from 25 per cent to 19 per cent, and its share of total employment fell from 38 per cent to 24 per cent (see Table 2.1). This decline continued in subsequent years, so that by 1998 agriculture accounted for only 6 per cent of total value added a~d 9 per cent of total employment..
The decline in importance of agriculture is a familiar pattern in the development of a modern economy. What is more unusual in the evolving structure of the Irish economy has been the continued importance of the industrial sector, which contrasts strongly with the typical pattern where the services sector is dominant in most modern economies. Figure 2.3 plots the share of industry in non-agricultural value added in Ireland, in both current and constant prices. The industrial sector’s share has remained broadly constant in current prices since 1970, while its share in constant prices has risen sharply, particularly in the 1990s. The gap between these two reflects
2
the much higher price inflation in services than in industry. Figure 2.3: Share of Industry in Non-Agricultural Value Added
Value Added %
50
45
4O
35
3O
1970 1973 1976 1979 1982 1985 1988 1991 1994 1997
[] Constant Prices [] Current Prices
Figure 2.4 shows productivity growth rates in the industrial and services sectors in five-year intervals. Productivity growth in industry has, since the mid-1970s, consistently exceeded that in services and by a growing margin. This coincides with the period following accession to the EU, when Ireland adopted an aggressive industrial policy designed to attract high-technology foreign multinationals into the manufacturing base. The shift towards industry in total value added in the 1990s, coupled with the much higher productivity growth rates in industry, together boosted the measured productivity growth rate.
2
See Meyler, A. 1999. "Recent Developments in Services Inflation", Central Bank of Ireland
Figure 2.4: Growth in Value Added Per Worker in Industry and Services
Average Annual % Growth 8
6
4
1961-65 1965-70 1970-75 1975-80 1980-85 1985-90 1990-95 1995-98 [] Industry [] Services
Productivity = Value Added Per Worker in 1990 Prices, NIE 1997 Basis
It is important to point out that there are a number of problems in measuring industrial sector output in Ireland and in measuring services sector productivity. First, it is by now well documented that in a number of the fastest growing industrial sectors, there are serious distortions in measured output arising from the practice of profit-switching transfer pricingf This will tend to overstate measured productivity in industry. Second, it is generally agreed in the international literature that measured services prices are biased upwards, thereby understating productivity growth. This is due to difficulties in quantifying services output and adjusting for .quality changes, including unmeasured human capital growth, in services prices.
These distortions are avoided in looking at employment data. The services sector is the biggest employer in Ireland, having consistently increased its share since 1960, to reach 61 per cent of total employment in 1998. Nevertheless, in terms of employment the performance of the industrial sector has also been impressive, with its share of total employment broadly constant since 1973 at 30 per cent (Table 2.1). The strength of industrial employment reflects the uniqueness of Irish manufacturing within the EU, due to differences in sectoral composition as a result of our relatively late industrialisation.5
Within the manufacturing sector, measured productivity in the high-technology, largely foreign-owned sector has, since 1980, recorded extraordinarily high growth rates (Figure 2.5). Although profit-switching transfer pricing seriously distorts these data, they do reflect the very high productivity rates within the high-tech, sector, as indicated in the much higher wages earned in foreign industry.7
3
See Honohan, P., B. Maitre and C. Conroy, 1998. "Invisible Entrep6t Activity in Irish Manufacturing", Irish Banking Review, Summer.
4
See Duffy, D., J. Fitz Gerald, I. Kearney and F. Shortall, 1997, Medium-Term Review: 1997-2003, Dublin, The Economic and Social Research Institute, April,. p. 119.
5
See Duffy et al., 1997. op. cit. p. 40. 6
Foreign-owned companies have been found to have a substantial productivity led over domestically-owned ones. See Oulton, N., 1998. "Labour Productivity and Foreign Ownership in the UK", National Institute of Economic and Social Research, Discussion Paper No. 143.
7
10 MEDIUM-TEI~d REVIEW 1999-2005
Figure 2.5: Productivity Growth within Manufacturing Average Annual % Growth
20
1
4 0
1970-75 1975-80 1980-85 ¯ Traditional
m
i
1985-90 [] High-Tech
Productivity = Net Output Per Worker
There have been significant benefits arising from the large inflows of FDI (Foreign Direct Investment) into the Irish manufacturing sector since accession to the EU. First, it has helped develop a high-growth, export-oriented sector and has led to a shift towards more high-skilled production. Second, it has reduced dependence on the UK as the main market for Irish exports. Third, Ireland has become a major conduit of US technological innovation into Europe, especially in the 1990s. Fourth, the policy of concentration on a small group of sectors has meant that Ireland has now become a major location for specific industries. This leads to spill-over effects into the domestic economy both in terms of received expertise and technological know-how and via direct linkages with the domestic economy and the local labour market. The very real direct effects of the FDI in terms of employment share are illustrated in Figure 2.6, where the share of high-tech. industries in total manufacturing employment rose from under 25 per
¯ ¯ 8
[image:24.574.151.509.67.637.2]cent m 1970 to over 50 per cent m 1998.
Figure 2.6: Composition of Manufacturing Employment 100
90 80 70 60 50
40 30
2°1 I
10 0
1970 1974 1978
II/i111 ii
1982 1986 1990 [] High-Tech
The extraordinarily high productivity in the high-tech, sectors, contrasts with the performance of the traditional sector. The growth in productivity in traditional industries averaged 6 per cent per annum between 1975 and 1995. This was mainly driven by a continuous decline in employment, as a
8
prolonged period of restructuring led to a shake-out of many traditional, indigenous firms. In 1973 employment in traditional industries accounted for over half of total manufacturing employment, by 1998 this had fallen to under 35 per cent.
GNP per worker is a very crude measure of labour productivity. In particular, it does not take account of the increasing education of the workforce, which has increased the human capital embodied in a unit of
labour. Figure 2.7 plots an index of human capital for the labour force between 1966 and 1996. This index is a weighted average of four education levels, namely Primary, Junior Certificate, Leaving Certificate and Third Level, weighted by the estimated returns to each education level ( see Box 2.1 for details). If the entire workforce had Primary education only, the value of the index would equal one.
We can see from Figure 2.7 that there has been a rapid increase in average education levels in the workforce in this period. This is a key factor contributing to the more rapid growth in productivity in Ireland, where investment in human capital occurred rather later than in other Northern European countries, relative to the EU average. Recent estimates suggest that improvements in labour quality, due to rising education levels, particularly in the 1980s and 1990s, accounted for almost 20 per cent of total growth in output.9
Figure 2.7: Index of Human Capital for Total Labour Force
1=Workers with Primary Education Only
1.4
1.3 mini
I
1
1966 1971 1976 1981 1986 1991 1996
1.2
1.1
High productivity growth improves competitiveness, boosting the demand for output and making Ireland a more attractive location in which to invest. Figure 2.9 plots the growth in unit labour costs since 1961 in five-year intervals. Since 1985 unit labour costs have been falling in the Irish industrial sector, reflecting the shift towards high productivity industries. There have also been positive trends in wage competitiveness since the mid-1980s, due both to more stable macroeconomic conditions and the move to social partnership arrangements in pay agreements. This is reflected in the low growth in unit labour costs in the services sector since 1985.
9
12 MF.DIUM-TEIibl REVIEW 1999-2005
Box 2.1: Constructing Sectoral Human Capital Indices
Data were cOllected, 1996, accordin~ within various
those educated to a Prima~ only, those with a Leavin: Second level.
The next stage in the educa{ion (using
those educated to a weight of
using these estimated-capital.
ure 2.8: Human Ca;
Relative to Total Labour Force
Other Market Services ... ...
~ - - ~ - ’
,.., . - . ," ... I~lg~- ech M.nuf .... ~ Traditional Manuf,
¯,~ Unemployed w ~qmmzmmzml,,~
Agriculture
1966 1971 1976 1981 1986 1991 1996
Figure the human average rateS of and Education: However {hiS rates
1991 and i:996; tech. manufacturifi compared to a 3!8 indicate that into the
In sutmnary, productivity growth in Ireland, as measured by GNP per worker, has exceeded the EU average since accession in 1973. This has contributed to a steady closing of the gap between Irish and EU productivity levels over the past twenty-five years. A catch-up in human capital levels has also driven this convergence.
The growth in productivity has been driven by both changes in the composition of the h’ish economy, from agriculture to industry, and by the switch within the manufacturing sector towards high-productivity, foreign owned industries. The growing importance of FDI means that, despite the shake-out of the indigenous manufacturing sector, the Irish industrial sector
10
has grown in importance, so that the Irish economy has a unique structure compared with our main trading partners.
Figure 2.9: Unit Labour Costs
Annual Average % Growth
2O
15
10
5
0
-5
1961-65 1965-70 1970-75 1975-80 1980-85 1985-90 1990-95 1995-98 [] Non-Agric. [] Industry [] Services
2.2.2 DEPENDENCY- EMPLOYMENT~ PARTICIPATION AND AGE STRUCTURE
The Irish economic dependency ratio was well above the EU average until the beginning of this decade. Over the past forty years the EU average dependency ratio ranged between 1.2 and 1.5 (Figure 2.10). By contrast the Irish dependency ratio was above 1.7 in 1960, from which it rose to a peak of 2.3 in 1985. Since 1985 it began to decline and in 1999it is approximately equal to the EU average. In this section we examine the key factors behind the changes in this dependency ratio.
Figure 2.10: Economic Dependency Ratio
Ratio of Economically Inactive to Total Employed
2!f
2.
1.8
1.6
1.4
L
1.2
1960 1966 1972 1978 1984 1990 1996 1963 1969 1975 1981 1987 1993 1999
~lreland --" EU
Source: OECD and EU Data
Figure 2.11 plots the growth in GNP per capitan in five-year intervals over the past forty years. This growth is decomposed into four components, namely productivity, employment, participation and age dependency, as outlined in the introduction to this section above.
The most striking feature of this graph reiterates the point explored in the previous section, namely that productivity growth has been strong throughout the past forty years. The fall in GNP per capita in the 1980-85 period was due to a large increase in unemployment (a fall in the
11
14 MEDIUM-TERM REVIEW 1999-2005
employment rate). This helps distinguish the relative importance of different factors underlying the overall growth performance. By way of example let us compare the period 1965-70 with the period 1990-95. Between 1965 and 1970 productivity growth averaged 4.3 per cent per annum, a rate which has not been equalled since. However, because participation rates fell and the unemployment rate rose during this period the overall growth in GNP per capita was slower at 3.6 per cent per annum. By contrast in the period 1990-1995 productivity growth was lower at 2.7 per cent per annum but because participation rates grew and age dependency fell GNP per capita grew at an equivalent rate of 4.1 per cent. Since 1990 the rate of growth in productivity, employment, participation and age dependency have all made net positive contributions to the growth of GNP per capita.
Figure 2.11: Decomposition of Growth in GNP Per Capita Annual Average % Growth
8 61 4 2 0 -2 -4
1961-65 1975-70 1980-85 1990-95
1965-70 1975-80 1985-90 1995-98
GNP Per Capita ~ Employment ~ Dependency Productivity [~ Participation
Changes in the economic dependency ratio cannot lead to a permanent increase in the long-run growth rate. Trivially, if every member of the population were fully employed, then the long-run per capita growth rate would be purely a function of productivity growth. However in the medium-term, changes in employment, participation and the age structure of the population are all important determinants of the actual growth rate in any given period and they have played a key role in driving the growth rate in the 1990s. We examine the performance of each of these in turn.
Figure 2.12: Total Employment in Thousands Thousands
1500
1400 1300 1200
1100 1000
1970 1973 1976 1979 1982 1985 1988 1991 1994 1997
improvements in competitiveness boosted the performance of the industrial sector. Since 1990 total employment in the industrial sector has increased by 135,000 (Figure 2.13). This strong performance had spill-over effects on domestic demand, leading to strong growth in market services sector output and employment. Employment in the market services sector increased by 200,000 since 1990.
Figure 2.13: Cumulative Change in Total Employment, Sectoral Contributions
Thousands
30O
200
100 ~
--N mmmmmm %~
0 ~ ~
~
-ioo ~
1970-75 1975-80 1980-85 1985-90 1990-95
¯ Non-Market Services [] Agriculture [] Market Services
1995-99 [] Industry
Since 1994 the strong growth in employment has led to a rapid decline in the unemployment rate, contributing on average over 1.6 per cent per annum to the per capita growth rate (Table 2.2). Increases in female participation rates have also contributed significantly to the per capital growth rate in the 1990s. In 1998 alone over one-third of the per capita growth rate is accounted for by rising participation rates. Finally, changes in the age structure of the population, due to both a decline in the birth rate together with a return to immigration in the 1990s, led to an increase in the proportion of the population of working age in the 1990s. This has added on average 1 per cent per annum to the per capita growth rate. Chapter 4 looks in detail at these changes in participation, migration and age structure. Table 2.2: Decomposing Annual Growth in GNP Per Capita, 1991-1998
16 MED1UM-TEIhM REVIEW 1999-2005
2.2.3 REGIONAL OUTPUT, EMPLOYMENT AND WAGES12
As can be seen from Table 2.3~ output per capita and per worker varies considerably across the regions. In 1996, output per capita in the Midlands was 68 per cent of the national average while that in the East was 118 per
cent. The three regions making up the Objective One or BMW (Border-Midlands-West) region had the lowest levels of output per capita. Taken
together, their output per capita was 76.3 per cent of the national average. By contrast, the Southern regions were at 98.8 per cent of the national average.
Table 2.3: Regional Output Per Capita, 1996
Output Per Person (State=100)14 Output Per Worker (State=100) Dependency Ratio (LTOT/N) Employment Rate (LTOT/LF) Participation Rate (LF/N15+) 1/Dependency Ratio (N15+/N)
Border East 81.00 1,18.00 88,00
0.33 0.38 0.84
0.52 0.57 0.75
As discussed in Section 2.2 above, output per capita is the product of output per worker and the dependency ratio. The dependency ratio in 1996 did not vary much from the national average of 0.36. Overall, the demographic and labour force characteristics varied little across regions in 1996. The two items worthy of note are the higher labour force participation rate in the East and the higher unemployment rate in the Border region.
The major reason for the differences in output per person across regions is variation in output per worker (average productivity). The range of output per worker was from 69 per cent to 111 per cent of the national average. Figure 2.14 plots output per worker and output per capita for each of the regions. The greater dispersion in output per capita than in output per worker reflects the effect of variation in the employment ratio. The effect is most obvious for the Border and the East region.
Differences in output per worker across regions are due both to differences in regional specialisation and differences in productivity across sectors. Table 2.4 shows that the BMW region has the highest concentration in agriculture, while the East. has the highest concentration in services. The two southern regions have the highest concentration in industry.
12
This section is taken from O’Connor, J.F. 1999. "The Irish Regions: Review and Medium-Term Forecasts 1996-2005", ESRI Working Paper No. 120.
13
We examine data for seven regions, namely, the Border, East, Midlands; Mid \Vest, South East, South \Vest, and \Vest. These regions are defined as: Border (Cavan, Donegal, Leitrim, Louth, Monaghan, Sligo); Dublin (Dublin, Dun Laoghaire, Fingal, South Dublin); Mid-East (Kildare, Meath and Wicklow); Midlands (Laois, Offaly, Longford, Westmeath); South East (Carlow, Kilkenny, Tipperary South Riding, Waterford, Wexford); South West (Cork, Kerry); Mid West (Clare, Limerick, Tipperary North Riding); \Vest (Galway, Mayo, Roscommon). The Mid-East and Dublin are combined to form the East region because of their common labour market.
14
Figure 2.14: Output Per Worker and Per Capita, 1996
Index State=l O0
140
120
100
8O
60
40
20
0
Border East Midlands Midwest S. East
[] Per worker [] Per capita
S. West West
Table 2.4: Sector Shares of Regional Output, 1996
At the national level, output per worker in both agriculture and services was less than half that in industry in 1996. As shown in Figure 2.15, the variation in output per worker across regions was much greater in agriculture and industry than in services. The range in agriculture was from 61 per cent in the West to 121 per cent of the national average in the South West. The relatively high values of output per worker in industry in the South West and East reflect a sizeable concentration of firms in the pharmaceutical and computer industries, which have high value added per worker. Output per worker in services ranged from 79 per cent of the national average in the Midlands to 111 per cent in the East.
Figure 2.15: Output per Worker by Sector, 199615
Index (State=100) 140 [
120
100
80 60
40
20
0
Border East Midlands Midwest S, East S. West West
[] Agriculture [] Industry [] Services
Output is GVA at factor cost except for agriculture, GVA at basic prices
Despite the substantial variation in output per capita across the regions, there were impressive rates of growth in both output per worker and output per capita in all regions over the period 1979-1996 (Figure 2.16). The growth
15 In the graph the data on output per worker in agriculture are based on GVA at basic prices, all
18 MEDIUM-TEILM REVIEW 1999-2005
rate in output per worker ranged from 2.9 per cent per year in the Midlands to 4.7 per cent in the South West, with an average for all regions of 3.9 per cent. The growth rate in output per capita ranged from 3.3 per cent in the Midlands to 4.8 per cent in the South West, while the average was 4.1 per cent for all regions.
Figure 2.16: Growth in Output Per Capita and Per Worker, 1979-1996
Annual Average % Growth
5
Border Midlands S. East West East Midwest S. West
[] Output Per Capita [] Output Per Worker
State
Although growth rates did not vary greatly across regions, there was sufficient variation to lead to some divergence in relative productivity between 1979 and 1996. Figure 2.17 plots the regional deviations from the national average output per worker in 1979 and 1996 respectively. The largest deterioration in relative position between 1979 and 1996 was in the Midlands, while the largest improvement was in the South West.
Figure 2.17: Index of Output Per Worker, 1979 and 1996
Index State=100
120
100
80
6O
Border East Midlands Midwest S. East S. West [] 1979 [] 1996
V
West
Gross Value Added is the only available measure of regional output. However the data need to be interpreted with care because of the potential impacts of transfer pricing and profit repatriation in some sectors. The distortions from these sources to the regional estimates are greatest in the regions with significant concentrations of plants that are part of overseas
16
companies producing high value added output. This is especially the case in the East and South West (mostly due to the concentration of high value added industries in and around Cork city). Notwithstanding these important caveats, it is clear from the GVA data that in 1996 there were significant
16
2.3
Living
Standards:
Output, Income
and
Consumption
differences between regions in terms of both output per capita and productivity¯
While output per capita is the most widely used measure of living standards, it is an imperfect one. This is because living standards are more accurately measured by disposable income. Changes in the structure of the economy in Ireland, in particular the shift towards foreign-owned industry, concentrated in export markets with falling output prices, mean that a gap between output and income has opened up since accession to the EU in 1973.
Figure 2.18: Growth in GDP and GNP
Annual Average % Growth
lO 1
8
6
1961-65 1975-70 1980-85 1990-95
1965-70 1975-80 1985-90
[] GDP [] GNP [] GNPAdjforTermsofTrade
1995-98
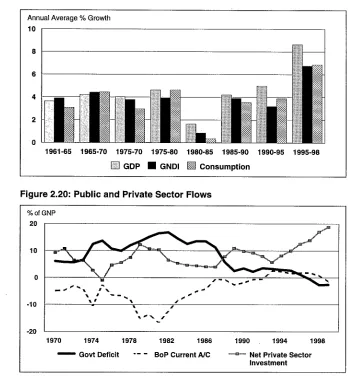
Figure 2.18 plots the average annual growth rates in GDP, GNP and GNP adjusted for the terms of trade. The gap between GDP and GNP is largely accounted for by profit repatriations to their home country by foreign-owned companies operating in Ireland. GNP was equal to 100 per cent of GDP in 1973, however, this has fallen steadily to almost 85 per cent by 1998. The importance of profit repatriations has grown significantly in the 1990s, when the very rapid growth in GDP, averaging 8.6 per cent between 1995-1998, translated into a corresponding growth rate in GNP of 7.2 per cent, a very wide gap. The worsening of the terms of trade since 1985, particularly in the 1990-1995 period, further reduced the benefits of GDP growth to the Irish economy.
The adverse outflows, due to the FDI-dominated structure of the Irish economy, were to some extent offset in the 1985-1990 period by inflows of transfer income, mainly from the EU. Figure 2.19 plots the average growth rates for Gross National Disposable Income (GNDI), defined as GNP adjusted for the terms of trade and including transfer income)7 It can be seen that the growth in GNDI, so defined, has been much closer to the growth in consumption, another measure of living standards.
The gap between GDP and GNP means that while GDP per capita is expected to exceed the EU average in 1999, GNP per capita will still be only 90 per cent of the EU average¯ Recent estimates suggest that private consumption per capita will also be at approximately 90 per cent of the EU
¯ 18 . .
average m 1999¯ This means that m effect output growth has had to continuously accelerate in order to maintain a constant rate of growth in disposable incomes and consumption¯
17
This measure of income includes both current and capital transfers from abroad. 18
20 MEDIUM-TERM REVIEW 1999-2005
Figure 2.19: Growth in Output, Income and Consumption
Annual Average % Growth
lO
]
6
6
’b
01961-65 1965-70 1975-70 1975-80 1980-85 1985-90
[] GDP ¯ GNDI [] Consumption
[image:34.579.158.507.80.456.2]1990-95 1995-98
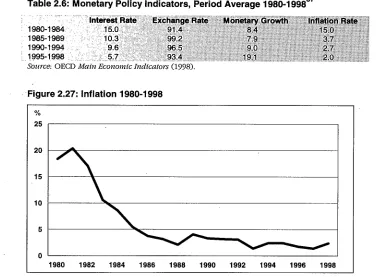
Figure 2.20: Public and Private Sector Flows
% of GNP
2O
10
0
-10
-20
1970 1974 1978 1982 1986 1990 1994 1998
-- Govt Deficit "- - BoP Current A/C "-~--~ Net Private Sector Investment
Figure 2.20 plots the relationship between private sector, public sector
19
and external flows in the economy. These balances sum to zero. During the period of low growth and growing external indebtedness in the early 1980s, the government deficit and balance of payments deficit both increased. During the same period the share of net private sector investment in GNP started to fall, to a low of 4 per cent in 1987. The share of private sector investment in GNP fell sharply and the savings ratio rose (Figure 2.21). Since the mid-1980s, both the balance of payments and the government deficit have come under control, partly driven by strong growth in exports, and this has allowed net private sector investment to increase. It is currently at an historic high.
The corollaw of this high share of net private investment in GNP has been the sharp decline in the savings ratio since the mid-1980s (Figure 2.21). In recent years the combination of rising levels of investment in housing, demographic shifts towards a younger population, and increasing confidence in the stability of the public finances has led to a marked reduction in the savings ratio.
19
Figure 2.21: Savings Ratio
% of Personal Disposable Income
2O
18
16
--14
-1970 1974 1978 1982 1986
2.4 The Labour Market
In this section we examine the implications of the rapid growth in output and the changing structure of the Irish economy for the recent performance of the labour market. First, we detail the decline in labour share of value added, and the consequent rise in profitability that has occurred since 1980. The shift in the structure of the economy towards an FDI-led expansion of the high-technology sector has contributed to this fall. Second, the very rapid growth in recent years has led to the emergence of constraints in the economy and the labour market, both of which have important consequences for future competitiveness. In these circumstances it seems likely that the economy will have to undergo some worsening of its competitive position, together with a stabilisation of the labour share, to achieve equilibrium in the labour market.
2.4.1 TRENDS IN LABOUR SHARE OF VALUE ADDED
Labour share of value added is a measure of the proportion of the output produced within the economy that accrues directly to labour. In the US and UK this share has remained stable since the 1970s while it has been falling in continental Europe.i° The experience in Ireland has been similar to our European partners. Between 1980 and 1997 labour share of non-agricultural value added fell by over 13 percentage points (Figure 2.22). Much of this decline occurred in the 1980s, during the period of restructuring of the manufacturing sector, where labour share declined by almost 20 percentage points between 1980 and 1990 (Table 2.5). During that decade there was also a significant fall in labour share in the distribution, utilities and transport and communications sectors.
Blanchard (1997) argues that the decline in labour share in Continental Europe was due to adverse shifts in labour demand in the 1980s which drove up unemployment and capital shares. He further argues that the consequent increase in profit rates should trigger an increase in capital accumulation and employment in subsequent years. This stoW accords well with events in the Irish economy, where the decline in labour share in the
1980s was followed in the 1990s by a recovery of employment.
20