Bis(cyanido-
j
C
)bis(cyclohexylamine-j
N
)mercury(II)
Ejaz,aIslam Ullah Khana* and William T. A. Harrisonb
aMaterials Chemistry Laboratory, Department of Chemistry, GC University, Lahore 54000, Pakistan, andbDepartment of Chemistry, University of Aberdeen, Meston Walk, Aberdeen AB24 3UE, Scotland
Correspondence e-mail: iuklodhi@yahoo.com
Received 4 January 2010; accepted 8 January 2010
Key indicators: single-crystal X-ray study;T= 293 K; mean(C–C) = 0.038 A˚;
Rfactor = 0.061;wRfactor = 0.193; data-to-parameter ratio = 19.7.
In the title compound, [Hg(CN)2(C6H13N)2], the HgII ion adopts an extremely distorted HgC2N2 tetrahedral coordina-tion. The crystal packing is influenced by weak N—H N hydrogen bonds between the amino groups and the cyanide N atoms, resulting in chains of molecules propagating in [110]. Both cyclohexylamine molecules adopt chair conformations.
Related literature
For related structures, see: Ejaz et al.(2009); Cingolaniet al. (1987).
Experimental
Crystal data
[Hg(CN)2(C6H13N)2]
Mr= 450.98
Triclinic,P1 a= 7.9283 (4) A˚ b= 9.1791 (5) A˚ c= 12.2722 (6) A˚
= 93.972 (3)
= 99.179 (3)
= 97.258 (3)
V= 870.95 (8) A˚3
Z= 2
MoKradiation
= 8.83 mm1
T= 293 K
0.310.230.15 mm
Data collection
Bruker Kappa APEXII CCD diffractometer
Absorption correction: multi-scan (SADABS; Bruker, 2007) Tmin= 0.171,Tmax= 0.351
16082 measured reflections 3385 independent reflections 2830 reflections withI> 2(I) Rint= 0.041
Refinement
R[F2> 2(F2)] = 0.061
wR(F2) = 0.193 S= 1.10 3385 reflections
172 parameters
H-atom parameters constrained max= 3.17 e A˚
3
min=1.98 e A˚
3
Table 1
Selected geometric parameters (A˚ ,).
Hg1—C13 2.076 (17)
Hg1—C14 2.084 (17)
Hg1—N2 2.404 (12)
Hg1—N1 2.426 (14)
C13—Hg1—C14 145.6 (7)
C13—Hg1—N2 100.1 (6)
C14—Hg1—N2 107.0 (7)
C13—Hg1—N1 101.5 (6)
C14—Hg1—N1 102.3 (7)
[image:1.610.313.564.357.405.2]N2—Hg1—N1 83.4 (5)
Table 2
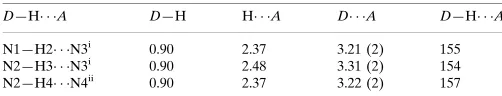
Hydrogen-bond geometry (A˚ ,).
D—H A D—H H A D A D—H A
N1—H2 N3i
0.90 2.37 3.21 (2) 155
N2—H3 N3i
0.90 2.48 3.31 (2) 154
N2—H4 N4ii
0.90 2.37 3.22 (2) 157
Symmetry codes: (i)x;y;zþ1; (ii)xþ1;yþ1;zþ1.
Data collection:APEX2(Bruker, 2007); cell refinement:SAINT (Bruker, 2007); data reduction:SAINT; program(s) used to solve structure:SHELXS97(Sheldrick, 2008); program(s) used to refine structure: SHELXL97 (Sheldrick, 2008); molecular graphics: ORTEP-3(Farrugia, 1997); software used to prepare material for publication:SHELXL97.
IUK thanks the Higher Education Commission of Pakistan for its financial support under the project ‘Strengthening of Materials Chemistry Laboratory at GCUL’.
Supplementary data and figures for this paper are available from the IUCr electronic archives (Reference: WM2295).
References
Bruker (2007).APEX2,SAINTandSADABS. Bruker AXS Inc., Madison, Wisconsin, USA.
Cingolani, A., Lorenzotti, A., Lobbia, G. G., Leonesi, D., Bonati, F. & Bovio, B. (1987).Inorg. Chim. Acta,132, 167–176.
Ejaz, Sahin, O. & Khan, I. U. (2009).Acta Cryst.E65, m1457. Farrugia, L. J. (1997).J. Appl. Cryst.30, 565.
Sheldrick, G. M. (2008).Acta Cryst.A64, 112–122. Acta Crystallographica Section E
Structure Reports
Online
supporting information
Acta Cryst. (2010). E66, m238 [https://doi.org/10.1107/S1600536810001042]
Bis(cyanido-
κ
C
)bis(cyclohexylamine-
κ
N
)mercury(II)
Ejaz, Islam Ullah Khan and William T. A. Harrison
S1. Comment
As part of our ongoing studies of MX2Y2 complexes (Ejaz et al., 2009), the synthesis and structure of the title compound,
(I), (Fig. 1), are now described.
The HgII atom in (I) adopts what could be described as an extremely distorted HgC
2N2 tetrahedral geometry (Table 1),
arising from its coordination by two cyanide anions and two cyclohexylamine ligands. As well as the gross deviations of the bond angles from nominal tetrahedral values, the Hg—C and Hg—N bond lengths are very different. Indeed, an alternative description of the structure of (I) could be to start with a nominal linear Hg(CN)2 molecule, which is then
weakly coordinated by the two N-bonded ligands (Cingolani et al., 1987). The cyclohexylamine molecules in (I) adopt chair conformations.
In the crystal, the molecules interact by way of N—H···N hydrogen bonds (Table 2), leading to chains in the structure. Surprisingly, the Cambridge Structural Database contains just one crystal structure containing an Hg(CN)2(NR)2 unit
(Cingolani et al., 1987), in which the C—Hg—C bond angles in the two asymmetric molecules are 148.2 (8) and 163.1 (9)°.
S2. Experimental
Mercury(II) cyanide (0.5 g, 2.2 mmol) was dissolved in distilled water (20 ml). Cyclohexylamine (0.44 g, 4.4 mmol) was added and the mixture stirred at room temperature for 15 minutes. A white precipitate formed, which was filtered off, washed with distilled water and dried. Colourless blocks of (I) were recrystallized from methanol.
S3. Refinement
All the hydrogen atoms were placed in calculated positions (C—H = 0.97–0.98 Å, N—H = 0.90 Å) and refined as riding with Uiso(H) = 1.2Ueq(carrier). The highest difference peak is 1.54Å from N3 and the deepest difference hole is 0.89Å
Figure 1
The molecular structure of (I) showing displacement ellipsoids at the 50% probability level.
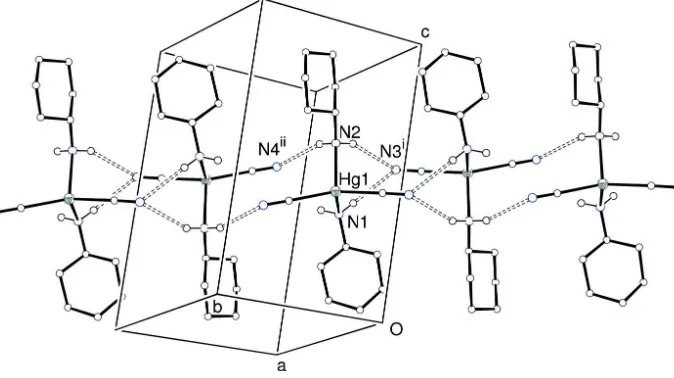
Figure 2
Unit cell packing in (I) with all C-bound hydrogen atoms omitted for clarity and hydrogen bonds indicated by dashed lines. Symmetry codes: (i) –x, –y, 1–z; (ii) 1–x, 1–y, 1–z.
Bis(cyanido-κC)bis(cyclohexylamine-κN)mercury(II)
Crystal data
[Hg(CN)2(C6H13N)2]
Mr = 450.98
Triclinic, P1 Hall symbol: -P 1
a = 7.9283 (4) Å
b = 9.1791 (5) Å
c = 12.2722 (6) Å
α = 93.972 (3)°
β = 99.179 (3)°
γ = 97.258 (3)°
V = 870.95 (8) Å3
Z = 2
F(000) = 436
Dx = 1.720 Mg m−3
Mo Kα radiation, λ = 0.71073 Å
µ = 8.83 mm−1
[image:3.610.137.474.277.466.2]Data collection
Bruker Kappa APEXII CCD diffractometer
Radiation source: fine-focus sealed tube Graphite monochromator
ω scans
Absorption correction: multi-scan
(SADABS; Bruker, 2007)
Tmin = 0.171, Tmax = 0.351
16082 measured reflections 3385 independent reflections 2830 reflections with I > 2σ(I)
Rint = 0.041
θmax = 26.0°, θmin = 2.6°
h = −9→9
k = −11→11
l = −15→15
Refinement
Refinement on F2
Least-squares matrix: full
R[F2 > 2σ(F2)] = 0.061
wR(F2) = 0.193
S = 1.10 3385 reflections 172 parameters 0 restraints
Primary atom site location: structure-invariant direct methods
Secondary atom site location: difference Fourier map
Hydrogen site location: inferred from neighbouring sites
H-atom parameters constrained
w = 1/[σ2(F
o2) + (0.0858P)2 + 12.3401P]
where P = (Fo2 + 2Fc2)/3
(Δ/σ)max = 0.001
Δρmax = 3.17 e Å−3
Δρmin = −1.98 e Å−3
Special details
Geometry. All e.s.d.'s (except the e.s.d. in the dihedral angle between two l.s. planes) are estimated using the full covariance matrix. The cell e.s.d.'s are taken into account individually in the estimation of e.s.d.'s in distances, angles and torsion angles; correlations between e.s.d.'s in cell parameters are only used when they are defined by crystal symmetry. An approximate (isotropic) treatment of cell e.s.d.'s is used for estimating e.s.d.'s involving l.s. planes.
Refinement. Refinement of F2 against ALL reflections. The weighted R-factor wR and goodness of fit S are based on F2,
conventional R-factors R are based on F, with F set to zero for negative F2. The threshold expression of F2 > σ(F2) is used
only for calculating R-factors(gt) etc. and is not relevant to the choice of reflections for refinement. R-factors based on F2
are statistically about twice as large as those based on F, and R- factors based on ALL data will be even larger.
Fractional atomic coordinates and isotropic or equivalent isotropic displacement parameters (Å2)
x y z Uiso*/Ueq
H6A 0.5268 0.2198 0.2672 0.150* H6B 0.3320 0.2358 0.2269 0.150* N1 0.3599 (18) 0.1352 (17) 0.4211 (11) 0.074 (4) H1 0.4662 0.1852 0.4446 0.089* H2 0.3457 0.0643 0.4673 0.089* C7 0.197 (3) 0.355 (2) 0.7345 (14) 0.085 (5) H7 0.0734 0.3208 0.7271 0.102* C8 0.220 (3) 0.509 (2) 0.7259 (16) 0.096 (6) H8A 0.1653 0.5275 0.6528 0.115* H8B 0.3425 0.5431 0.7331 0.115* C9 0.145 (5) 0.598 (3) 0.814 (2) 0.150 (13) H9A 0.1665 0.7025 0.8056 0.180* H9B 0.0215 0.5686 0.8061 0.180* C10 0.232 (5) 0.566 (3) 0.925 (2) 0.134 (10) H10A 0.3523 0.6092 0.9350 0.160* H10B 0.1798 0.6142 0.9812 0.160* C11 0.222 (5) 0.407 (3) 0.940 (2) 0.137 (11) H11A 0.1041 0.3673 0.9433 0.164* H11B 0.2931 0.3946 1.0101 0.164* C12 0.284 (3) 0.324 (2) 0.8463 (15) 0.097 (6) H12A 0.4076 0.3512 0.8523 0.117* H12B 0.2619 0.2191 0.8534 0.117* N2 0.2619 (18) 0.2820 (14) 0.6440 (9) 0.068 (3) H3 0.2471 0.1849 0.6529 0.082* H4 0.3766 0.3111 0.6552 0.082* C13 −0.073 (2) 0.1629 (18) 0.4292 (15) 0.067 (4) N3 −0.196 (2) 0.0797 (19) 0.4154 (15) 0.090 (4) C14 0.282 (2) 0.504 (2) 0.4133 (18) 0.089 (6) N4 0.352 (3) 0.610 (2) 0.395 (2) 0.116 (6)
Atomic displacement parameters (Å2)
U11 U22 U33 U12 U13 U23
C13 0.056 (9) 0.064 (9) 0.083 (11) 0.010 (7) 0.015 (8) 0.018 (8) N3 0.072 (10) 0.090 (11) 0.103 (12) 0.013 (9) 0.001 (8) 0.012 (9) C14 0.067 (10) 0.084 (12) 0.114 (15) −0.004 (9) 0.007 (10) 0.048 (11) N4 0.090 (12) 0.100 (13) 0.153 (19) −0.005 (10) 0.013 (12) 0.034 (13)
Geometric parameters (Å, º)
Hg1—C13 2.076 (17) N1—H2 0.9000 Hg1—C14 2.084 (17) C7—C8 1.41 (3) Hg1—N2 2.404 (12) C7—N2 1.45 (2) Hg1—N1 2.426 (14) C7—C12 1.50 (3) C1—C6 1.45 (3) C7—H7 0.9800 C1—C2 1.47 (3) C8—C9 1.55 (3) C1—N1 1.49 (2) C8—H8A 0.9700 C1—H1A 0.9800 C8—H8B 0.9700 C2—C3 1.58 (3) C9—C10 1.48 (4) C2—H2A 0.9700 C9—H9A 0.9700 C2—H2B 0.9700 C9—H9B 0.9700 C3—C4 1.45 (4) C10—C11 1.48 (4) C3—H3A 0.9700 C10—H10A 0.9700 C3—H3B 0.9700 C10—H10B 0.9700 C4—C5 1.53 (4) C11—C12 1.52 (3) C4—H4A 0.9700 C11—H11A 0.9700 C4—H4B 0.9700 C11—H11B 0.9700 C5—C6 1.55 (3) C12—H12A 0.9700 C5—H5A 0.9700 C12—H12B 0.9700
C5—H5B 0.9700 N2—H3 0.9000
C6—H6A 0.9700 N2—H4 0.9000
C6—H6B 0.9700 C13—N3 1.14 (2) N1—H1 0.9000 C14—N4 1.12 (2)
H2A—C2—H2B 108.8 C10—C9—H9B 110.3 C4—C3—C2 111 (2) C8—C9—H9B 110.3 C4—C3—H3A 109.4 H9A—C9—H9B 108.5 C2—C3—H3A 109.4 C11—C10—C9 114 (2) C4—C3—H3B 109.4 C11—C10—H10A 108.8 C2—C3—H3B 109.4 C9—C10—H10A 108.8 H3A—C3—H3B 108.0 C11—C10—H10B 108.8 C3—C4—C5 106 (3) C9—C10—H10B 108.8 C3—C4—H4A 110.5 H10A—C10—H10B 107.7 C5—C4—H4A 110.5 C10—C11—C12 111 (2) C3—C4—H4B 110.5 C10—C11—H11A 109.4 C5—C4—H4B 110.5 C12—C11—H11A 109.4 H4A—C4—H4B 108.7 C10—C11—H11B 109.4 C4—C5—C6 111 (3) C12—C11—H11B 109.4 C4—C5—H5A 109.4 H11A—C11—H11B 108.0 C6—C5—H5A 109.4 C7—C12—C11 113 (2) C4—C5—H5B 109.4 C7—C12—H12A 109.1 C6—C5—H5B 109.4 C11—C12—H12A 109.1 H5A—C5—H5B 108.0 C7—C12—H12B 109.1 C1—C6—C5 109 (2) C11—C12—H12B 109.1 C1—C6—H6A 110.0 H12A—C12—H12B 107.8 C5—C6—H6A 110.0 C7—N2—Hg1 123.3 (12) C1—C6—H6B 110.0 C7—N2—H3 106.5 C5—C6—H6B 110.0 Hg1—N2—H3 106.5 H6A—C6—H6B 108.4 C7—N2—H4 106.5 C1—N1—Hg1 123.1 (12) Hg1—N2—H4 106.5 C1—N1—H1 106.6 H3—N2—H4 106.5 Hg1—N1—H1 106.6 N3—C13—Hg1 177.0 (15) C1—N1—H2 106.6 N4—C14—Hg1 178.2 (19)
C6—C1—C2—C3 57 (3) N2—C7—C8—C9 176 (2) N1—C1—C2—C3 −177 (2) C12—C7—C8—C9 −60 (3) C1—C2—C3—C4 −62 (4) C7—C8—C9—C10 59 (3) C2—C3—C4—C5 64 (4) C8—C9—C10—C11 −53 (4) C3—C4—C5—C6 −60 (4) C9—C10—C11—C12 52 (4) C2—C1—C6—C5 −56 (4) C8—C7—C12—C11 55 (3) N1—C1—C6—C5 179 (3) N2—C7—C12—C11 177 (2) C4—C5—C6—C1 55 (4) C10—C11—C12—C7 −51 (3) C6—C1—N1—Hg1 66 (2) C8—C7—N2—Hg1 −58 (2) C2—C1—N1—Hg1 −63 (2) C12—C7—N2—Hg1 −179.6 (13) C13—Hg1—N1—C1 69.3 (14) C13—Hg1—N2—C7 −77.6 (14) C14—Hg1—N1—C1 −85.7 (14) C14—Hg1—N2—C7 80.9 (14) N2—Hg1—N1—C1 168.3 (14) N1—Hg1—N2—C7 −178.2 (14)
Hydrogen-bond geometry (Å, º)
D—H···A D—H H···A D···A D—H···A
N2—H3···N3i 0.90 2.48 3.31 (2) 154
N2—H4···N4ii 0.90 2.37 3.22 (2) 157