MICROBIAL STRATIFICATION AND INFERRED MICROBIALLY CATALYZED PROCESSES ALONG A DEEP-SEA HYPERSALINE CHEMOCLINE
Andrew Hyde
A thesis submitted to the faculty at the University of North Carolina at Chapel Hill in partial fulfillment of the requirements for the degree of Master of Science in the
Department of Marine Sciences in the College of Arts and Sciences.
Chapel Hill 2018
Approved by:
Andreas P. Teske
Carol Arnosti
Marc J. Alperin
©2018
Andrew Hyde
ALL RIGHTS RESERVED
ABSTRACT
Andrew Hyde: Microbial stratification and microbially catalyzed processes along a deep-sea hypersaline chemocline
(Under the direction of Andreas Teske)
The Gulf of Mexico contains the world’s largest anoxic hypersaline seafloor basin, Orca Basin. The water contained in this 400 km
2bathymetric depression is roughly eight times as saline as the overlying seawater. The resulting density contrast
prevents the 200 m deep brine layer from mixing with seawater, creating an interface that traps particles of organic matter falling through the water column. The
concentrated organic matter at the interface is hypothesized to host a thriving
bacterial community that has yet to be characterized. Here, I present the results of
the first bacterial community analysis by high-throughput sequencing ever conducted
on the interface and brine pool of Orca Basin. I discuss how the bacterial community
changes along a 550 m vertical transect with regards to oxygen, salinity, and organic
matter gradients. Finally, a comparison of the geochemical and bacterial composition
of Orca Basin to brine pools in the Mediterranean and Red Seas reveals the uniqueness
of Orca Basin in a global context. This research adds to our current knowledge of
biodiversity in global hypersaline habitats and has implications for our understanding
of sulfur and carbon cycling in extreme environments.
TABLE OF CONTENTS
LIST OF FIGURES ... vi
LIST OF TABLES ... vii
LIST OF ABBREVIATIONS ... viii
1 INTRODUCTION ... 1
1.1 O
RIGINS OFDHAB
S IN THEM
EDITERRANEAN ANDR
EDS
EAS... 2
1.2 O
RIGINS OFDHAB
S IN THEG
ULF OFM
EXICO... 3
1.3 M
ICROBIAL LIFE INDHAB
S... 5
2 MATERIALS AND METHODS ... 8
2.1 S
AMPLING ANDDNA
EXTRACTIONS... 8
2.2 S
EQUENCING... 8
2.3 D
ATAA
NALYSIS... 9
2.3.1 Orca Basin ... 9
2.3.2 Other DHABs ... 11
3 RESULTS ... 13
3.1 W
HOLE BACTERIAL COMMUNITY... 13
3.2
Α-
DIVERSITY... 14
3.3
Β-
DIVERSITY... 16
3.4 E
XAMINATION OF SPECIFIC CLADES... 19
3.4.1 Marinimicrobia (SAR406, Marine Group A) ... 19
3.4.2 Alphaproteobacteria ... 22
3.4.3 Gammaproteobacteria ... 22
3.4.4 Deltaproteobacteria ... 24
3.4.5 Actinobacteria ... 25
3.4.6 MSBL2 ... 26
3.5 M
EDITERRANEAN ANDR
EDS
EADHAB
S... 27
4 DISCUSSION ... 32
4.1 S
ULFUR CYCLING IN THEO
RCAB
ASIN CHEMOCLINE... 32
4.2 C
ARBON METABOLISM IN THEO
RCAB
ASIN CHEMOCLINE... 34
4.3 C
OMPARISON OFO
RCAB
ASIN TO OTHERDHAB
S... 36
REFERENCES ... 39
LIST OF FIGURES
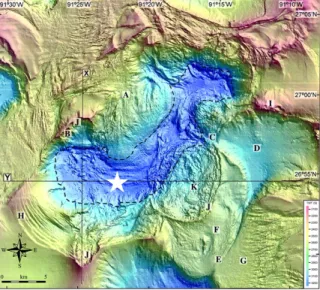
Figure 1 Map of sampling location in the Gulf of Mexico.. ... 8
Figure 2. Class-level bacterial community composition for Orca Basin ... 14
Figure 3. Measures of alpha-diversity in the Orca Basin chemocline ... 16
Figure 4. Principle Coordinate analyses) ... 18
Figure 5. Distribution of Marinimicrobia along the Orca Basin halocline ... 19
Figure 6. Phylogenetic placement of OTU1216. ... 21
Figure 7. Distribution of Alphaproteobacteria along the Orca Basin halocline ... 22
Figure 8. Distribution of Gammaproteobacteria along the Orca Basin halocline ... 23
Figure 9. Distribution of Deltaproteobacteria along the Orca Basin halocline ... 24
Figure 10. PCoA analysis on the Deltaproteobacterial community ... 25
Figure 11. Distribution of Actinobacteria along the Orca Basin halocline ... 26
Figure 12. Distribution of WWE1 phylum along the Orca Basin halocline ... 27
Figure 13. Comparison of the interface bacterial communities of the different DHABs. ... 28
Figure 14. Comparison of bacterial communities in different brine pools ... 29
Figure 15. Comparison of the Deltaproteobacteria in different
DHAB interfaces and gradients ... 30
LIST OF TABLES
Table I. Geochemical properties of global DHABs compiled from literature. ... 7 Table II. Available sequence data from other brine pools
in the Mediterranean and Red Sea ... 12
LIST OF ABBREVIATIONS
DHAB Deep hypersaline anoxic basin
MSBL2 Mediterranean Sea Brine Lake (group) 2
Myr Million years
OTU Operational taxonomic unit
PCoA Principle coordinate analysis
1 Introduction
Deep hypersaline anoxic basins (DHABs) are some of the harshest environments on Earth. These otherworldly hydrographic features present numerous challenges to life, such as extreme salinities (over 500 g/L in some cases), high pressures, elevated temperatures, and high concentrations of sulfides or heavy metals. First discovered in 1946-7 by the Swedish R/V Albatross in t the Red Sea
1, this “abnormal water” has since been found in the Mediterranean Sea and the Gulf of Mexico. The limited extent of this phenomenon is owed to the unique set of geological features that must be present for the formation of DHABs: namely, the formation of an evaporite layer and its subsequent dissolution.
Underneath each DHAB lies a thick layer of salt, serving as the source for the
hypersaline water found in these deep sea brine pools. The particulars of how these
extensive salt deposits formed vary by site, but the main principle is the same. When
seawater evaporates, it leaves behind the dissolved ions, which subsequently form
solids (“salt”) in a characteristic order. When 50% of the seawater has evaporated,
carbonate minerals (e.g. CaCO
3) precipitate out of solution. At 80% water loss,
gypsum (CaSO
4) precipitates, followed by halite (NaCl) at 90% water loss
2. Lastly, K-
Mg salts will only precipitate when only 2% of the original volume of seawater
remains
2.
This happens on oceanic scales when a body of water is isolated from other water bodies, leading the formation of an evaporative basin. Sedimentation covers these evaporative layers, and when a new input of water arrives (due to a change in geologic conditions), the evaporite layers remain buried under the new sediment- seawater interface.
1.1 Origins of DHABs in the Mediterranean and Red Seas
The evaporites in the Red and the Mediterranean Seas were formed in the late Miocene (~5-8 Myr) when these two bodies of water were connected
3,4. During this so-called “Messinian Salinity Crisis”, the oceanic connection between the
Mediterranean/Red Sea and the Atlantic Ocean was severed, forming an evaporative basin. The exact mechanism behind the closing of the Strait of Gibraltar is unresolved and was originally attributed to eustatic sea-level fall due to glaciation
5. More recent work has proposed that the closing of the Mediterranean-Atlantic gateway was caused by magmatic intrusions and asthenospheric upwelling along the Iberian and African margins
6,7. Evidence supporting this hypothesis comes from changes in igneous geochemistry from this time period as well as thermochemical modeling
6.
Once these salt layers are buried, they may remain undisturbed unless other geological processes act to expose them in some manner. While the origins of the salt deposits in the Mediterranean and Red Seas are the same, the subsequent processes that have exposed them are very different.
All of the DHABs in the Mediterranean Sea are located in the eastern region along a structure called the Mediterranean Ridge
8. Here, the African plate is
subducting underneath the Eurasian and Anatolian plates; this subduction exposes the
1.5-km thick
7Messinian evaporites to ambient seawater, thus initiating their local dissolution. If this occurs near a bathymetric depression in the sediment, the highly dense brine collects in a brine pool and does not mix with the overlying water column
8. Most DHABs are dominated by Na
+and Cl
-, as they are fueled largely by halite (see Table I). However, a few DHABs in the eastern Mediterranean (e.g.
Discovery and Kryos Basin) are instead formed as later stage evaporites (e.g.
bischofite, [(MgCl
2) 6H
2O]) are exposed and dissolved to form brine water
2,9,10. This is possibly due to the extent of evaporation during the Messinian Salinity Crisis
6,7, since Mg-based salts only theoretically precipitate under extreme evaporative events (see above)
2.
The Messinian salt deposits in the Red Sea share an origin with those in the Mediterranean Sea since the two were connected during the Miocene epoch
3. The tectonic processes that expose the evaporites differ significantly between the two seas. While the Mediterranean DHABs owe their existence to tectonic subduction, the evaporites in the Red Sea are exposed by an active spreading center at the African- Arab plate boundary
4,11-13. There is not one mechanism that explains the formation of the more than 25 DHABs in the Red Sea
14; however, in general, hydrothermal
influence of the spreading center results in very hot (Atlantis II Deep is currently 71°C and rising), metal-rich, sulfidic brine waters
11,12,14.
1.2 Origins of DHABs in the Gulf of Mexico
The Gulf of Mexico is the only other place on Earth we have discovered DHABs
15,
providing a valuable site to compare the Red and Mediterranean DHABs to. It is also
the location where the largest DHAB is found, Orca Basin (400 km
2)
15. Given its
geographic distance from the Red and Mediterranean Seas, it perhaps not surprising that the source of salt for Orca Basin is different than other DHABs. Instead of the late Miocene (~5.5 myr
6) era depsoits, Orca Basin is fed by a far more ancient mid- Jurassic (Callovian, ~165 myr) salt deposit, the “Louann salt”
16. The 3-4 km thick Louann salt was deposited as parts of the Gulf of Mexico were isolated from the nascent Atlantic Ocean, forming an evaporite basin in a similar fashion to the
Messinian Salinity Crisis
16,17. Subsequent sedimentation and a re-flooding of the Gulf lead to the burial of the world’s largest salt deposit
16,17.
In the Mediterranean and Red Seas, the salt deposits are exposed via active tectonic processes (subduction in the Eastern Mediterranean and rifting in the Red Sea). However, the Louann salt deposit is exposed through a process called salt tectonics
16,17. Newly deposited sediment puts more pressure on the sediment below it; as the pressure increases, the sediment is “de-watered”, forcing the porewater upwards and thereby increasing the density of the sediment to approx. 2.6-2.8 g/cm
3(
9). The Louann salt deposit has a density of approximately 2.2 g/cm
3and therefore rises in the sediment column until it achieves neutral buoyancy
9.
In some areas of the Gulf of Mexico, these salt diapirs get very close to the
sediment-water interface and may even be exposed to ambient seawater
18. One of
these outcroppings happens to be adjacent to a bathymetric depression in the
northern Gulf of Mexico. As seawater laterally advects over this exposed salt, the
subsequent increase in density causes the newly formed brine water to sink into the
basin. This is in contrast to the Mediterranean and Red Sea DHABs, which have salt
sources beneath the basin (see above). It is thought that this process has been
happening in Orca Basin for ~8000 years
19, resulting in a current brine volume of 13.3 km
3. Orca Basin is divided two lobes or sub-basins: a northern and a southern basin separated by a shallower, more narrow saddle (see Figure 1).
1.3 Microbial life in DHABs
Salt presents one of the harshest constraints on microbial life by increasing the osmotic pressure on a cell as well as decreasing the water activity
20. Some DHABs have total salinities of 510 g/kg H
2O, which reduces the activity of water to 0.382, which is near the theoretical lower limit for known life
10. Despite these hostile conditions, life persists in DHABs, as revealed by monitoring primary productivity
21, qPCR
22, and metatranscriptomic studies
23.
The interfaces of these DHABs also serve as an interesting habitat for any potential inhabitants by trapping organic matter that falls through the water column once the density of the particle is matched by the density of the fluid. These
“particle traps” are rich in organic matter and provide a unique microbial niche above the brine pool. In the case of Orca Basin, the concentration of DOC was shown to be 0.3 mM at the interface, compared to >0.1 mM in the overlying water column
24. Further work utilizing δ
13C and box models indicated the isotopically light DIC pool at the interface (δ
13C -20‰ compared to δ
13C 0‰ in the overlying seawater) was likely due to the remineralization of organic matter at the interface
19. No further work has been published on this problem.
The metabolism and identities of microbial life in Mediterranean and Red Sea
DHABs has been fairly well characterized
10,22,23,25-43, but published microbial studies on
Orca Basin are limited
19,44-47and no bacterial community sequence data from the
water column or brine pool are publically available. Here we present the first
characterization of Orca Basin’s bacterial community.
Temp (°C)
Salinity (g/L)
Na+
(mM) Cl- (mM)
Mg2+
(mM) K+
(mM)
Ca2+
(mM)
SO42- (mM)
HS- (mM)
Br- (mM)
NH4+
(mM) CH4 (mM)
Max brine depth (m)
Interface thickness
(m)
Sources
Discovery 14.5 510 68 9491 4995 19.6 2.6 96 0.7 N.D. N.D. 0.031 60 N.D.
van der Wielen et al, 2005; Yakimov
et al 2014 Kryos 14.5 471 125 9043 4379 80 1 320 N.D. N.D. N.D. N.D. 160 2.5 Yakimov et al,
2014 Thetis 15.06 348 4760 5300 604 230 9 265 2.12 6 2.75 N.D. N.D. 1 La Cono et al,
2011 L’Atalante 14.34 352 4670 5290 533 300 5.9 323 2.9 5 2.87 0.52 60 1.5
La Cono et al, 2011; van der Wielen et al,
2005 Bannock 15.12 323 4200 5380 644 127 16.3 135 2.9 9 3.35 0.45 500 N.D.
La Cono et al, 2011; van der Wielen et al,
2005 Tyro 14.17 321 5300 5350 71.1 19.2 35.4 52.7 2.1 1.28 1.3 N.D. N.D. N.D. La Cono et al,
2011 Urania 18.32 240 3505 3730 315 122 31.6 107 15 9 2.87 5.56 200 N.D. La Cono et al,
2011 Medee 15.44 345 4178 5259 788 471 2.8 201 1.64 65.3 2.35 0.0139 N.D. 50 Yakimov et al,
2013 Atlantis II
Deep 67.8 262 4900 5200 29.1 63.2 142.2 8.3 N.D. 1.5 0.806 N.D. N.D. 4 Ngugi et al, 2015 Discovery
Deep 44.8 260 4700 5100 33 60.8 134.1 8.4 N.D. 1.5 0.852 N.D. N.D. 35 Ngugi et al, 2015 Erba Deep 28.2 181 3200 3300 71.4 34.5 32.7 41.6 N.D. 1.4 0.691 N.D. N.D. 10 Ngugi et al,
2015 Kebrit
Deep 23.4 260 4800 5000 118.7 35.5 53.6 27.7 N.D. 3 2.657 N.D. N.D. 3 Ngugi et al, 2015 Nereus
Deep 30.1 224 3500 4200 67.4 71.4 224.7 10.5 N.D. 1.5 1.116 N.D. N.D. 12 Ngugi et al, 2015 GC233 N.D. 121 1751 2092 9.7 22 36 1 N.D. N.D. 11 N.D. N.D. N.D. Joye et al,
2005 GB425 N.D. 130 1790 2114 8.7 89 59 1 N.D. N.D. 7.6 N.D. N.D. N.D. Joye et al,
2005 Orca
Basin 5 250 4240 4450 42.4 17.2 29 20 N.D. N.D. 0.5 N.D. N.D. 80 m
Shokes et al, 1979 ; van Capellen et al, 1998; this Table I. Geochemical properties of global DHABs compiled from literature.
7
2 Materials and methods 2.1 Sampling and DNA extractions
A CTD rosette sampler was deployed in Southern Orca Basin (26.91206, - 91.37418) on 14 April 2014 from the R/V
Atlantis. Twenty-three samples were taken at various depths (see figure) above, within, and below the halocline. On board, 700 mL water were filtered through 0.2 µm Millipore GTTP polycarbonate filters. The filtrate was discarded and filters were stored and
transported at -80°C until DNA extraction in the home lab.
DNA was extracted from the filters using the MoBio PowerSoil Kit™ (Qiagen;
Carlsbad, CA). PCR amplification and Nanodrop measurements were used to confirm the presence of DNA.
2.2 Sequencing
The V1-V2 region of the 16S rRNA gene was targeted using the PCR primers 8F (5’- GTTTGATCMTGGCTCAG-3’) and 338R (3’-TGAGGATGCCCTCCGT-5’)
48and
sequenced bidirectionally using the Illumina MiSeq platform at the University of Texas at Austin’s Genomic Sequencing and Analysis Facility.
Figure 1 Map of sampling location in the Gulf of Mexico. The star indicates where the CTD was cast and samples collected (26.91206, -91.37418). Sample location: 26 54 74N; 91 22 42W
Sample date: 16 April 2014 Sample depth: 1850 - 2390 m
Map from: Pilcher et al, 2007
2.3 Data Analysis 2.3.1 Orca Basin
Forward and reverse reads were joined using SeqPrep
49. De novo operational taxonomic units (OTUs) were defined at 0.97 identity and picked using the UCLUST algorithm
50. One representative sequence was picked for each OTU using the default settings on QIIME
51. Taxonomy was assigned to each representative sequence using four different reference databases: the Ribosomal Database Project (RDP)
52, UCLUST
50
, SortMeRNA
53, and mothur. RDP was able to assign taxonomic identity to the most sequences, and is therefore presented below. All singleton sequences were removed as well as all OTUs found in only one sample.
The representative sequences were aligned using PyNAST (Python Nearest Alignment Space Termination
54)- all unsuccessfully aligned sequences were removed.
Chimera Slayer
55was used to identify chimeric sequences, which were subsequently removed. Finally, a tree was constructed for all OTUs using FastTree2
56.
2.3.1.1 Statistical analyses
Samples were rarefied in PhyloSeq
57. All α-diversity analyses were carried out on the rarefied dataset; while β-diversity analyses were carried out on both a rarefied and unrarefied dataset
58.
α-diversity was calculated using three different metrics: OTU counts (accounts for richness), ACE richness (accounts for
richness), and Shannon Diversity (accounts for richness and evenness).
SACE = Sabund+ Srare CACE
+ F1 CACE
ACE2
Equation 1 . ACE diversity index-
ACE values were calculated using Equation 1. Where S
abundis the number of species observed more than ten times for a given sample, and S
rarethe number of species observed less than ten times in a given sample
59.
Shannon-diversity indices were calculated using Equation 2
60. Where P
iis the fraction of the dataset the i
thOTU comprises. This
frequency is multiplied by the natural log of itself and iterated for all OTUs.
For β-diversity, three different dissimilarity matrices were calculated for both the rarefied and unrarefied dataset: Weighted UniFrac, Unweighted UniFrac, and Bray-Curtis Dissimilarity.
The Weighted UniFrac dissimilarity matrix was calculated using Equation 3.
Here, n is the number of branches in the phylogenetic tree provided, b
iis the length of branch i. A
iand B
iare the number of sequences that descend from the i
thbranch for samples A and B. A
Tand B
Tare the total number of sequences in samples A and B
61.
UniFrac (unweighted) calculations were done using Equation 4. Here, N is the number of nodes in the provided phylogenetic tree, l
iis the distance between
node i and its parent node, and A
iand B
iare set to either 0 or 1 for absence or presence of a given node in samples A or B
62.
H0 = X
Piln Pi
Equation 2. Shannon Diversity Index
u = Xn
i
bi⇥ Ai
AT
Bi
BT
Equation 3. Equation for Weighted Unifrac dissimilarity matrix calculations
u =
PN
i=1li|Ai Bi| PN
i=1limax(Ai, Bi)
Equation 4. Unweighted Unifrac calculation
The Bray-Curtis Dissimilarity matrix is calculated according to Equation 5.
Where A and B are communities and S
A,iand S
B,iare the number of individuals for the i
thOTU in
communities A and B
63. 2.3.2 Other DHABs
DNA sequences were compiled from all papers written on DHABs that included 16S rRNA gene sequences from the GenBank database
64(Table II). Data analyses were conducted in the same manner as the Orca Basin sequences.
D = 1 2
Pmin (SA,i, SB,i) PSA,i+P
SB,i
Equation 5. Bray-Curtis Dissimilarity formula
Reference Sites Sequencing method Nucleotide accession numbers Number of sequences downloaded van der
Wielen et al, 2005
L’Atalante (brine), Urania Basin (brine), Discovery Basin (brine and interface),
Bannock Basin (brine) full-length RT-PCR AY226191:AY226381 (Bacteria) 150
Borin et
al, 2009 Urania Basin (brine) full-length RT-PCR AY164322-AY164333 (Archaea); AY226324-AY226340(Bacteria);
AY164429:AY164455 (Bacteria); AY226377-AY226381(Archaea); AY547867-
AY548016 (Bacteria); DQ453257-DQ453476 (Bacteria and Archaea) 730 Yakimov
et al,
2014 Kryos (gradient) full-length RT-PCR KJ922395-KJ922487 (Bacteria and Archaea) 67
Daffonchi no et al,
2006 Bannock (gradient) full length 16S gene AM157647:AM157656 (Bacteria); AY547745:AY547866 (Bacteria) ;
DQ289238:DQ289401 (Bacteria) 290
Pachiadaki et al,
2014 Thetis partial 16S from
RNA-seq
metatranscriptome n/a None
Yakimov et al,
2007 L’Atalante (gradient) full length RT-PCR DQ453160:DQ453256 (Bacteria and Archaea); DQ453461:DQ453476 105 La Cono et
al, 2011 Thetis (gradient) full length RT-PCR HQ658706:HQ658735 28
Ngugi et al, 2015
Atlantis II Deep (interface), Kebrit Deep (interface), Discovery Deep (interface), Erba
Deep (interface), Nereus Deep (interface)
V3-V6 region; 454 Pyrosequencing;
full-length 16S gene SRP034153 (Pyrosequencing); KF954222:KF954277 (Archaea) (Sanger) Data request pending Wang et
al, 2011 Atlantis II Deep (brine) partial 16S from 454
metagenome n/a Data request
pending Wang et
al, 2013 Atlantis II Deep (brine), Discovery (brine) Assigning taxonomy to ORFs in 454
metagenome n/a None
Guan et al, 2015
Atlantis II Deep (interface), Kebrit Deep (interface), Discovery Deep (interface), Erba
Deep (interface), Nereus Deep (interface) full length 16S gene KJ881441:KJ882283 (Archaea); KM018335:KM019141 (Bacteria);
KP083299:KP083370 (Bacteria 879
Bougouffa et al,
2013
Atlantis II Deep (gradient), Discovery Deep
(interface and brine) V5-V6; 454
Pyrosequencing SRA052277 Data request
pending
Table III. Available sequence data from other brine pools in the Mediterranean and Red Sea
12
3 Results 3.1 Whole bacterial community
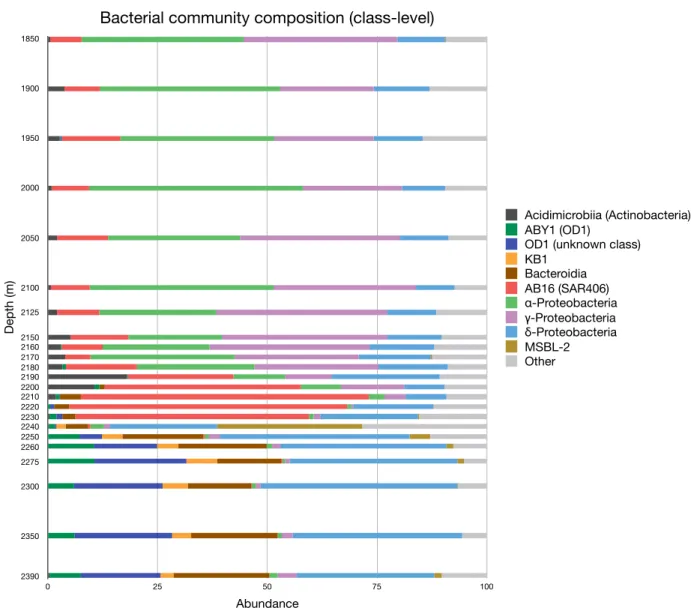
Taxonomic classifications at the class-level for all bacterial sequences are shown
in Figure 2. Both Alpha- and Gammaproteobacterial sequence abundance decrease
dramatically along the chemocline (2150 m – 2210 m), whereas “AB16”-affiliated
sequences (a class-level designation in the phylum Marinimicrobia/SAR406) increases
in abundance along the same interval. Sequences recovered from the brine pool
(2240-2390 m) show an entirely different bacterial community compared to the
overlying water column and Orca Basin’s diffuse brine-seawater interface.
Figure 2. Class-level bacterial community composition for Orca Basin. Abundance of sequences in the dataset is shown on the x-axis; depth (in meters) below sea surface is shown on the y-axis.
3.2 α-diversity
The three measures of diversity within sample are shown in Figure 3. The number of OTUs is shown in the first panel and is lowest at 2350m and 2275m, both with 45 observed OTUs. The highest number of OTUs was detected at 2160m, with 175
Bacterial community composition (class-level)
Depth (m)
1850
1900
1950
2000
2050
2100 2125 2150 2160 2170 2180 2190 22002210 2220 22302240 2250 2260 2275 2300
2350
2390
Abundance
0 25 50 75 100
Acidimicrobiia (Actinobacteria) ABY1 (OD1)
OD1 (unknown class) KB1
Bacteroidia AB16 (SAR406) α-Proteobacteria γ-Proteobacteria δ-Proteobacteria MSBL-2 Other
distinct OTUs. Sequences were assigned to the same OTU if they showed a minimum of 97% sequence identify.
The ACE index is a way of estimating “richness” of microbial communities (number of OTUs) using rare taxa in a given dataset. The average number of
estimated OTUs per sample is 185 ± 88 (standard deviation) compared to the 107 ± 43 OTUs actually observed in the dataset. The highest estimated richness is at 2160m (water column) with an ACE estimation of 364 OTUs (175 OTUs were actually
observed). The lowest richness was estimated to be at 2390 m (bottom of the brine pool) with an ACE index of 71 predicted OTUs (56 actual observed).
Another way of quantifying α-diversity is to take relative frequencies into account- “evenness” (richness only takes presence/absence into account). The
Shannon Diversity Index takes both evenness and richness into account, and reveals a
clear pattern along the Orca Basin chemocline: The highest diversity occurs in the
water column at 1950 m. The lowest diversity occurs at the halo- and redox cline at
2220m, and increases slightly below the interface and into the brine pool.
Figure 3. Measures of alpha-diversity in the Orca Basin chemocline. Three diversity metrics are shown- observed OTUs, ACE index, and the Shannon index (see text for description).
Depth increases along the y-axis whereas the diversity metrics are shown on the x-axis. The color of the dot corresponds to the salinity for that sample with increasing salinity being denoted by darkening of the marker.
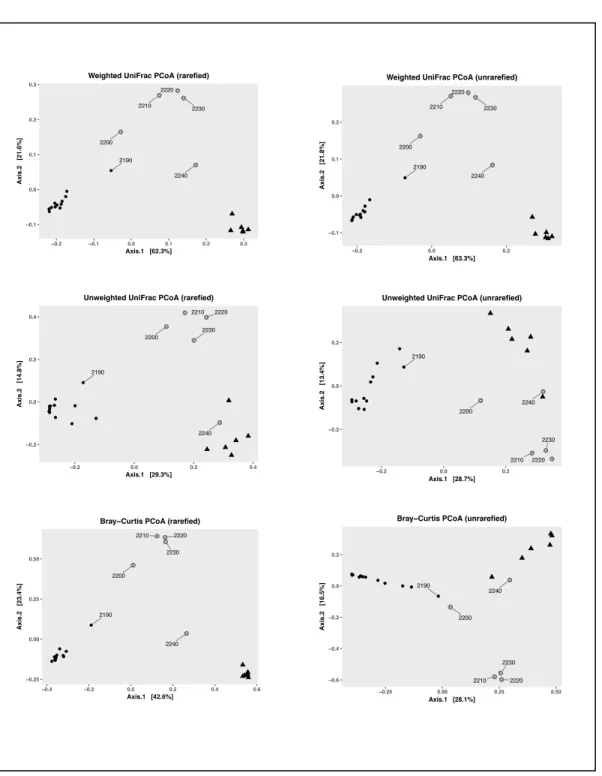
3.3 β-diversity
Six principle coordinate-analyses were done on the whole community dataset (Figure 4). The three distance matrices (Weighted UniFrac, Unweighted UniFrac, and Bray-Curtis Dissimilarity) all yielded more or less the same pattern on the rarefied dataset. All three groups (water column, interface, brine pool) form distinct clusters on a Cartesian plane. Transition communities were detected at 2190 m, 2200 m, and 2240 m.
●
●
●
●
●
●
●
●
●
●
●
●
●
●
●
●
●
●
●
●
●
●
●
Shannon
2.5 3.0 3.5 4.0
2000
2200
2400
Shannon diversity index
Depth (m)
200 150 100 50 Salinity (PSU) Alpha diversity− evenness
●
●
●
●
●
●
●
●
●
●
●
●
●
●
●
●
●
●
●
●
●
●
●
ACE
100 150 200 250 300 350
2000
2200
2400
Estimated total OTUs
Depth (m)
200 150 100 50 Salinity (PSU) Alpha diversity− richness
●
●
●
●
●
●
●
●
●
●
●
●
●
●
●
●
●
●
●
●
●
●
●
Observed
50 100 150
2000
2200
2400
Observed OTUs
Depth (m)
200 150 100 50 Salinity (PSU) Alpha diversity− observed OTUs
Weighted UniFrac takes abundance into account, instead of just
presence/absence (see Methods for details). Therefore, it better accounts for the low diversity in interface samples and is a better representation of the similarities and dissimilarities of the different bacterial communities. The variation within the dataset is primarily explained by Axis 1 (62.3% for the rarefied dataset; 63.3% for the
unrarefied). Because the components in a PCoA are calculated using non-linear
functions of the original variations (as opposed to linear functions in PCA- principle
components analysis), it is not possible to directly translate an axis to a physical,
environmental variable.
●
●
●
●
●
●
●
●
●
●
●
●
●
●
●
●
●
●
●●
●
●
●●
●
●
●
●
●
●
● ●
●
2190 ● 2200
2210 2220
2230
2240
−0.1 0.0 0.1 0.2 0.3
−0.2 −0.1 0.0 0.1 0.2 0.3
Axis.1 [62.3%]
Axis.2 [21.6%]
Description
●●
●●
Interface Pool Water column Weighted UniFrac PCoA (rarefied)
●
●
●
●
●
●
●
●
●
●
●
●
●
●
●
●
●
●
●
●
●
●●
●
●
●
●
●
●
●
● ●
●
● 2190
2200
2210 2220 2230
2240
−0.2 0.0 0.2 0.4
−0.2 0.0 0.2 0.4
Axis.1 [29.3%]
Axis.2 [14.8%]
Description
●●
●●
Interface Pool Water column Unweighted UniFrac PCoA (rarefied)
●
●
●
●
●
●
●
●●
●
●
●
●
● ●
●
●
●
●
●
●●
●●●●
●●
●
●
● ●●
● 2190
2200
2210 2220
2230
2240
−0.25 0.00 0.25 0.50
−0.4 −0.2 0.0 0.2 0.4 0.6
Axis.1 [42.6%]
Axis.2 [23.4%]
Description
●●
●●
Interface Pool Water column Bray−Curtis PCoA (rarefied)
●
●●
●
●
●●
●
●
●
●
●
●
● ●
●
●
●
●●
●●●●
●
●
●
●
●
●
● ●
●
2190 ● 2200
2210 2220
2230
2240
−0.1 0.0 0.1 0.2
−0.2 0.0 0.2
Axis.1 [63.3%]
Axis.2 [21.8%]
Description
●●
●●
Interface Pool Water column Weighted UniFrac PCoA (unrarefied)
●
●
●
●
●
●
●
●●
●
●
●
●
●
●
●
●
●
●
●
●
●
●
●
● ●
●
●
●
●
●
●
●
● 2190
2200
2210 2220 2230 2240
−0.2 0.0 0.2
−0.2 0.0 0.2
Axis.1 [28.7%]
Axis.2 [13.4%]
Description
●●
●●
Interface Pool Water column Unweighted UniFrac PCoA (unrarefied)
●
●
●
●
●
●
●
●●
●
●
●
●
●
●
●
● ●
●
●
●
●
●●● ●
●
●
●
●
● ●●
● 2190
2200
2210 2220
2230 2240
−0.6
−0.4
−0.2 0.0 0.2
−0.25 0.00 0.25 0.50
Axis.1 [28.1%]
Axis.2 [16.5%]
Description
●●
●●
Interface Pool Water column Bray−Curtis PCoA (unrarefied)
●
●
●
●
●
●●
●
●
●
●
●
●
● ●
●
●
●
●●
●
●●●
●
●
●
●
●
●
● ●
●
2190 ● 2200
2210 2220
2230
2240
−0.1 0.0 0.1 0.2
−0.2 0.0 0.2
Axis.1 [63.3%]
Axis.2 [21.8%]
Description
●●
●● Interface Pool Water column Weighted UniFrac PCoA (unrarefied)
Figure 4. Principle Coordinate analyses for the rarefied and unrarefied datasets. Three different distance metrics are shown (Weighted UniFrac, Unweighted UniFrac, and Bray-Curtis Dissimilarity)
3.4 Examination of specific clades
3.4.1 Marinimicrobia (SAR406, Marine Group A)
Marinimicrobia (formerly known as SAR406 and Marine Group A) is a bacterial phylum lacking any cultured representatives.
65,66The abundance and distribution of Marinimicrobia sequences is shown in Figure 5. Overall, the phylum is represented by approximately 10% of the sequences in the water column; it is extremely enriched at the interface (~65% of the total community) and completely absent in the brine pool.
The dominant order-level lineage within the Marinimicrobia, Arctic96B-7, is found in the brine pool interface and in the water column, the latter habitat also contains a small community of ZA3648c, another order-level lineage.
Figure 5. Distribution of Marinimicrobia (SAR406) along the Orca Basin halocline at three different taxonomic resolutions. Sequence abundance (x-axis) is plotted in percent of the total bacterial community sequence dataset
Within the order-level lineage Arctic96B-7, there are two predominant family- level lineages: A714017 and Sc-NB04 with the former being far more abundant above
2000
2200
2400
0 20 40 60 80
Percent of bacterial community
Depth (m)
OTU OTU_1216
Most abundant Marinimicrobia OTU
2000
2200
2400
0 20 40 60 80
Percent of bacterial community
Depth (m)
Family f__
f__A714017 f__AEGEAN_185 f__Sc−NB04
Most abundant Marinimicrobia families
2000
2200
2400
0 20 40 60 80
Percent of bacterial community
Depth (m)
Order o__Arctic96B−7 o__ZA3648c
Most abundant Marinimicrobia orders
the interface and the later being nearly absent in all samples other than those from the interface
52. Interestingly, a single OTU (defined at 0.97 similarity) within Sc-NB04 accounts for 58% of the total bacterial sequences at 2210m (Figure 5). Below the interface (2220m) this OTU disappears along with the rest of the Marinimicrobial sequences.
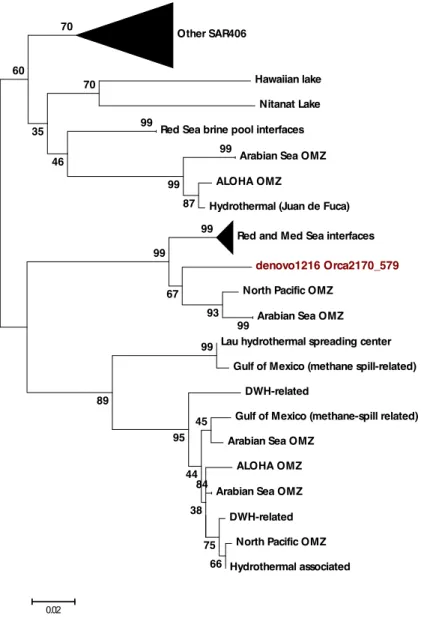
Phylogenetic placement of this dominant Marinimicrobial OTU (“denovo1216”) is shown in Figure 6. A maximum-likelihood tree shows a close clustering with
Marinimicrobia from DHABs in the Mediterranean and Red Seas as well as oxygen
minimum zones (OMZs) in the Red Sea and the North Pacific. A very tight clustering
was observed by site (i.e. all Nitinat Lake sequences formed a clade) and branches
were therefore collapsed for clarity.
Figure 6. Maximum-Likelihood tree constructed for denovo1216 from the Orca Basin interface. Values shown are for 100 bootstrap replicates with scores less than 35 not shown. Tightly clustered branches are collapsed for clarity.
Other SAR406
Hawaiian lake Nitanat Lake Red Sea brine pool interfaces
Arabian Sea OMZ ALOHA OMZ
Hydrothermal (Juan de Fuca) Red and Med Sea interfaces
denovo1216 Orca2170_579 North Pacific OMZ
Arabian Sea OMZ Lau hydrothermal spreading center
Gulf of Mexico (methane spill-related) DWH-related
Gulf of Mexico (methane-spill related) Arabian Sea OMZ
ALOHA OMZ Arabian Sea OMZ DWH-related
North Pacific OMZ Hydrothermal associated 99
66 99
75 84
99
45
38 44 95 99
87
93 99
99
67 99
89 70
46 35 60
70
0.02
3.4.2 Alphaproteobacteria
Figure 7. Distribution of Alphaproteobacteria along the Orca Basin halocline at order and family levels. Sequence abundance (x-axis) is plotted in percent of the total bacterial community sequence dataset.
.
The Alphaproteobacteria are almost exclusively affiliated with the family Pelagibacteraceae and show strong stratification in the Orca Basin. While
alphaproteobacterial sequences in both the water column and the suboxic zone account for at up to forty percent of the total bacterial community dataset, they decrease to between one and two percent below the brine-seawater interface (Figure 7).
3.4.3 Gammaproteobacteria
2000
2200
2400
0 10 20 30 40
Percent of bacterial community
Depth (m)
Family f__
f__Pelagibacteraceae
Most abundant alpha−Proteobacterial families
Figure 8. Distribution of Gammaproteobacteria along the Orca Basin halocline at order and family levels.
Sequence abundance (x-axis) is plotted in percent of the total bacterial community sequence dataset.
.
The Gammaproteobacteria accounted for between ten and thirty percent of the total bacterial community in the water column. Most sequences were assigned to the order Methylococcales, but could not be further classified., Sequences affiliated with the families Pisciricettsiaceae (order Thiotrichales), the family-level SUP05 lineage (order Oceanospirillales), Psuedoaltermonadaceae, Alteromonadaceae (order Alteromonadales), and Thiohalorhabdaceae (order Thiohalorhabdales) were recovered above the brine-seawater interface. Below the interface, the abundance of
Gammaproteobacteria decreased to one to three percent of the total bacterial community (Figure 8).
2000
2200
2400
0 10 20 30 40
Percent of bacterial community
Depth (m)
Family f__
f__Alteromonadaceae f__Piscirickettsiaceae f__Pseudoalteromonadaceae f__SUP05
f__Thiohalorhabdaceae
Most abundant gamma−Proteobacterial families
2000
2200
2400
0 10 20 30 40
Percent of bacterial community
Depth (m)
Order o__Alteromonadales o__Methylococcales o__Oceanospirillales o__Thiohalorhabdales o__Thiotrichales o__Vibrionales
Most abundant gamma−Proteobacterial orders
3.4.4 Deltaproteobacteria
The sequences for the Deltaproteobacteria show a strongly stratified pattern in the Orca Basin chemocline. Figure 9 shows the relative abundance of
Deltaproteobacteria with respect to the entire bacterial community. In the water column, this class makes up less than 10 percent of every sample, with the dominant family-level group being SAR324
67. In the suboxic zone, the Deltaproteobacteria increase in abundance (though relative proportions of the different families do not change). Once oxygen is completely depleted at 2200 m, the relative abundance of the deltaproteobacterial sequences decreases to three percent of the total
community dataset. Below that depth, not only do the Deltaproteobacteria begin to increase in abundance again, but the community composition changes entirely;
SAR324 is replaced by Desulfohalobiaceae and Desulfobulbaceae. A Weighted UniFrac- PCoA confirms the stratification (Figure 10) with the primary axis accounting for 71.6% of the observed variation in the Deltaproteobacteria.
Figure 9. Distribution of Deltaproteobacteria along the Orca Basin halocline at order and family levels. Sequence abundance (x-axis) is plotted in percent of the total bacterial community sequence dataset.
2000
2200
2400
0 10 20 30 40
Depth (m)
Family f__Desulfobacteraceae f__Desulfobulbaceae f__Desulfohalobiaceae f__Nitrospinaceae f__SAR324
Most abundant delta−Proteobacterial families
2000
2200
2400
0 10 20 30 40
Depth (m)
Order o__Desulfobacterales o__Desulfovibrionales o__Sva0853
Most abundant delta−Proteobacterial orders
Figure 10. PCoA analysis on the Deltaproteobacterial community showing the clear stratification observed along the Orca Basin chemocline
3.4.5 Actinobacteria
The sequences of the Phylum Actinobacteria were affiliated with the orders Acidimicrobiales and Actinomycetales and accounted for less than five percent of all water-column sequences above the brine-seawater interface. However, at the
interface, their proportion increased to 20 and 11 percent of the total community for 2190 and 2200 m, respectively (Figure 11). The sequences were not affiliated with any cultured Actinobacteria below the order level.
●●
●
●
●
●
●
●●
●
●
●
●
●
●
●
●
●●
●
●●
●
●
●●
●
●●
●
●
●
●
● 2190
2200
2210
2220
2230 2240
−0.3
−0.2
−0.1 0.0 0.1 0.2
−0.2 0.0 0.2
Axis.1 [71.6%]
Axis.2 [20.5%]
Description
●●
●●
Interface Pool Water column
Weighted UniFrac PCoA− Deltaproteobacteria
Figure 11. Distribution of Actinobacteria along the Orca Basin halocline at order level. Sequence abundance (x- axis) is plotted in percent of the total bacterial community sequence dataset.
3.4.6 MSBL2
The Mediterranean Sea Brine Lake group 2 (MSBL2) is a member of the phylum WWE1, which was recently renamed Cloacimonetes
68. Members of this class-level designation were only present in samples from the interface (as well as one at the bottom of the brine pool). Notably, members from this class made up 35% of the entire bacterial community at 2240m (brine-seawater interface) and decreased in abundance drastically after that.
2000
2200
2400
0 10 20 30 40
Abundance
Depth.m.
Order
o__Acidimicrobiales o__Actinomycetales o__WCHB1−81 NA
Figure 12. Distribution of WWE1 phylum along the Orca Basin halocline at class level. Sequence abundance (x-axis) is plotted in percent of the total bacterial community sequence dataset.
3.5 Mediterranean and Red Sea DHABs
Sequences downloaded from the GenBank database
64were only annotated with
“interface” or “brine”, so a finer-scale comparison of their origins within the halocline or brine (or affiliation with any environmental parameters, e.g. salinity, oxygen) was not possible. In order to compare Orca Basin’s interface community to the other DHAB interfaces, six different samples were used (2190m – 2240m). Class level comparisons are shown in Figure 13. (See Discussion for caveats regarding sequence comparisons between studies.)
2000
2200
2400
0 10 20 30 40
Abundance
Depth.m.
Class c__MSBL2
Overall, Orca Basin samples 2190-2230 m had a bacterial community composition distinct from other DHAB interfaces (see Discussion). However, the bacterial
community at 2240 m (the brine-seawater interface) shows greater compositional overlap by sharing a greater number of taxonomic groups with the other DHABs
(Figure 13). All DHAB interfaces seem to have unique proportions of these groups (see Discussion).
Figure 13. Comparison of the interface bacterial communities of the different DHABs.
The bacterial communities of the different brine pools appear to be much more similar to one another than the bacterial communities of the different brine-seawater interfaces. For comparisons among different brine pools, a representative sample from the Orca Basin brine pool was used, as the bacterial community is homogeneous below the brine-seawater interface (see Figure 14). Several differences and
commonalities can be identified: OD1 sequences were present in the Orca Basin brine
0.0 0.1 0.2 0.3 0.4 0.5 0.6 0.7 0.8 0.9 1.0
Comparison of interface Bacterial communities
Other
Planctomycetes Nitrospira CD12 MSBL-2 ζ-Proteobacteria ε-Proteobacteria δ-Proteobacteria γ-Proteobacteria α-Proteobacteria AB16 (SAR406) Bacteroidia KB1
OD1 (unknown class) ABY1 (OD1)