11TH INTERDISCIPLINARY WORKSHOP ON INTANGIBLES, INTELLECTUAL
CAPITAL AND EXTRA-FINANCIAL INFORMATION - EIASM
ATHENS, GREECE, SEPTEMBER 17-18, 2015
Paper code: 47484 ISSN: 2295-1679
Intellectual Capital and its Determinants in Italian Listed Companies
William Forte*, Jon Tucker**, Gaetano Matonti*, Giuseppe Nicolò*, * University of Salerno, Italy, ** University of the West of England, UK
ABSTRACT
PURPOSE: The purpose of the paper is to match the intellectual capital (IC) measurement methods and the reporting practices of a group of Italian listed firms, in order to examine potential convergence in practice. The study applies a holistic market-‐based approach, focused on the market-‐to-‐book ratio (MtB), to investigate the relationship between this ratio and potential determinants of the value of IC. Included in the determinants are intangible assets, as defined by IAS 38.
This paper contributes to the IC measurement research literature, examining the relationship between the market to book ratio and potential determinants of IC value (such as intangible assets, R&D expenses, goodwill, and so on) in order to examine whether part of the difference between market value and book value may be attributed to such determinants, recognizing that not all of the difference may be attributed to IC value. Thus, we wish to examine in an Italian context whether market value recognizes firms that invest more in IC assets by examining the relationship between the MtB ratio and factors that potentially explain the excess of market value over book value.
RESEARCH DESIGN AND METHODOLOGY: This paper employs The “market-‐capitalization approach” which measures IC value as the difference between the company’s market capitalization and its book value, assuming that a positive firm IC value occurs where the MtB ratio is greater than unity. This study examines the relationship between MtB ratios and selected determinants drawn from the literature (Morariu, 2014 ; Goebel , 2015; Cheng and Liu, 2015). Our empirical study is conducted for a panel of 148 Italian companies listed on the Milan Stock Exchange at the end of 2013, and draws upon annual reports for the financial years 2009-‐2013. For completeness we estimate two types of regression models: a logistic panel regression and a Tobit model in which the dependent variable (the market to book ratio) is regressed against independent variables including total assets and individual intangible assets components, ROA, size, age, leverage, concentrated and family ownership, auditor type, and industry type. In the logistic regression model we employ a dichotomous dependent variable taking the value 1 if the market to book ratio is above 1, and the value 0 otherwise; while in the Tobit Model we employ a continuous dependent variable for the market to book ratio.
FINDINGS: The two models produce very interesting results, showing that in the Italian context the market-‐to-‐ book ratio is a good predictor of IC value. The logistic regression analysis shows a significant positive association between the MtB ratio and total intangible assets, firm profitability (ROA) and using a Big 4 auditor; and it shows a significant negative relationship between the MtB ratio and firm age and firm size. The Tobit model (employed as a robustness check) indicates a significant negative association between the MtB ratio (continuous variable) and total intangible assets and leverage; and it shows a significant positive relationship between the MtB ratio and ROA, RD, Big 4 audit and firm size.
IMPLICATIONS AND LIMITATIONS: This study has some important implications for researchers, practitioners, and accounting standard setters. The annual reports of the sample companies show a significant overlap of intangible assets and IC value, and while structural capital and relational capital are largely visible, human capital is in general overlooked in the financial statements.
The limitations of this study are inherent in the research methodology and the market-‐to-‐book approach itself. First, it is difficult to find complete financial and governance firm data for the five-‐year period under investigation. Second, there exist some weaknesses in the MtB ratio itself as a proxy for IC value caused by factors such as the application of historic cost accounting and market value fluctuations due to other (non-‐ modelled) environmental or economic factors
KEYWORDS: Intellectual capital value measures, determinants of intellectual capital value, Italian listed companies, intangible assets.
Intellectual Capital and its Determinants in Italian Listed Companies
1. Introduction
In the past few decades, the economy has moved from an industrial to a knowledge economy (Jahanian and Salehi, 2013). As a consequence, basic factors of production now no longer comprise only natural resources, capital and labor, but also intellectual capital (IC), in the form of knowledge, brands, competitive advantage, patents and trademarks, customer relationships, human capital, research and development, and so on (Roslender, 2000; Jahanian and Salehi, 2013). Seetharaman et al. (2002) and Cronje and Moolman (2013) highlight that the major part of market values for many firms lies in such intangible assets, with relatively little value associated with conventional tangible assets (Seetharaman et al., 2002). Therefore, intellectual capital is becoming the preeminent resource for creating economic wealth in many firms, with the relative importance of tangible assets decreasing through time while the importance of intangible, knowledge-‐based assets increases (Luthy, 1998). Thus, in today’s knowledge economy, the evaluation of companies by capital markets is not only limited to tangible production elements (Kuo-‐An Tseng et al., 2015). Further, IC, commonly referred to as intangible assets, is now recognized as a strong driver of performance and market value (Wingren, 2004). Despite the growing importance attributed to intangible assets, Lal Bhasin (2012) underlines the problem that the balance sheet does not take into account the intangible assets that drive a company’s value and its growth prospects as, excepting some assets with specific legal rights (e.g. patents, trade marks, and R&D expenses) that may be recognized only when they are purchased, certain intangible assets are not identifiable (according to the definition of an asset in the international accounting standards framework). Thus, such assets may not be recognized in the balance sheet (Penman, 2009) as accounting assets, even though they are recognised by financial markets when arriving at the market value of a listed firm. Thus, according to the existing literature (Chen et. al, 2005; Edvinsson and Malone, 1997; Lev and Radhakrishnan, 2003; Lev and Zarowin, 1999; Lev 2001; Ruta, 2009; Yang and Lin, 2009), IC is considered to be the ‘hidden value’ that escapes the financial statements, and also the value that gives organizations a competitive advantage in the market place. In this regard, Chen et. al (2005) argue that the limitations on financial statements in explaining firm value underline the fact that the source of economic value is no longer the production of material goods, but the creation of intellectual capital.
Developing this point, Lal Bhasin (2012) finds that the market value of most listed firms is considerably higher than their book-‐value. The difference between the market value of a company and its book value is often attributed to the IC assets which are not recognised on the balance sheet (Brennan and Connell, 2000; Chaharbaghi and Cripps, 2006; Maditinos et al., 2011). As a consequence, Lal Bhasin argues that the market value of a firm may be obtained summing the book value and the intellectual capital value of a firm, the latter including all intellectual capital components (Al-‐Hamadeen and Suwaidan, 2014). Hence, it is argued that there exists a positive relation between market value and the value of the intangible assets recognised on the balance sheet. Kok (2007) argues that one method for determining the value of intellectual (intangible) assets of a company is to compare its market to its book value by computing the market to book ratio.
In recent years, relatively few studies employ the market to book ratio (MtB) to estimate intellectual capital value (Kok 2007, Bramhandkar et al., 2007, Goebel 2015; Kuo-‐An Tseng et al., 2015), while other studies criticize the use of the MtB ratio (e.g. Chen et al., 2005; Joshi et al., 2010; Morariu, 2014; Goebel, 2015) and use different measures instead (e.g. the Value Added Intellectual Coefficient model – VAICTM, the Long-‐Run Value-‐To-‐Book – LRVTB, etc.). The literature criticizes the MtB ratio as a means of estimating IC value due to two main weaknesses in this measure: historic cost accounting and market value fluctuations (Brennan and Connell 2000; Dumay 2012; Goebel, 2015). The counter argument is that financial markets are more accurate in their valuation of companies, and that any excess valuation of a company over its book value will be the correct valuation of the company’s intangible assets (Lal Bhasin, 2012).
However, consistent with Edvinsson and Malone (1997), Kok (2007), and Lal Bhasin (2012), we argue that IC is the ‘invisible value’ of a firm, thereby explaining a firm’s market to book value. The aim of this paper is to investigate whether there is a relationship between the market to book ratio and potential determinants of IC value, such as (visible) intangible assets and a range of other factors.
the market to book ratio (MtB) is easy to understand, quick to apply and fast to calculate by financial investors, even if the literature highlights that this method suffers from many disadvantages (Sitar and Vasic, 2004). The market capitalization methods assume that financial markets take into account IC value outside of the financial statements (e.g. Sveiby, 1997a; Goebel, 2015) by analyzing the statement of financial position and income statement (Penman, 2009). Consistent with this, the MtB ratio is used in this paper as an IC predictor under the MCA. The Market-‐to-‐Book Value method (Stewart, 1999) is more or less self-‐explanatory. The value of intellectual capital is estimated by calculating the difference between the market value of an organization and its book value, thereby making it easy to use and thus it is the preferred measure compared to other potential relationships between market and book value of a firm. Finally, according to Jurkzak (2008), Market Capitalization Methods attempts real valuation and may appear useful in many situations since they can give crude comparisons between companies, even where the market value reflects financial market fluctuations. We conduct an empirical investigation using data drawn from a panel of 148 Italian companies listed on the Milan Stock Exchange at the end of 2013. We collect the annual reports of companies for the financial years 2009 to 2013. For completeness, we estimate two regression models: a logistic regression model and a Tobit regression model in which the dependent variable is the market to book ratio and the independent variables are potential determinants of IC value as identified in the financial statements.
The rest of the paper is organised as follows. Section 2 discusses the literature which relates intellectual capital to intangible assets, and section 3 provides an overview of the main methods for measuring intellectual capital in the recent literature. The paper goes on to develop the hypotheses relating to potential determinants of MtB in section 4 and the research methodology and sample selection in section 5. Finally, the results of our main model are discussed in section 6. Section 7 introduces the Tobit model and its associated results for the purposes of robustness, and section 8 concludes.
2. A comparison of intellectual capital and intangible assets: a Literature review
Stewart (1997) notes that value creating knowledge resources are commonly referred to as intellectual capital. However, Lev et al. (2005, p.4) state that “there is no common definition of IC”. Morariu (2014) highlights that the concept of IC is multi-‐faceted and means different things to different people, as it is defined and classified in various ways by researchers consistent with their different backgrounds and the varying perspectives they bring (Stanciu, 2008; Feleaga et al., 2011; Morariu, 2011).
According to the European Union’s MERITUM project guidelines produced by academics from European universities, intellectual assets include human capital, structural capital, and relational capital (Sveiby, 1997a). Human capital, is also defined as “the knowledge, competence, skill and experience that reside with employees and that go with them on their person when they return home” (Bozzolan et al. 2006, p.98), including such items as know-‐how, education, work-‐related knowledge and competence, aspects that are not storable in firm data bases, management and information systems, or in day-‐to-‐day processes.
Structural capital is the infrastructure that supports employees to create optimum performance, including the ability of the organization to reach the market, hardware, software, databases, organizational structure, patents, trademarks, and organizational ability to support employee productivity (Bontis, 2000). Bozzolan et al. (2006) argue that structural capital is internal capital which is protected as such knowledge stays within the firm even if the employees who contribute to generating it leave the company.
Serrat (2011) argues that relational or customer capital encompasses the formal and informal external relationships, including the information flows across and knowledge partnerships, that an organization creates with its clients, audiences, and partners to co-‐create products and services, expressed in terms of width (coverage), channels (distribution), depth (penetration), and attachment (loyalty).
IAS 38 (§8) defines intangible assets (IA) as “identifiable non-‐monetary assets without physical substance” focusing on their immateriality. The existing literature (Lev et al., 2005; Yallwe and Buscemi, 2014) uses the terms IC and intangible assets interchangeably. However, the term intangibles assets itself may be somewhat unclear as it may be argued to denote intangible assets which are, or should be, recognized on the balance sheet (Skinner, 2008). On the other hand, some researchers refer to intangibles as all intangible resources (e.g. Lev, 2001; Villalonga, 2004), thus suggesting a term which is used synonymously with IC (Goebel, 2015). According to the guidelines for reporting on intangibles (MERITUM Project, 2002), the terms intangibles or intangible assets in a theoretical sense is the same as IC, while intangibles permitted to appear on the balance sheet include only those recognized as accounting assets in the (current) financial standards.
frameworks for splitting IC components into different categories, International Accounting Standards (IAS 38) provide only a short list of separate intangibles classes in order to ensure balance sheet reliability.
Considering that companies frequently summarize all of their intangibles under a single heading on the balance sheet so that financial analysts can rely only upon the disclosure in the notes to the accounts in order to determine specific intangible assets, one might argue that the visibility of structural capital is dispersed through class 5, (comprising intellectual property, such as patents and copyrights), class 6 (whose items include research projects) and class 3 (computer software). Visibility of relational capital is, however, only partial as this category is reported under brands (class 1) and licenses and franchises (class 4), with the component of “customer loyalty”, for instance, being absent. Human capital, the third fundamental category of the IC framework, is entirely ignored, at least in terms of the balance sheet (aside from occasionally mentioning training costs which are usually expensed as they are incurred).
3. A review of the literature on IC measurement: Market Capitalization Methods
The accounting and management research literature uses a variety of approaches to measure intellectual capital (e.g. Morariu, 2011; Gigante, 2013; Meihami et al., 2014; Goebel, 2015). The first group of approaches is based on a “Scorecard Approach” which aims to describe (but not always measure the value of) intellectual capital with respect to a range of non-‐financial indicators and selected financial ratios to gauge specific intangible assets, reported by means of integrated scorecards or graphs. However, the approach does not measure the financial value of IC, at least at the firm level and has been developed into the following models: the Skandia Navigator (Edvinsson and Malone 1997); the Value Chain Scoreboard (Lev, 2001); the Balance Scorecard (Kaplan and Norton 1996); and the Intangible Assets Monitor (Sveiby, 1997b).
The second group of approaches is based on an “IC Expense-‐Investment Approach” (Goebel, 2015) that qualifies as IC investments some IC-‐related expenses, as reported in the income statement, that generate an excess return on assets (ROA), alternatively defined as “knowledge capital earnings” (Lev, 1999). Pulic (1998) proposes a “Value Added Intellectual Coefficient” (VAIC) which is based on the traditional concept of value added resulting from the sum of net income plus personnel expenses. Further, Morariu (2014) develops a variant of VAIC to capture the performance of IC and its components for a sample of Romanian companies. However, this approach produces some weak results (Williams, 2001; Nazari and Herremans, 2007; Kamath, 2008; Zéghal and Maaloul, 2010; Maditinos et al., 2011), and VAIC measurement has been criticized as irrelevant for IC valuation (Stahle et al., 2011). Another way of examining income statement items as IC investment is the “Organization Capital Approach”, (Lev and Radhakrishnan, 2005; Lev et al., 2009), a measure which includes general administration and selling expenses.
The third group of approaches adopts an “Aggregate Components Approach” which aims to estimate the value of specific individual intangible assets, and then to derive the total aggregate value of IC. However, this approach is difficult to implement in practice as quantitative information on individual IC components is frequently incomplete or unreliable. Moreover, it ignores the holistic effect of the interaction of single IC elements on overall IC value (Mouritsen, 2009). As in the case of “IA Valuation” Sullivan (2000), some models attempt to investigate the contribution of individual intangible assets to a company’s market value. The “Market Valuation Model” of Pantzalis and Park (2009) provides a way to relate human capital (measured as the ratio of total firm employees to total industry employees) to market value. However, among other limitations, the model does not consider two critical components of human capital: investment in the training and education of employees. Zanda et al. (1993), in an Italian study of Human Capital valuation models measures the capitalization of costs relating to training and education, as well as extraordinary losses incurred if “trained” employees leave the firm. Other models based on direct estimates of individual intangible assets include the following: Technology Broker (Brooking, 1996); Citation-‐Weighted Patents (Bontis, 1998); Inclusive Valuation Methodology (McPherson, 1998); The Value Explorer (Andriessen and Tiessen, 2000); Total Value Creation (Anderson and McLean, 2000); and Accounting For The Future (Nash, 1998).
The final group of approaches focuses on a “Market Capitalization Approach”, which is based on the holistic effects of interactions between IC components which typically generate an overall value greater than the aggregate value of the individual estimates (Van der Meer-‐Kooistra and Zijlstra, 2001). The approach thus measures the value of a company’s intellectual capital as the difference between the company’s market capitalization and its book value. In other words, a positive IC value occurs where the market-‐to-‐book ratio is above unity (Stewart, 1997; Luthy, 1998).
In practice, the balance sheets of listed companies which are IAS/IFRS compliant cannot report IC in its entirety due to the rigid rules imposed by IAS 38 (Forte et al., 2013). In fact, Potito (2000) argues that the need for careful but significant development of generally accepted accounting principles for intangibles reporting is long overdue in the Italian context.
Instead, Penman (2009) argues that the poor visibility of intangible assets is not necessarily an obstacle to their study because IC investments, although only partially capitalized and/or invisible on the balance sheet, can generate higher earnings which can be detected in the income statement. A company’s attitude to generating earnings at a rate higher than the “cost of capital” has been defined as “Sovrareddito” in the Italian accounting literature, and IC has been identified as the “source” of this position, which is related to the existence of a “goodwill” (Giunta, 2008). However, the efficiency of the MtB ratio as an indicator of IC value has been criticized by Brennan and Connell (2000) and Dumay (2012) who argue that disparity between the market and book value of a firm may be explained by other determinants, such as the distorting effect of the historic cost convention or simply by ordinary market value fluctuations. According to Stewart (1997) and Bontis (1998), the historic cost accounting distortion may be corrected using the ratio of market value over the replacement values of assets (Tobin q method), though this only partially corrects the distortion (Goebel, 2015). To address short-‐run market fluctuations in their distorting effect on IC value measurement, Goebel suggests the use of a “Long-‐Run Value-‐to-‐Book ratio” (LRVTB).
4. Hypothesis development and the potential determinants of IC value
This paper employs market capitalization methods (hereafter MCM) to IC that estimate the total value of intangible assets in financial terms. These methods measure intellectual capital as a whole, mostly through the difference between the market and book value (or its ratio). These methods are based on Edvinsson and Malone (1997), which define the intellectual value of a firm as the difference between a firm’s market value and book value. However, conservative accounting practices ‘imprison’ firm investment in intellectual capital presented through the financial statements, resulting in the growing divergence between firm market and book values. In other words, the nature of the accounting principles may underestimate the IC value reported in the financial statements generating “invisible intangibles” (Lal Bashin, 2012). However, if financial markets are efficient, investors will place higher value on firms with greater intellectual capital (Riahi-‐Belkaoui, 2003; Firer and Williams, 2003). Thus, the difference between market and book value should be the IC value. Consistent with this, an indirect measure of IC value that is not reported in the financial statements may be a MtB ratio above 1 (i.e. market value exceeds book value). However, market values in excess of book values may not be entirely attributable to the value of IC (Goebel, 2015) as historical cost accounting and short-‐run market fluctuations might explain the difference between the two. Thus, IC is not the exclusive driver of the MtB ratio exceeding unity. This paper aims to test the proposition that there is a significant association between the MtB ratio exceeding unity and selected IC value determinants from the existing literature. According to this literature, then, we test whether intangible assets (that are more likely to incorporate intellectual capital) are potential determinants of IC value.
4.1. Intangible assets
The term ‘intangibles’ may denote intangible assets which are or should be recognized on the financial statements (Skinner, 2008) or all intangible resources (e.g. Lev, 2001; Villalonga, 2004). There is growing criticism that financial statements do not take into account those intangible assets that contribute to determining a company’s value. However, accounting standards are designed mainly for measuring and reporting tangible assets, rather than generating the “invisible” financial statements, that is the value of intangibles that is not recognized on the financial statements. Consistent with Villalonga (2004), intangible resources are one of the main drivers of performance differences across firms. Thus, potential determinants of IC value may be found in IC information from the financial statements, even though the market capitalization methods assume that at least part of a firm’s IC value depends on intangibles that are “invisible” as they are not reported in a company’s accounts (given the conservatism of the accounting principles).
components, which are not (yet) accounting assets. Given this argument, and consistent with Villalonga (2004), intangible resources are expected to have a positive impact on a firm’ competitive advantage.
According to some authors, a MtB ratio greater than unity might represent a measure of IC value that the market derives from an analysis of financial data available on the balance sheet, including recognized intangible assets. Villalonga (2004) measures IC using R&D, advertising, and intangible assets recognized in the balance sheet, and finds these three elements to be important components for determining IC value. Edvinsson (1997) and Zambon (2003) argue that intangible assets are a component of intellectual capital and thus this relation will create overlap between the two concepts. Goebel (2015) measures IC value proxied as the long-‐run value to book value (LRVTB) and proposes a positive relationship between this measure and several determinants of IC value, including intangible assets. Rather than focusing on specific intangibles, Goebel’s analysis focuses on the holistic effect of their interactions and synergies on a company's market value. While in Goebel’s study, intangible assets do not exhibit a significant positive relationship with the dependent variable, the LRVTB ratio, the holistic market capitalization approach tested as a positive relation between the MtB ratio and total intangible assets might capture not only the holistic effect, but also capture how investors can ultimately overestimate intangible assets tradable on active markets (though reported at their simple cost of acquisition in order to adhere to prudence and conservatism conventions).
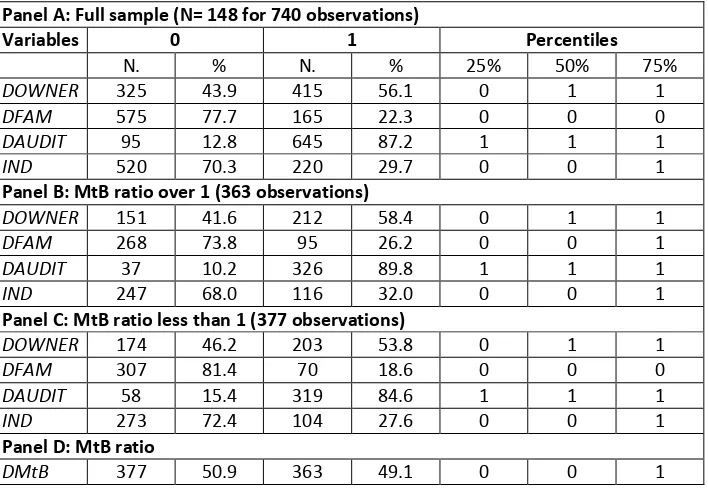
While the concept of the MtB ratio as a measure of IC value most accepted in the literature is that described above, there is an alternative interpretation of the relationship between the MtB ratio and intangible assets. One might observe a negative relationship, for example, when part of this hidden value emerges as “visible” assets, in instances such as a change in the recognition rules for accounting principles, a spontaneous change in accounting policies, or an acquisition of intangibles through a business combination (in this latter case, part of the acquisition cost could be assigned to, for example, a trademark previously generated by the acquired company). Moreover, a negative and significant relationship would support the hypothesis that investment in intangible assets significantly reduces the market to book ratio, as it reduces the gap between the market and the book value (invisible intangible assets become visible intangible assets). Italian listed firms prepare their financial statements according to IAS/IFRS. According to IAS 1, firms may show only the total figure for intangible assets. However, if we go to the Notes, the AIDA Database provides details for all items included within this broader category. Therefore, we are able to measure intangible assets in terms of four variables: (i) the total of intangible assets (TINT), which includes all intangible assets recognized on the balance sheet according to IAS/IFRS; (ii) goodwill (GOODW); (iii) the value of patents and trademarks (PAT) recognized on the balance sheet, an item that is related to the structural component of IC; and (iv) the value of research and development expenses (RD) recognized in the balance sheet. Consistent with the existing literature (Edvinsson and Malone, 1997; Kok, 2007; Lal Bhasin, 2012) and the two potential competing explanations of the relationship between the MtB ratio and the value of the intangible assets, we propose the following non-‐directional hypotheses:
H1a: IC value is associated with recognized (visible) intangible assets. H1b: IC value is associated with recognized goodwill.
H1c: IC value is associated with recognized patents and trademarks.
H1d: IC value is associated with recognized research and development expenses.
4.2. Firm size
In the intellectual capital disclosure literature, existing studies typically find a significant positive relationship between intellectual capital disclosure and firm size (Bozzalan et al., 2003; Guthrie et al., 2006; Oliveira et al., 2006) with the exception of the studies of William (2001) and Bukh et al. (2005) who find no relationship. Goebel (2015) argues that larger firms are likely to be more complex and thus subject to greater demand for information for internal and external reporting purposes. However, there is a paucity of research on the effect of company size on IC value in the IC literature. Lev (2001) notes the advantage of economies of scale in the effect of size on R&D and the creation of favorable networks. Moreover, Youndt et al. (2004) suggest that company size may exert a positive influence on IC value due to advantageous access of larger firms to resources and to market power. They find a positive though insignificant influence of company size on IC value. Reed et al. (2006) find a significant positive effect of size on IC value in both retail and commercial banks. Goebel (2015) hypothesizes a positive relationship between LRVTB and firm size, though in her study she finds a significant negative relationship, explaining that the creation of IC value is more difficult with increasing size and complex firm structures. Consistent with the existing literature, we propose the following hypothesis:
4.3. Auditor type
Auditors play an important role in the presentation of information in the financial statements. According to Wallace et al. (1994), auditor size can influence the content of the financial statements prepared by firms as (high-‐quality) auditors (e.g. Big 4 audit companies) can encourage companies to disclose more information. Moreover, an auditor may want to preserve their reputation, develop their expertise and ensure that they retain their clients. Thus, it is arguable that those companies with a Big 4 auditor disclose more intellectual capital information compared to companies with non-‐Big 4 auditors. Giner (1997) finds evidence of a relationship between auditor type and the extent of information disclosed. However, Wallace et al. (1994) and Depoers (1997) reject this hypothesis. Rahim et al. (2011) in their study of Malaysian listed firms, find that auditor type does not exhibit a significant association with intellectual capital disclosure. Finally, Whiting et al. (2011) demonstrate that companies using Big Four auditing firms give more extensive intellectual capital disclosure than those without Big Four auditors. Thus, we thus propose the following hypothesis:
H3: IC value is greater when a firm engages a Big 4 audit company to conduct its financial auditing.
4.4. Firm profitability
Reed et al. (2006) and Youndt et al. (2004) find evidence that higher IC leads to higher competitive advantage and thus corporate performance. Consistent with the existing literature, we measure profitability in terms of return on assets (ROA), and propose the following hypothesis:
H4: IC value is positively associated with firm profitability.
4.5. Corporate governance
Prior studies in corporate governance examine the association between corporate governance mechanisms and earnings management activities (e.g. Warfield et al., 1995; Klein, 2002), agency costs (e.g. Peasnell et al., 2000; Yeo et al., 2002), and company performance (e.g. Gunasekarage et al., 2007). This literature shows that good governance practices through ownership structure promote corporate accountability and strengthen IC performance. The effect of ownership concentration on IC value is developed conceptually by Keenan and Aggestam (2001), though with some uncertainty regarding the precise nature of the relation, and is subsequently tested by Goebel (2015). We might argue that high ownership concentration along with stable block holdings can lead to a conservative approach with less emphasis on innovative strategies. Conversely, low concentration may weaken the implementation of appropriate IC investment strategies. Goebel does not specify an expected direction in her study, though finds no evidence of ownership influencing IC value. Thus, we propose the following open hypothesis:
H5a: IC value is associated with ownership concentration.
Moreover, family controlled companies may perform better than non-‐family controlled companies because of lower agency costs (e.g. Maury, 2006; Villalonga and Amit, 2006). The literature (e.g. Ali et al., 2007) also highlights that family firms are more likely to monitor firm management, have good knowledge of their business activities, and tend to have a longer investment view than non-‐family companies. Thus, it is argued that family ownership is related to family performance (the alignment effect in agency theory). On the other hand, the literature also suggests that the controlling owner in family firms may extract wealth for private benefits (e.g. Claessens et al., 2002; Villalonga and Amit, 2006), thus focusing on the ‘entrenchment effect’. In particular, when family ownership increases and the owners gain the full control, Norman and Mohamat (2011) argue that there is a tendency for the owner to generate their own benefits at the expense of the minority shareholders. They find a significant negative association between family ownership and IC performance (VAICTM) for Malaysian listed firms. This finding suggests that highly concentrated family ownership has a negative impact on IC value because of the opportunistic behavior of families in pursuing their goals at the expense of the minority shareholders. Thus, due to the competing alignment or entrenchment effects (Wang, 2006) to explain the influence of family ownership on IC value, we propose the following open hypothesis:
H5b: IC value is associated with family ownership.
least 50% of the voting rights, and 0 otherwise. The variable DFAM assumes a value of 1 if at least 50% of the voting rights or outstanding shares are held by a family block holder, and 0 otherwise.
4.6. Control variables
We introduce a range of control variables in our models. Firm age (AGE) recognizes the fact that companies develop IC value over time in an cumulative manner (Nahapiet and Ghoshal, 1998), though evidence on the relationship between firm age and IC value is mixed. Reed et al. (2006) find that firm age has a significant positive influence on IC value in retail banks, but not in commercial banks. Goebel (2015) finds a significant negative relation between firm age and IC value. However, Youndt et al. (2004) find no influence of firm age on IC value. Thus, on balance we expect a positive relation between IC value and firm age.
Lenders to the firm may are often influential stakeholders. As the debt to total assets ratio increases, lenders gain greater influence on the firm’s management, driving them to accelerate investment in IC (Keenan and Aggestam, 2001; Goebel, 2015). This may be particularly true for insider governance systems, prevalent in countries such as Germany and Japan, as discussed by Dignam and Galanis (2009) and Goebel (2015). While lenders may not have such strong influence in Italian companies, the influence is still potentially important. In Italy, it is mainly small and medium-‐sized firms that are affected by the influence of lenders, and in particular banks. Therefore, we expect a positive relation between leverage (LEV) and IC value.
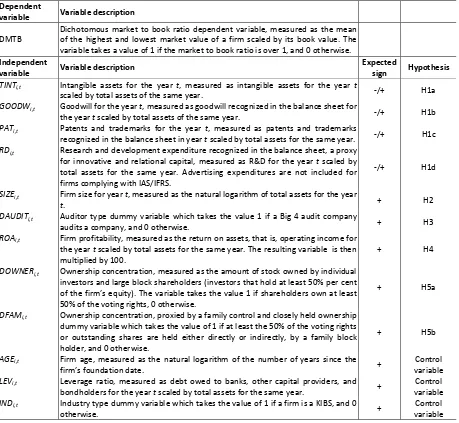
Finally, we control for the influence of industry sector membership (IND) on IC value. Intellectual capital and intangible assets may be more important in those industry sectors characterized by competitive advantage generated by protected knowledge and significant capital investment in R&D. Firms operating in knowledge intensive business services (KIBS) sectors such as media, pharmaceuticals, or other technological sectors are more capital-‐intensive compared to those in traditional industries (TI). The relationship between IC and intangible assets has been investigated for pharmaceutical companies by Boekestein (2006) who shows that the majority of companies specify intangible assets and that a considerable overlap occurs with intellectual capital. Intangible assets may contribute substantially to a company’s assets. However, a clear relation between intangible assets and company performance could not be established. Goebel (2015) finds no relation between knowledge-‐based industry sector membership and IC value. The variable IND takes a value of 1 if a firm belongs to a KIBS sector, and 0 otherwise. Consistent with the existing literature, we do not specify the expected direction for this relation.
5. Research methodology and sample selection
5.1. Sample selection
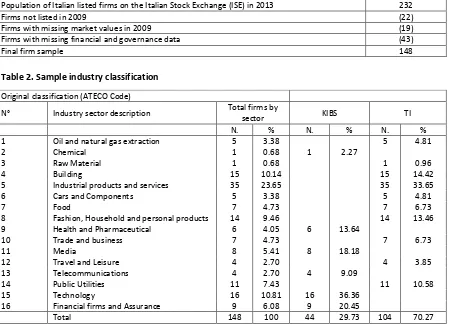
Our study sample includes all Italian companies listed on the Electronic Market of the Milan Stock Exchange for which we collect individual annual reports for the financial years 2009 to 2013. We start from 2009 in order to avoid the effect of financial crisis on firm market value. Accounting, financial market and corporate governance data are collected from the Bureau van Dijk AIDA Database. We collect 232 companies, representing all Italian listed firms on the Italian Stock Exchange (ISE) in 2009. The latest data available at the time of collection are for the year 2013. From this population we remove those firms that were delisted from the database due to mergers, acquisitions, bankruptcy, missing data, or firms conducting an IPO during the period. Thus, from the population we remove 22 firms listed in 2010 or later. We also remove 19 firms for the year 2009 across our balanced sample where neither the AIDA Database nor the Italian Stock Exchange website provides market values. Finally, there are missing data issues with regard to key financial and/or corporate governance data for 43 further firms which we thus remove from our sample. We arrive at a final balanced panel of 148 Italian listed firms for the period 2009 to 2013, giving a total of 740 firm-‐year observations, as shown in Table 1. Restricting our sample to those firms which survived for five consecutive years ensures that our model findings are not driven by changes in sample composition over time.
[Insert Table 1 here]
[Insert Table 2 here]
5.2. Logistic regression model
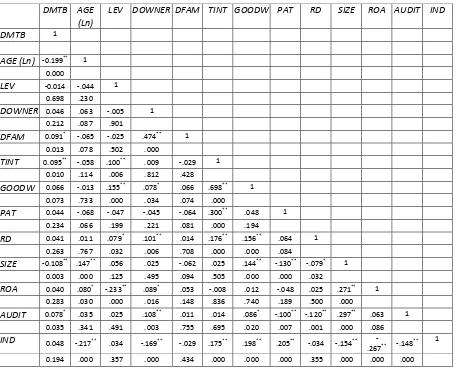
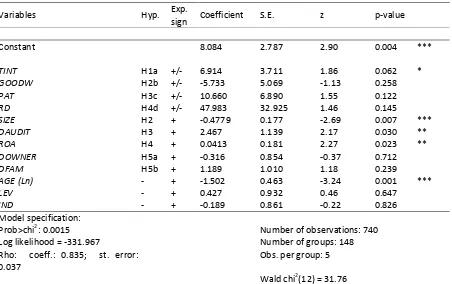
We estimate the logistic regression model given in Equation 1, where the dependent variable DMTB is defined as a dichotomous variable which equals 1 if the market to book ratio exceeds unity (where market value exceeds book value), and 0 if it is less than 1. The market to book ratio measure implicitly assumes that a company’s worth (the sum of tangible and intangible assets) is gauged by its market value, that is, the market price per share of common stock multiplied by the number of shares outstanding. The difference between the market value and the book value of the firm provides an approximate gauge of the intellectual capital that is part of total firm worth (but does not appear on the balance sheet). In this model we use a dummy variable in order to reduce the high variability in the MtB ratio. Panel D of Table 5 shows that 50.9% of firms have a MtB ratio below 1 for one or more years, while 49.1% have a MtB ratio above 1. In order to overcome this limitation in the dependent variable, we also run a robustness test as explained in section 5.3.
𝑃𝑟𝑜𝑏 𝐷𝑀𝑇𝐵=1
=𝛼!,!+𝛽!𝑇𝐼𝑁𝑇!,!+𝛽!𝐺𝑂𝑂𝐷𝑊!,!+𝛽!𝑃𝐴𝑇!,!+𝛽!𝑅𝐷!,!+𝛽!𝑆𝐼𝑍𝐸!,!+𝛽!𝐷𝐴𝑈𝐷𝐼𝑇!,!
+𝛽!𝑅𝑂𝐴!,!+𝛽!𝐷𝑂𝑊𝑁𝐸𝑅!,!+𝛽!𝐷𝐹𝐴𝑀!,!+𝛽!"𝐴𝐺𝐸!,!+𝛽!!𝐿𝐸𝑉!,!+𝛽!"𝐼𝑁𝐷!,!+𝜀!,!
(1) Where: 𝐷𝑀𝑇𝐵 = dichotomous market to book ratio dependent variable; 𝑇𝐼𝑁𝑇 = total intangible assets; 𝐺𝑂𝑂𝐷𝑊 = goodwill recognized in the balance sheet; 𝑃𝐴𝑇 = patent and trademark expenditure recognized on the balance sheet; 𝑅𝐷 = research and development expenditures (recognized and complying with IAS/IFRS); 𝑆𝐼𝑍𝐸 = natural logarithm of total assets; 𝐷𝐴𝑈𝐷𝐼𝑇 = auditor type dummy; 𝑅𝑂𝐴 = return on assets ratio;
𝐷𝑂𝑊𝑁𝐸𝑅 = ownership concentration dummy; 𝐷𝐹𝐴𝑀 = family ownership concentration dummy; 𝐴𝐺𝐸 =
natural logarithm of firm age; 𝐿𝐸𝑉 = leverage ratio; 𝐼𝑁𝐷 = industry type dummy; and ε = model error term.
Table 3 provides definitions for the model independent variables, a summary of the coefficient signs expected from theory, and our hypotheses.
[Insert Table 3 here]
5.3. Tobit model
In our second model, we attempt to model the market to book ratio as a continuous rather than a dichotomous variable using a Tobit regression as given in Equation 2 with the dependent (MTB) and the scale-‐ related independent variables (TINT, GOODW, PAT, RD, SIZE and AGE) all Winsorized at the 99% level. The Winsorization reduces the effect of any outliers on the model results. In this model the dependent variable is the MtB ratio.
𝑀𝑇𝐵!,!=𝛼!,!+𝛽!𝑇𝐼𝑁𝑇!,!+𝛽!𝐺𝑂𝑂𝐷𝑊!,!+𝛽!𝑃𝐴𝑇!,!+𝛽!𝑅𝐷!,!+𝛽!𝑆𝐼𝑍𝐸!,!+𝛽!𝐷𝐴𝑈𝐷𝐼𝑇!,!+𝛽!𝑅𝑂𝐴!,!
+ 𝛽!𝐷𝑂𝑊𝑁𝐸𝑅!,!+𝛽!𝐷𝐹𝐴𝑀!,!+ 𝛽!"𝐴𝐺𝐸!,!+ 𝛽!!𝐿𝐸𝑉!,!+𝛽!"𝐼𝑁𝐷!,!+ 𝜀!,!
(2) Where: 𝑀𝑇𝐵 = market to book ratio; 𝑇𝐼𝑁𝑇 = total intangible assets; 𝐺𝑂𝑂𝐷𝑊 = goodwill recognized in the balance sheet; 𝑃𝐴𝑇 = patent and trade mark expenditure recognized on the balance sheet; 𝑅𝐷 = research and development expenditures (recognized and complying with IAS/IFRS); 𝑆𝐼𝑍𝐸 = natural logarithm of total assets; 𝐷𝐴𝑈𝐷𝐼𝑇 = auditor type dummy variable; 𝑅𝑂𝐴 = return on assets ratio variable; 𝐷𝑂𝑊𝑁𝐸𝑅 = ownership concentration dummy; 𝐷𝐹𝐴𝑀 = family ownership concentration dummy; 𝐴𝐺𝐸 = natural logarithm of firm age; 𝐿𝐸𝑉 = leverage ratio; 𝐼𝑁𝐷 = industry type dummy; and 𝜀 = model error term.
6. Results
6.1. Model variable descriptive statistics
remaining years, for example. Panel B includes 363 firms while Panel C includes 377 firms. This finding suggests that across the five years of our sample, firms observed movement in market to book value.
[Insert Tables 4 and 5 here]
In this paper we follow a (holistic) market-‐based approach that assumes that financial markets incorporate IC value beyond the financial statements (Sveiby, 1997; Goebel, 2015). Thus, we commence our analysis by examining the factors that may explain the surplus of market value over book value (when we use a dummy dependent variable). Panel A in both Tables 4 and 5 shows descriptive statistics for the overall sample. However, in order to compare firms with a MtB ratio over 1 and those with a MtB ratio less than 1, we comment only on panels B and C. We follow the order of the variables given in the hypothesis development section when discussing the characteristics of those variables.
Table 4 shows that the natural logarithm of firm age (AGE Ln) for the firms in Panel B with MtB exceeding 1 is, on average, 3.153 (23.4 years old), while the firm age for those firms with a MtB ratio less than 1 (Panel C) is, on average, 3.475 (32.3 years old). This finding suggests that, on average, younger firms have a higher market to book ratio than older firms. Panel C also shows that firms with a MtB ratio less than 1 are more highly leveraged than firms with a MtB ratio over 1, with leverage ratios of 26.10% and 25.4%, respectively. Table 5 shows that 58.4% of the firms in Panel B (MtB over 1) have close ownership concentration (DOWNER), while only 53.8% of the firms in Panel C have close ownership. Thus, higher ownership concentration increases the probability of firms having a market to book ratio over 1. The Table also shows that 26.2% of Panel B firms have high family ownership concentration (DFAM), that is, control by a family of at least 50% of the voting rights in the firm. In comparison, only 18.6% of the firms in Panel C have high family ownership concentration. This finding suggests that the higher is family ownership concentration, the higher the probability of enjoying a market to book ratio over 1.
Table 4 shows that firms in Panel B (MtB over 1) have a total intangible assets ratio (total intangible assets scaled by total assets, TINT) which is higher than the ratio for firms in Panel C (MtB less than 1), with ratios of 8.1% and 5.7%, respectively. These findings suggest that firms with higher total intangible assets are more likely to enjoy a market to book ratio exceeding 1. Further, the AIDA Database provides details of the components of total intangible assets which existing studies (e.g. Goebel, 2015) relate to the IC value. Table 4 shows that firms in Panel B have a goodwill ratio (GOODW), a patents and trademarks expenses rate (PAT), and a research and development expenses rate (RD), recognized according to IAS/IFRS, of 3.7%, 0.8%, and 0.3%, respectively, compared to 2.6%, 0.5%, and 0.2% for firms in panel C. These findings suggest that the main component of total intangible assets is goodwill. Thus, consistent with the TINT variable, higher goodwill, patents and trademarks, and research and development expenses tend to increase the probability of a firm enjoying a market to book ratio over 1.
Surprisingly, Table 4 shows that firms with MtB over 1 are marginally smaller in size (SIZE) than firms with MtB less than 1, with a natural logarithm of total assets of 12.562 and 12.927, respectively. These findings suggest that financial markets perceive size as a firm complexity issue. As concerns firm profitability, the Table shows that on average firms in Panel B (MtB over 1) have a profitability ratio, measured by ROA (ROA), which is higher than firms in panel C (MtB less than 1), with an ROA of -‐0.7% and -‐1.6%, respectively. However, while it is noted that in each case ROA is negative, a higher profitability still increases the probability of firm MtB exceeding 1.
Table 5 shows that a Big 4 audit company (DAUDIT) audits 89.8% of the firms in panel B (MtB exceeding 1), while 84.6% of firms in panel C (MtB less than 1) are audited by such an auditor. Thus, engaging a Big 4 audit company increases the probability of firm MtB exceeding 1. The Table also shows that membership of KIBS industries on average increases the probability of a firm enjoying a market to book ratio over 1. The frequency of firms belonging to KIBS industries is 32% for firms in panel B and 27.6% for firms in panel C.