Numerical optimisation of thermal comfort improvement for indoor
environment with occupants and furniture
Kana Horikiri1, Yufeng Yao2*, Jun Yao3
1
Faculty of Science, Engineering and Computing, Kingston University, London SW15 3DW, United Kingdom
2
Faculty of Environment and Technology, University of the West of England, Bristol BS16 1QY, United Kingdom
3
School of Engineering, University of Lincoln, Brayford Pool, Lincoln LN6 7TS, United Kingdom
*Corresponding author. Tel: +44 117 3287084 E-mail address: Yufeng.Yao@uwe.ac.uk
Abstract
Indoor thermal environment of a 3-D ventilated room was studied by computational fluid dynamics to understand correlations between heat generation, ventilation velocity and
thermal sensation indices. The existence of a thermal occupant was found to produce thermal plume approx stronger in magnitude than that from an unoccupied room. With second thermal occupant, there has further temperature increase of maximum , equivalent to an increase of PPD value by , for which occupants would normally feel uncomfortable. Thus, an increased flow ventilation rate ( ) would be required, in order to keep the same thermal comfort level of the room.
1
Introduction
In addition to aforementioned factors, the problem of indoor thermal comfort is also sensitive to other physical parameters and their variations, in case of room environment with and without occupant. For example, the surface temperature of human body and room walls can cause the increase of radiation temperature [26]. The orientation and surface treatment of window glazing [27] and the occupant behaviour [28] also have important effects on energy performance and thermal balance of thermal comfort level. It was found that careful monitor and control of fluid inlet temperature of a heating radiator panel can maximise the indoor thermal comfort as well as minimise the energy consumption [24]. The PMV calculation, after considering all relevant environmental factors, has exhibited decreased levels of sensitivity, from very significant to air mean radiant temperature, down to less significant to air temperature and velocity and finally to insignificant to air humidity [29], respectively. Also the changes in outdoor climate and season will influence the indoor temperature via ventilation system and wall heat induction, thus affecting indoor thermal comfort [30].
as GPU, it is now possible to carry out vast number of parametric studies as precursor numerical exercises and thus to integrate numerical modelling work with practical engineering design and analysis process for cost saving, durability and reduced time-scale from product design to market, for which it is almost impossible with physical experiment tests and measurements, due to extremely long preparation and construction time, and high operation and labour costs.
Building on previous success of validation and verification exercises of several benchmark test cases [36] and a ventilated model with a heat source [37] using a commercial CFD code ANSYS Fluent, present study further investigates the impact of indoor environment condition on thermal comfort level variation in a 3-D ventilated, furnished and occupied room. Detailed studies of flow and heat transfer characteristics and thermal comfort analysis will be carried out by increasing the complexity of flow and geometry features, such as different layout of furniture and the number of heat-generating sources (e.g. heat source, occupant(s) and TV), etc. For the thermal comfort optimisation, the study will focus on heat generation of heat source and ventilation rate on thermal sensation of occupants in the specified furniture layouts. The employed mathematical model and numerical scheme will be carefully tested and validated with results obtained to be compared with other already validated numerical predictions [12, 23].
2
Numerical Methods
2.1 Airflow and heat transfer
are adopted together with the two-equation renormalized group RNG k-ε turbulence model, due to its capability of accurate prediction of turbulent indoor airflows at low-Reynolds number with and without flow swirl, as previous studies have shown good model performances in terms of accuracy, numerical stability and short computing time [36, 39]. In the energy equation, radiation heat generation from a heating source is also included through a Discrete Ordinates (DO) model already implemented in ANSYS Fluent software and it is applied with various angular discretisation and sub-iteration parameters to control solid angles in discretising each octant of the angular space and volume overhang on each surface respectively, so that radiative conditions can be applied to each individual faces and fluid elements within the computational domain. All the equations can be found in a recent publication [37].
An iterative solution method, SIMPLE algorithm [40], is employed to solve the nonlinearity of the momentum equation, the velocity-pressure coupling and the coupling between the flow momentum and the energy equations. For pressure Poisson equation, the solution applies weighted body-force under the assumption that the gradient of the difference between the pressure and body forces remains constant, especially in buoyancy calculations. Other equations such as momentum, energy and radiation are solved using the second-order numerical scheme. Double precisions are always defined to have better numerical accuracy and the residual target is set as to achieve a high level of convergence.
The problems are solved by finite volume numerical method on a uniform structured grid. A grid independent study is conducted using three successive grid resolutions of ,
and gird points, respectively. Due to higher Richardson number,
numerical instabilities in terms of oscillating flow patterns during the convergence [41]. To mimic this effect, the results are averaged using three successive datasets taken from a complete oscillation cycle with limited temperature and velocity variations (i.e. within and , respectively) at the monitoring points prescribed within the computational domain. The final ‘mean’ results are then compared with either experimental measurements or other available numerical data of corresponding scenarios for further analysis and assessment.
2.2 Indoor thermal comfort
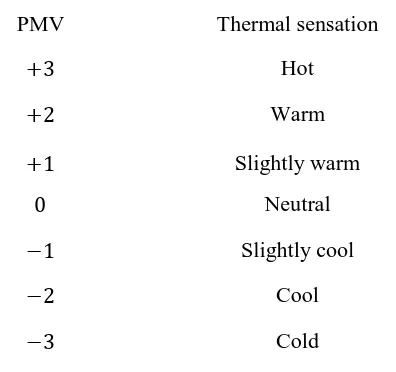
The thermal comfort indices are evaluated by using Fanger’s comfort equations [23], i.e. predicted mean vote and predicted percentage of dissatisfied , representing the thermal balance of a whole human body. The parameter PMV is an index representing the mean value of the voters of a large group of people in the same environment on a seven-point thermal sensation scale, i.e. , see Table 1. The parameter PPD is also an index representing the percentage of thermally dissatisfied persons among a large group of people. For thermal comfort requirement, the recommended PMV and PPD values are in a range of and , respectively. Following the work of Fanger [23], PMV and PPD values can be calculated by equations below. Note that more information and details can be found in reference papers [13, 14].
(1)
, (2)
for
, (3)
for
, (4)
where is the metabolic rate , is the external work (close to zero for most activities), is the partial water vapour pressure , is air temperature , is the ratio of body’s surface area (while clothed) over the surface area (while naked), is the
surface temperature of clothing , is the mean radiant temperature , is the convective heat transfer coefficient , is the relative air velocity (with reference to a human body) and is the thermal resistance of clothing .
The PPD index can be evaluated by the formula below,
, (5)
wearing the winter indoor clothes with of air humidity. Table 1 gives the relation between the PMV indices and the thermal sensation conditions.
Table 1
Relationship between PMV and thermal sensation
PMV Thermal sensation
Hot
Warm
Slightly warm
Neutral
Slightly cool
Cool
Cold
2.3 Physical parameters
The comfort temperature is another variable to describe the occupant’s feeling of the thermal climate within a room environment, which considers the balance of radiation and convection heat transfer modes, and it can be used for results comparison with available data from other published data sources (see, e.g. [12, 23]).
, (6)
where is comfort temperature , is radiation temperature [42],
is air temperature and is air velocity magnitude . Radiation temperature is defined as
where is Stefan-Boltzmann constant , is radiation intensity ( ), and is solid angle .
To determine air velocity at a ventilation opening slot location based on either given ventilation rate or air supply rate , following equations can be used.
, (8)
. (9)
3
Physical Problem
3.1 Configuration of model room, furniture and occupants
The present study considers a 3-D model room in dimensions of
previously studied by Olesen et al. [38], Myhren and Holmberg [12] and Horikiri
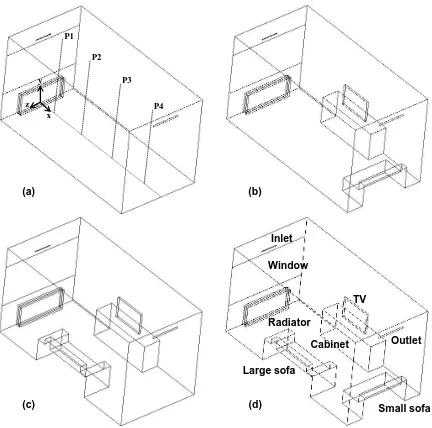
Analysis of the impact of occupied room on indoor thermal comfort is carried out by three different layouts/scenarios with furniture and/or occupants (see Figure 1b-1d), compared with the original empty model room layout/scenario . The furniture considers a cabinet (or a TV stand) with a TV at a fixed position, located at the middle of one side-wall opposite to the sofa, and two different types of sofa. A small sofa that has no armrest is located at the back wall, facing to the window wall (denoted as the layout ) while a large sofa with armrest is located at the middle of one side-wall (denoted as the layout ). In the layout , two sofas are both included. All sofas and cabinet/TV-stand are attached to the walls, assuming that the gap between the walls and the non-heat generating furniture is so small that the local heat transfer and fluid pattern inside the gap space do not have significant influences on the domain of interest, i.e. the central space of the model room.
For further studies of heat generation effects, a box-shaped human being is introduced at the center of each sofa. An occupant with a small-shoulder ( ) is seated on the small sofa , facing to the window wall, while another occupant with a large-shoulder ( ) is seated on the large sofa , facing to the cabinet/TV-stand on the opposite side-wall. The bodies are seated along the sofa without gap/space and therefore the total height from the feet to the head is
(i.e. as the height of the head, as the upper-body length from the shoulder
Figure 1: Schematic views of four 3-D configurations of furniture with monitoring four lines
: (a) layout , (b) layout , (c) layout , (d) layout .
(a) (b)
(c) (d)
Radiator Window
Inlet
Outlet TV
Cabinet
Small sofa Large sofa
y
x z
P1
P2
P3
Figure 2: Detail of seated occupant’s segments (a) side-view, and occupied zone with eight measuring points (b) top-view.
Table 2
Specifications of furniture and human body
Size ( ) Position in room
Sofa Outline: ,
Seat: Mid-position along the back-wall
Sofa
Outline: , Arms: , Seat:
Mid-position along the side-wall
Cabinet Mid-position along opposite side-wall of the sofa
TV Centre/top of cabinet
Human
Body: , Head: ,
Thigh & leg:
Seating at centre of sofa /no gap to sofa surface
Human
Body: , Head: ,
Thigh & leg:
Seating at centre of sofa /no gap to sofa surface
3.2 Boundary conditions
Table 3 lists boundary conditions for the baseline case , same as those previously defined and used in a published paper [12] and also for other three cases in the present study (i.e.
0⁰ (Front)
180⁰ (Back)
Head Body Sofa Thigh Leg Occupied zone (a) (b) Sofa-seat Sofa-back Floor 45⁰ 90⁰ (Right-side) 135⁰ 225⁰ 270⁰ (Left-side) 315⁰ Wall
r = 0.5 m
Front Back
Sofa-back Sofa-seat
[image:12.595.74.519.415.646.2]layouts and ). The plastic-made TV has a thermal conductivity value of and it generates a constant heat of for “on-mode” and non-heat generation for “off-mode”, respectively. A -height human being in a seated condition has a mean
surface temperature of a human body of in a relax mode, equivalent to constantly releasing heat from total body volume of [43-45]. The radiator panels also have a constant heat generation to maintain the near constant volume temperature of the panel around in each case.
Present study uses the same thermo-physical properties of the fluid (air) as that of previous investigation [12]. Due to very low speed of incoming cold airflow, incompressible flow assumption is used together with a Prandtl number . Based on physical condition of the heat source considered, i.e. , and , where is Grashof number, is Reynolds number, the heat transfer due to natural convection mode will play a major role in the heat transfer process, compared to that of forced convection mode. The corresponding Rayleigh number ( is . The initial indoor temperature is set to be
based on an ambient room condition.
Table 3
Boundary conditions
Inlet Uniform & constant, and
Outlet Naturally outflow
Window Uniform & constant temperature,
Walls A wall exposed to external environment, Other walls: Adiabatic -value
Radiator Constant heat generation to keep
TV Constant heat generation for “on-mode”
Humans Constant body temperature
Sofa Non-heat generating furniture, Adiabatic
3.3 Monitoring points
In order to compare results from present study with those available thermal comfort data obtained by previous experimental and numerical studies [12, 38], several monitoring points/lines are inserted at four streamwise locations of , respectively in the mid-plane throughout the domain height, with a distance of , ,
and from the coordinate origin, see Figure 1a. During data analysis such as
PMV and PPD values of thermal comfort conditions for occupant in a relaxing mode on the sofas, the area surrounding the seated occupant is considered using a cylindrical shape with a
radius of circle from the centre of seated human beings, from the floor to the
level (i.e. the top of the head), so-called “occupied zone”, see Figure 2. The measurements are taken at eight points across the occupant’s body (see Figure 2b) at four vertical positions from the floor to the ceiling, i.e. (ankle level), (knee level), (shoulder level) and (head level), respectively.
3.4 Description of case studies
Table 4
Case study with heat generation source
Radiator Occupant(s) TV
Case 1 (radiator study)
Case 2 (thermal human study)
Case 3 (heat-generating TV study)
4
Validation
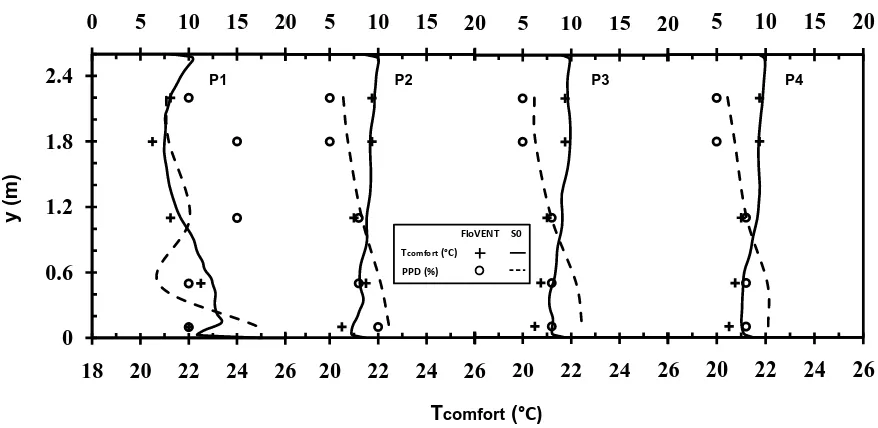
Validation study of heat transfer and thermal comfort in a 3-D empty model room has been carried out by performing steady RANS computations using ANSYS Fluent software for indoor thermal comfort temperature prediction, and thermal index calculations using an in-house FORTRAN code based on the Fanger’s PPD index evaluation [14], respectively. A configuration previously studied by other researchers [12, 23] has been used to compare comfort temperature predictions, whereas the accuracy of predicted PPD magnitude has been analysed for different sizes of single-panel radiator and ventilation system in the computational domain. The obtained results are compared with available numerical predictions from another commercially available numerical code FloVENT on a streamwise mid-plane and at four monitoring lines [12, 23].
that of FloVENT, the present comfort temperature profiles have shown a slight over-prediction throughout the domain height, especially in the region below in height. The PPD calculations shown in Figure 3 indicate a similar trend as FloVENT [23] that thermal comfort level increases whilst towards the ceiling. Some over-predictions in present results at locations may be due to larger amount of heat transfer from the double-panel heat source, causing higher air temperature, radiation temperature and air velocity. With the same reasons, the calculated average PPD value at each location is approximately
higher than that of experimental data [38]. The difference in the PPD distributions
[image:16.595.79.518.454.668.2]between two sets of prediction data is also recognisable at the location where there exists a strong thermal flow mixing between a cold jet stream from the inlet slot and a warm air stream from the heat source beneath it. More results validation against available test data [12, 38, 39] can be found in a recent publication by present authors [37], using the same mathematical model and numerical scheme.
Figure 3: Comparison of comfort temperature and PPD profiles at four monitoring locations
in an empty room between present study and published FloVENT results [12, 23].
0 5 10 15 20
0 0.6 1.2 1.8 2.4
18 20 22 24 26
Y
0 5 10 15 20
0 0.6 1.2 1.8 2.4
18 20 22 24 26
Y
0 5 10 15 20
0 0.6 1.2 1.8 2.4
18 20 22 24 26
Y
0 5 10 15 20
0 0.6 1.2 1.8 2.4
18 20 22 24 26
Y
Tcomfort( C)
y
(m)
PPD (%)
26 26 26
20 20
P1 P2 P3 P4
FloVENT S0
Tcomfort( C)
5
Results and Discussion
After results validation of a 3-D empty model room against other published data, simulations continue with three proposed case studies described in Table 4. The computational results of each study are first presented in terms of comfort temperature, followed by predicted mean vote (PMV) and predicted percentage of dissatisfied (PPD) values. A comparison of present results with other numerical data [12] and previous already validated numerical results in an unfurnished model room [37] is also presented and discussed.
5.1 Case 1: Effect of furniture arrangement (without heat generation)
Figure 4 gives three-dimensional velocity magnitude distributions for an iso-surface of
, coloured with the -velocity contours in a range of to
Figure 4: Velocity magnitude iso-surface of coloured with -velocity contours for four room layouts: (a) , (b) , (c) , (d) .
Figure 5 shows comfort temperature distributions at four monitoring locations throughtout the domain height for three room layouts with sofa , compared with other numerical results of FloVENT [12] and Fluent for an empty room layout of ( ) [37]. It is clear that the predicted comfort temperature of furnished room layouts is generally in good agreement with that of an unfurnished room at three downstream locations – . Note that temperature at the location where the maximum difference of comfort temperature is about at a height of , is highly affected by the cold jet stream from the inlet and the additional re-circulations mentioned beforehand would cause some rapid changes in the flow pattern and other features such as velocity, hence leading to the change of the comfort
(a)
(d) (c)
temperature. There is little difference among four layouts in terms of the comfort temperature magnitude at other three monitoring locations , indicating that the fluid is less influenced by the existence of furniture in a streamwise plane at the centre . The predicted average air temperature in the fluid domain is around , calculated using a
formula , which is consistent among all cases studied.
Figure 5: Comparison of comfort temperature profile at four monitoring locations
from four room layouts with that of FloVENT for an empty model room layout
[12].
Comparing to the heat transfer in the domain with non-heat generation furniture, the flow pattern is more influenced by the introduction of furniture and its location, in particular the development of flow re-circulations around the furniture. While the velocity magnitude is generally consistent throughout all the cases, it will be slightly higher in the vicinity of the furniture edges (see, e.g. Figure 4). It seems that the buoyancy strength is perhaps not
0 0.6 1.2 1.8 2.4
18 20 22 24
Y 0 0.6 1.2 1.8 2.4
18 20 22 24
Y 0 0.6 1.2 1.8 2.4
18 20 22 24
Y 0 0.6 1.2 1.8 2.4
18 20 22 24
Y 24 24 24 Y (m)
Tcomfort ( C)
0 0.2 0.4 0.6 0.8 1
0.48 0.52 0.56
Y θ P14 Flovent S0 S1 S2 S3
[image:19.595.80.518.252.473.2]significantly affected by the presence of the furniture, indicating that the room temperature would be sustained at a similar level as that of an empty room layout .
5.2 Case 2: Effect of heat transfer from occupant
Figure 6 shows predicted air temperature contours at a streamwise mid-plane ( ) for three different layouts with sofa. It can be seen that air temperature increases with the height and the formation of thermal plume from human bodies can be clearly observed. The trends of temperature elevation and thermal plume from the human body were observed previously in various studies [46-48]. While increasing the number of occupant from one to two (i.e. layout ), there is air temperature increase along the vertical height, causing a large size of thermal plume occurred in the fluid domain which is found more stable in the upper part of the flow domain. The air temperature gradient magnitudes at two vertical levels of
and from the floor are predicted to be , and , respectively for
three layouts , and , for which they satisfy the ISO thermal comfort standard [14]. The air temperature surrounding the human being changes by maximum between two layouts and . These results confirm that the presence of thermal occupant does have influences on indoor environment temperature, with increased volume-averaged temperature of for three occupied layouts , compared to that of unoccupied room, i.e. case 1. The corresponding change in the comfort temperature increase is measured about
. Among all three different room configurations, the averaged comfort
Figure 6: Air temperature distributions at a mid-streamwise plane ( ) for three layouts with sofa: (a) , (b) , (c) .
Human body > 27 C
25 C 26 C
24 C 24 C
25 C
23 C > 17 C
20 C 24 C
24 C
24 C
23 C
22 C > 17 C
20 C
23 C
22 C
Human body > 27 C 25 C
24 C
23 C
22 C 23 C
> 17 C
20 C (a)
(b)
Figure 7 shows the distributions of velocity magnitude contours at a vertical plane throughout the mid-width of occupant’s head, i.e. for human being in Figure 7a, 7c and
for human being in Figure 7b, 7d, illustrating the formation and the
Figure 7: Velocity magnitude contours at the mid-width of occupant body for three layouts with sofa: (a) , (b) , (c) , (d)
[image:23.595.72.514.68.609.2]Figure 8 shows the PPD polar map around an occupant at four vertical locations
and for each sofa layout, based on the CFD predicted air velocity,
air temperature and radiation temperature at eight measuring points around the -circle occupied zone (see Fig 2b). The PPD predictions are presented in red lines for the occupant and in blue lines for the occupant , and in solid line for two layouts and and in dashed line for third layout , respectively. It is clear that the PPD distributions around an occupant in two sofa layouts and are resemblance throughout the domain heights, apart from a low position of . The PPD magnitudes are also generally lower (i.e. below ) for the two layouts and , compared to that of the third layout . Note that small value of is highly recommended as desirable environment for occupied spaces in terms of thermal comfort requirements [14]. There are two peaks at positions and at level (i.e. beside the hip) and one peak at position
at (i.e. back of the neck) observed and their existences could be due to those
unoccupied room [12], it was found that the predicted PPD values in present study increase with the vertical height of the domain, while Myhren’s results showed the decrease trend with the height. This discrepancy may be contributed to the existence of occupants in the domain, creating different flow patterns and thermal plumes around them especially along the vertical direction.
As the occupant is more close to the window along the streamwise direction, it is more likely affected by the mixing effects of the cold inflow from the inlet and the warm thermal plume from the underneath heat source (see Figure 6). This will cause non-uniform distributions of air temperature around the occupant especially in the region of lower vertical levels, resulting in asymmetric PPD distributions in the front face (i.e. the orientation of ). In contrary, the symmetrical PPD distributions are observed for the occupant facing against the cold inflow and located at a further opposite wall to the window wall. Furthermore, for both location of occupants and , the temperature difference seems quite large (about ) in the region of lower vertical levels, and it becomes very small (about ) in the region of high vertical levels. There is little influence from the velocity field on the PPD calculation, since most of the velocity magnitude at the measuring points are very small, generally below .
PPD magnitude would increase by and , respectively, compared with the lowest volume-averaged temperature from a single occupant of the layout . This would lead to uncomfortable condition for the occupants. In case of a single occupant (e.g. the layout or the layout ), there is no major differences in terms of the level of thermal discomfort(i.e. PPD value). Furthermore, it is found that thermal comfort indices are very sensitive to the orientation of the incoming flow stream path towards the occupant, particularly at the lower vertical levels. A near symmetrical PPD distribution is obtained in the spanwise direction against the main inflow stream, while asymmetrical PPD distribution is observed in the streamwise direction against the main inflow stream as seen in Figure 7 and Figure 8.
Figure 8: PPD predictions for seated occupants (in red lines) and (in blue lines) in different layouts with sofa ( and in solid lines, while in dashed line) at four vertical locations (a) , (b) , (c) and (d) , respectively.
5.3 Case 3: Effect of heat transfer from heat-generating furniture (TV)
Figure 9 shows the influence of heat-generating furniture such as a TV with “on-mode” on average PPD values around two occupants ( and ) and the volume-average air temperature for three layouts with sofa ( , and ), comparing with that of the same layout but with TV “off-mode”. Same as before, an average PPD value is calculated from eight measuring points surrounding an occupant throughout the four vertical levels
and . It can be seen that for a TV of heat generation,
the PPD value increases for the two layouts and and for the third layout , compared to that with a TV “off-mode” scenario. These changes are mainly attributed to the increase of air temperature in the fluid domain approximately , due to the TV surface temperature of . The predicted rate of PPD variation with temperature are in good agreement with published results of Lin et al. [48], e.g. for
temperature increase and for temperature increase, respectively. In the
meantime, thermal comfort level is mostly likely decreased while the volume-average air temperature is above . From the polar map of PPD values obtained from these case studies (not shown here), the distribution shapes are quite similar to that of Figure 8, but the magnitudes are slightly higher than that of the acceptable indoor thermal condition.
for two occupants. An addition of heat generating furniture does not affect
[image:28.595.134.464.208.439.2]significantly on the original heat transfer pattern obtained from the occupied room with TV “off-mode”, since there is little difference in the PPD distributions between the “on-mode” and “off-mode” of the TV.
Figure 9: Comparison of average PPD values around occupants ( ) and volume–average air temperature for three layouts with sofa ( ) with TV “on-mode” and “off-mode”.
6
Numerical Optimisation of Thermal Comfort
The study considers the indoor environment numerical optimisation in order to achieve better thermal comfort for occupants without changing the room layout. Based on studies above, further investigation continues by varying the heat generation magnitude of the heat source and the ventilation flow rate, to understand their influences on the indoor temperature and the environment. The parameters considered are for the heat generation of a heat source (i.e. radiator panels) and for ventilation air velocity. The heat generation of a heat source is kept at an intermediate heat level between
23 24 25 26 27
0 10 20 30 40
S3H2
S3H1
S2H2
S1H1
Volume-average temperature ( C)
PPD (%) S3H2
S3H1
S2H2
S1H1
PPD Tair Off-mode
. The ventilation air velocity is also within the requirements of indoor thermal
comfort in dwellings (e.g. a ventilation rate in the range of [49]). Note that
is air change per hour (i.e. air change rate) , representing the circulation
frequency that the air within an enclosed space is replaced. This is equivalent to an air supply rate of in the model room of present study. Each case study applies to all three layouts with sofa . Based on the results obtained from those case studies above, further two cases are conducted, i.e. heat generation study (case B) and ventilation velocity study (case C), see Table 5 for description. The results will be compared with case study above (i.e. section 4.3, case A: , and
with ), in terms of the PPD and PMV values around the
[image:29.595.81.515.433.523.2]occupants, and fluid (air ) temperature, respectively.
Table 5
Parametric case studies
Case A (Baseline study)
Case B (Heat generation study)
Case C (Ventilation velocity study)
environment than that of case B, but do not have significantly improvement. In case of single occupancy, i.e. the layout or the layout , the predicted PPD values are generally within
variations throughout the vertical points, while in the layout , only case C gives
desirable values (i.e. the PPD value less than ). Overall, the PPD value improves about
for case B and for case C in the layout , compared with that of
case A. The large reduction of the PPD index is probably due to lower air temperature in the fluid domain, as shown in Figure 11.
Although the PPD predictions have shown some positive improvements of thermal comfort, thermal sensation (e.g. the way of feeling thermal comfort by a human being) could be divergent at the location of the occupant. Figure 11 shows comparison of average PMV value and volume-average temperature for case B and case C for each occupant in the sofa layouts, compared with that of the baseline case A. It is clear that case A predicts the highest PMV values for all three cases while case C gives the lowest predictions. In both case A and case B, the occupants in the layout could feel uncomfortable with the excess level of warm environment, (i.e. ). In contrary, the occupant in the layouts and in case C could feel slightly cooler or neutral, because of the predicted PMV indices of and
respectively. It can also be seen that there are noticeable volume-average temperature
Figure 10: PPD predictions for seated occupants (in red line) and (in blue line) in three layouts with sofa ( and (a, c, e, g) and (b, d, f, h)) for case A (in dash-dotted-dotted lines), case B (in solid lines) and case C (in dashed lines) at four vertical locations (a, b)
, (c, d) , (e, f) and (g, h) , respectively.
Figure 11: Comparison of average PMV values around occupants ( ) and volume– average air temperature from three layouts with sofa ( ) for cases A, B and C.
7
Conclusion
An investigation of indoor thermal environment in a 3-D furnished and occupied model room with localised heat source and window glazing has been carried out by computational fluid dynamics approach. The computational model was carefully validated against published data in literature for a 3-D empty model room [12, 23]. The model has been used to investigate the effect of furniture arrangement with and without heat generation and occupants in terms of indoor thermal comfort. After the investigation of the effect of non-heat generating furniture arrangement/location, the heat generation furniture and human beings are introduced to the computational domain. It was found that an existence of non-heat generating furniture in the
18
20
22
24
26
28
30
32
-0.2
0
0.2
0.4
0.6
0.8
1
1.2
S3H2
S3H1
S2H2
S1H1
Tvolume-average( C)
PMV S3H2
S3H1
S2H2
[image:33.595.133.463.195.419.2]room and further addition of furniture could induce complicated flow re-circulations and high local air velocities around the edge of the furniture. There was little influence on room temperature and airflow buoyancy strength, compared with that of unfurnished room case. Further introduction of thermal occupant however did have significant impact on temperature field by the formation and the development of strong thermal plume, with increased air temperature by compared with that of the unoccupied room case. In comparison, heat generation from a TV did not have important influence on the thermal comfort and heat transfer system. However, the number of occupant increase from one to two did increase air temperature in the fluid domain by , causing the PPD value increase by for which the occupants will normally feel uncomfortable in such a warm environment [48]. Furthermore, the location of the occupant is found very sensitive to the incoming flow stream path, e.g. the PPD distribution is symmetrical in the spanwise position but becomes asymmetrical in streamwise position. In a model room configuration as studied hereby, desirable indoor environment can be achieved under combined flow and thermal conditions of either and or and
, both with a fixed for a single occupancy sitting on a sofa
8
Acknowledgement
9
References
[1] European Commision. EU energy policy for buildings after the recast, Unit D4 – Energy efficiency, DG TREN. Directorate General for Energy and Transport. http://ec.europa.eu/energy/efficiency/doc/buildings/presentation_general_short.pdf [accessed May 2014].
[2] Alahmer A, Abdelhamid M, Omar M. Design for thermal sensation and comfort states in vehicles cabins. Applied Thermal Engineering 2012;36:126-140.
[3] Li F, Liu J, Pei J, Lin CH, Chen Q. Experimental study of gaseous and particulate contaminants distribution in an aircraft cabin. Atomospheric Envrionment 2014;85:223-233.
[4] Pourshaghaghy A, Omidvari M. Examination of thermal comfort in a hospital using PMV-PPD model. Applied Ergonomics 2012;43:1089-1095.
[5] Alfano FRD, Ianniello E, Palella BI. PMV-PPD and acceptability in natural ventilated schools. Building and Environment 2013;67:129-137.
[6] Barbhuiya S, Barbhuiya S. Thermal comfort and energy consumption in a UK educational building. Building and Environment 2013;68:1-11.
[7] Hens HSLC. Thermal comfort in office buildings: Two case studies commented. Building and Environment 2009;44:1399-1408.
[8] Bos MA, Love JA. A field study of thermal comfort with underfloor air distribution. Building and Environment 2013;69:233-240.
[9] Park AH, Chung WJ, Yeo MS, Kim KW. Evaluation of the thermal performance of a Thermally Activated Building System (TABS) according to the thermal load in a residential building. Energy and Buildings 2014;73:69-82.
[10] Jang MS, Koh CD, Moon IS. Review of thermal comfort design based on PMV/PPD in cabins of Korean amritime patrol vessels. Building and Environment 2007;42:55-61.
[11] Gagge AP, Stolwijk JAJ, Nishi Y. An effective temperature scale based on a simple model of human physiological regulatory response. ASHRAE Transactions 1971;77:247-262.
[12] Myhren JA, Holmberg S. Design considerations with ventilation-radiators: Comparisons to traditional two-panel radiators. Energy and Buildings 2009;41:92-100.
[14] ISO 13370, International standard, Thermal performance of buildings - Heat transfer via the ground - Calculation methods. 2007. Available at www.iso.org.
[15] Deuble MP, de Dear RJ. Mixed-mode buildings: A double standard in occupants' comfort expectations. Building and Environment 2012;54:53-60.
[16] MacArther JW. Humidity and predicted-mean vote-base (PMV-base) comfort control. ASHRAE Transactions 1986;92;5-17.
[17] Scheatzle DG. The development of PMV-based control for residence in a hot and arid climate. ASHRAE Transactions 1991;97:1002-1019.
[18] Federspiel CC, Asada H. User-adaptable comfort control for HVAC systems. Journal of Dynamic Systems, Measurement, and Control 1994;116:474-486.
[19] Fanger PO, Toftum J. Extension of the PMV model to non-air-conditioned buildings in warm climates. Energy and Buildings 2002;34:533-536.
[20] Homod RZ, Sahari KSM, Almurib HAF, Nagi FH. RLF and TS fuzzy model indentification of indoor thermal comfort based on PMV/PPD. Building and Environment 2012;49:141-153.
[21] Wei S, Li M, Lin W, Sun Y. Parametric studies and evaluations of indoor thermal environment in wet season using a filed survey and PMV-PPD method. Energy and Buildings 2010;42:799-806.
[22] Andreasi WA, Lamberts R, Candido C. Thermal acceptability assessment in buildings located in hot and humid regions in Brazil. Building and Environment 2010;45:1225-1232.
[23] Myhren JA, Holmberg S. Flow patterns and thermal comfort in a room with panel, floor and wall heating. Energy and Buildings 2008;40:524-536.
[24] Tye-Gingras M, Gosselin L. Comfort and energy comsumption of hydronic heating radiant ceilings and walls based on CFD analysis. Building and Environment 2012;54:1-13.
[25] Lan L, Pan L, Lian Z, Huang H, Lin Y. Experimental study on thermal comfort of sleeping people at different air temperatures. Building and Environment 2014;73:24-34.
[26] Atmaca I, Kaynakli O, Yigit A. Effects of radiant temperature on thermal comfort. Building and Environment 2007;42:3210-3220.
[28] Selens D, Parys W, Baetens R. Energy and comfort performance of thermally activated building systems including occupant behaviour. Building and Environment 2011;46:835-848.
[29] Alfano FRD, Palella BI, Riccio G. The role of measurement accuracy in the thermal environment assessment by means of OMV index. Building and Environment 2011;46:1361-1369.
[30] Frontczak M, Wargocki P. Literature survey on how different factors influence human comfort in indoor environments. Building and Environment 2011;46:922-937.
[31] Cengel YA, Ghajar AJ. Heat and mass transfer: Fundamentals and applications. Fourth edition. New York: McGraw-Hill, 2011.
[32] Wang M, Chen Q. Assessment of various turbulence models for transitional flows in enclosed environment (RP-1271). HVAC & R Research 2009;15:1099-1119.
[33] Jiang Y, Alexander D, Jenkins H, Arthur R, Chen Q. Natural ventilation on in buildings: Measurement in a wind tunnel and numerical simulation with large eddy simulation. Journal of Wind Engineering and Industrial Aerodynamics 3002;91:331-353.
[34] Chen Q, Lee K, Mazumdar K, Poussou S, Wang L, Wang M, Zhang Z. Ventilation performance prediction for buildings: Model assessment. Building and Environment 2010;45:295-303.
[35] Jin M, Zuo W, Chen Q. Simulating natural ventilation in and around buildings by fast fluid dynamics. Numarical Heat transfer, Part A: Applications, An International Journal of Computation and Methodology 2013;64:273-289.
[36] Horikiri K, Yao YF, Yao J. Numerical study of unsteady airflow phenomena in a ventilated room. Computational Therml Sciences 2012;4:317-333.
[37] Horikiri K, Yao YF, Yao J. Modelling conjugate flow and heat transfer in a ventilated room for indoor thermal comfort assessment. Building and Envrionment 2014;77:135-147.
[38] Olesen BW, Mortensen E, Thorshauge J, Berg-Munch B. Thermal comfort in a room heated by different methods. Technical paper no. 2256. Los Angeles Meeting: ASHRAE Transactions 86, 1980.
[39] Zuo W, Chen Q. Real-time or faster-than-real time simulation of airflow in buildings. Indoor Air 2009;19:33-44.
[41] Raji A, Hasnaoui M, Bahlaoui A. Numerical study of natural convection deminated heat transfer in a ventilated cavity: Case of forced flow playing simultaneous assisting and opposing roles. International Journal of Heat and Fluid Flow 2008;29:1174-1181. [42] Fluent 6.3. User’s guide: Radiation temperature. 2006
[43] Bojic M, Yik F, Lo TY. Locating air-conditioners and furniture inside residential flats to obtain good thermal comfort. Energy and Buildings 2002;34:745-751.
[44] Sorensen DN, Voigt LK. Modelling flow and heat transfer around a seated human body by computational fluid dynamics. Building and Environment 2003;358:753-762. [45] Zhuang R, Li X, Tu J. CFD study of the effects of furniture layout on indoor air quality under typical office ventilation schemes. Building Simulation 2014;7:263-275. [46] Niu JL, Zuo HG, Burnett J. Simulation methodology of radiant cooling with elevated air movement. Building simulation, Seventh International IBPSA Conference, Rio de Janeiro, Brazil. 2001.
[47] Nilsson HO. Comfort climate evaluation with thermal manikin methods and computer simulation models. Stockholm: Arbetslivsinstitutet, 2004.
[48] Lin Z, Chow TT, Tsang CF, Chan LS, Fong KF. Effect of air supply temperature on the performance of displacement ventilation (Part 1) - Thermal comfort. Indoor and Building Environment 2005;14:103-115.