15. S
ITE
1222
1Shipboard Scientific Party
2BACKGROUND AND OBJECTIVES
Site 1222 (13°48.98′N, 143°53.35′W; 4989 meters below sea level [mbsl]; Fig. F1) forms a south-central component of the 56-Ma transect drilled during Leg 199 and is situated ~2° south of the Clarion Fracture Zone in typical abyssal hill topography. On the basis of regional mag-netic anomalies, we anticipated basement age at Site 1222 to be equiva-lent to Chron C25r or Chron C25n (~56–57 Ma) (Cande et al., 1989), which is slightly older than at Site 1219. At the outset of drilling at Site 1222, our estimate for total sediment thickness was ~115 m (Fig. F2).
Based upon a fixed hotspot model (Gripp and Gordon, 1990, for 0- to 5-Ma Pacific hotspot rotation pole; Engebretson et al., 1985, for older poles) Site 1222 should have been located ~1° north of the equator at 56 Ma and ~4°N at 40 Ma. A nearby gravity core (EW9709-17GC), taken during the site survey cruise, recovered >5 m of red clay with a late– middle Miocene age on the basis of radiolarian biostratigraphy (Lyle, 2000). Deep Sea Drilling Project (DSDP) Site 42 located ~4° east of Site 1222, was not drilled to basement but contains a thin sedimentary sec-tion (~100 m thick) of upper Oligocene nannofossil ooze through mid-dle Eocene radiolarian nannofossil ooze. In turn, DSDP Site 162 lies ~1° north of DSDP Site 42 and is situated on young crust (49 Ma) that con-tains ~150 m of clayey radiolarian and nannofossil oozes of early Oligocene–middle Eocene age.
Site 1222 will be used to study the position of the Intertropical Con-vergence Zone in the late Eocene and Oligocene, to sample late Paleo-cene and early EoPaleo-cene sediments in the central tropical Pacific Ocean, and to help determine whether or not there has been significant south-ward movement of the hotspots with respect to the spin axis prior to 40 Ma.
160°W 150° 140° 130°
0°
10°
20°
30°
N
0 500 1000 Site 1215 Site 1216 Site 1217 Site 1218 Site 1219 Site 1220 Site 1221 Site 1222 Site 40 Site 42 Site 43
Site 69 Site 70 Site 71 Site 72 Site 160 Site 161 Site 162 Site 163 Site 573 Site 574 Site 575 Honolulu
Molokai F.Z.
Clipperton F.Z. Clarion F.Z.
Site 1216 Site 1217 Site 1218 Site 1222 Site 1221 Site 1220 Site 1215
Molokai Fracture Zone
Clarion Frac ture Zone
Mahi M ahi Fracture Zone
Site 1219
Clipp erton Fracture Zone
574 573 575 161 162 163 40 42 43 70 71 72 0° 10° 20° 5° 15° 25° N 150°W 145° 140° 135°
km
Leg 199 sites DSDP sites
F1. Site location map, p. 18.
PAT12-Line 6
Bandpass 3 km W
EW9709-18GC X Line 3 E Site 1222 6600 6700 6800 6900 7000 6500 7100 7200 Basement P2? P3? T w o-w a y tr a v eltime (ms) Hour Minute
F2. Seismic reflection profile, p. 19.
1Examples of how to reference the
whole or part of this volume.
2Shipboard Scientific Party
addresses.
SUMMARY
Site 1222 (13°48.98′N, 143°53.35′W) is situated ~2° south of the Clar-ion Fracture Zone in typical abyssal hill topography at a water depth of 4989 m. On the basis of regional seafloor magnetic anomalies, we antic-ipated basement age at Site 1222 to be equivalent to Anomaly An25 (~56–57 Ma) (Cande et al., 1989), which is slightly older than at Site 1219. At the onset of drilling at Site 1222, our estimate for total sedi-ment thickness was ~115 m, based upon a fixed hotspot model (Gripp and Gordon, 1990, for the 0- to 5-Ma Pacific hotspot rotation pole; Engebretson et al., 1985, for older poles). Site 1222 should have been lo-cated ~1° north of the equator at 56 Ma and ~4°N at 40 Ma.
Two holes were drilled at Site 1222. Hole 1222A was drilled to base-ment, which was reached at ~98 meters below seafloor (mbsf). Hole 1222B recored the advanced piston corer (APC)-suitable portion of the sediment column (to ~60 mbsf). The sediment column at Site 1222 con-tains a sequence of lithologies significantly different from that found at other Leg 199 sites. At Site 1222, we recovered a 97.8-m-thick section dominated by clay-rich lithologies and chert. Unit I consists of an ~55-m-thick yellowish brown to dark gray-brown clay with zeolites grading to radiolarian clay. A thin interval of diatomaceous clay is present near 17 mbsf (Sections 199-1222A-3H-2 to 3H-4). Within the diatom clay is an interval with unusual layers of laminated diatom ooze that contain a nearly pure diatom component of Pliocene age. Laminations are mainly white to olive. Diatom frustules within some laminae contain signifi-cant pyrite, which makes them appear very dark gray to black. A sharp contact exists at the base of the diatom ooze interval and the underly-ing clay of Subunit IA. In Hole 1222A, this contact also contains a large (5 cm diameter) botryoidal manganese nodule. Unit II, ~3 m thick, con-sists of dark brown to brown nannofossil clay grading downcore to yel-lowish brown nannofossil ooze. Very pale brown mottles are common. Nannofossil content (estimated from smear slides) gradually increases from 30% in the upper portion to 80% near the base of the unit. Unit III consists of an ~8-m-thick sequence dominated by clay with iron ox-ides and zeolites. Unit III is underlain by a thick (>30 m) poorly recov-ered sequence of massive chert that, in turn, overlies basement basalt.
Radiolarians provide the biostratigraphic framework for Site 1222. Planktonic foraminifers are completely dissolved in all samples investi-gated. Calcareous nannofossils of early Oligocene age are present in Unit II, and early Eocene nannofossils were found in chalk attached to a piece of chert that is present just above basement. This large chert nod-ule is rimmed with very pale brown nannofossil chalk that provides da-tums indicating an early Eocene age (NP10). The biostratigraphic distri-bution of radiolarians suggests massive reworking and mixed Pliocene assemblages in the uppermost two and a half cores (between ~0 and 21 mbsf). The following two cores (between ~21 and 40 mbsf) contain up-per and lower Miocene radiolarian assemblages. Two cores between ~40 and 60 mbsf hold upper and lower Oligocene radiolarian assemblages. Nannofossils are present between ~55 and 60 mbsf, supporting the ra-diolarian biostratigraphy. This upper part of the section at Site 1222 ap-pears to contain several breaks in sedimentation. A major hiatus is present between the lowermost Oligocene and the middle Eocene, hav-ing a duration on the order of ~5–6 m.y.
which it was possible to align most cores from the two drilled holes to each other but without continuous overlap. Cores 199-1222A-7H and 199-1222B-7H, however, showed good overlap and allowed the splicing of an additional ~13 m from ~59 to 72 mcd.
The paleomagnetic data from lithologic Subunit IA, down to (~40 mbsf) are not interpretable, except for the very top of Hole 1222A. A large group of characteristic remanent magnetization (ChRM) direc-tions show relatively high magnetic inclinadirec-tions after demagnetization especially in the most clay-rich lithologic units. The cause of the steep inclinations is unclear and might be indicative of unrecognized defor-mation and physical grain rotation caused by drilling. A preliminary correlation of the magnetic stratigraphy to the goemagnetic polarity timescale shows that at the very top of the section we were able to iden-tify the bottom of polarity Chron C1n (Brunhes). Below 40 mcd, we note magnetic reversals but can only identify Chrons C6Cn to C11n with any confidence.
The pore water profiles from Site 1222 primarily reflect minor or-ganic matter degradation and the dissolution of biogenic silica. Most of the dissolved chemical constituents show a lack of gradient with depth and values similar to or slightly higher than seawater.
OPERATIONS
Site 1222
Transit to Site 1222 (PAT-12C)
The 107-nmi voyage to proposed Site PAT-12C was accomplished in 10.5 hr at an average speed of 10.2 kt. The vessel proceeded directly to the site without conducting a survey. The Global Positioning System re-ceiver interface to the dynamic positioning system was employed to sit-uate the vessel over the coordinates of the new location by 0745 hr on 10 December 2001. A beacon was deployed at 0845 hr. The corrected precision depth recorder (PDR) depth was 5009.4 meters below rig floor (mbrf).
Hole 1222A
After the drill string was deployed to a depth of 4955 mbrf, the driller lowered the bit until the heave compensator appeared to activate, sug-gesting contact with a firm seafloor at ~5001 mbrf. The drill string was then picked up 5 m to position the bit at a depth of 4996 mbrf. Hole 1222A was spudded with the APC at 1815 hr on 10 December. The sea-floor depth indicated by the recovery of the initial core was 5000.1 mbrf, 8.4 m shallower than the PDR depth.
Piston coring in Hole 1222A advanced to an APC refusal depth of 71.9 mbsf, with an average recovery of 102.9% (Table T1). Orientation began with Core 3H. The hole was further deepened with four extended core barrel (XCB) cores until basement contact at a depth of 107.3 mbsf. The average recovery for the 35.4-m XCB-cored section was 1.8%.
Hole 1222B
After coring operations were completed in Hole 1222A, the drill pipe was pulled out of the hole, and after the bit cleared the seafloor at 1735 hr on 11 December, the vessel was offset 20 mi east of Hole 1222A. Hole
1222B was spudded with the APC at 1910 hr and coring advanced to re-fusal depth (64.4 mbsf) (Table T1). As Core 7H was brought on deck, the time allotted for coring expired. The average recovery for the hole was 99.0%. Orientation started with Core 3H.
After coring operations ceased in Hole 1222B, the drill string was re-covered and the bottom-hole assembly was disassembled into compo-nent parts and was secured into the drill collar bays. During the recov-ery of the drill string, the beacon was successfully recalled. After the drilling equipment was secured, the drilling crew spent 1 hr cutting and slipping the drilling line. The vessel departed for Honolulu at 1730 hr on 12 December.
LITHOSTRATIGRAPHY
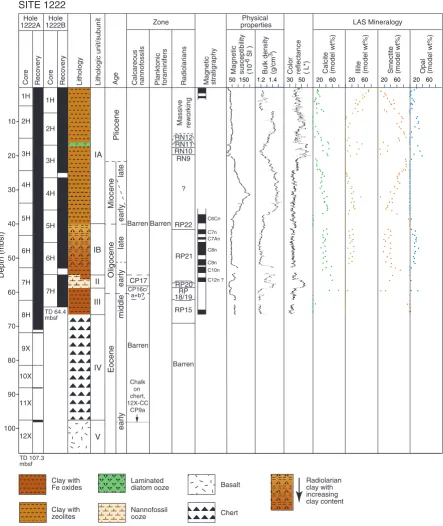
Site 1222 recovered a 97.8-m-thick section dominated by clay-rich li-thologies and chert (Fig. F3). Fifty-five meters of lower Oligocene and younger clay with zeolites and radiolarian clay overlies 3.8 m of basal Oligocene nannofossil ooze. Eocene sediments are represented by clay and chert and are poorly recovered. The sedimentary section was di-vided into four units based on compositional differences. A fifth unit, seafloor basalt, was also recovered. Hole 1222A had better recovery and less core disturbance than Hole 1222B. For this reason, much of the fol-lowing description is primarily based on sediments from Hole 1222A.
Unit I
Intervals: 1222A-1H, 0 cm, through 7H-2, 40 cm, and 199-1222B-1H, 0 cm, through 7H-5, 91 cm
Depths: 0–54.9 mbsf (Hole 1222A) and 0–61.8 mbsf (Hole 1222B) Age: Holocene to early Oligocene
Lithology: Clay with zeolites grading to radiolarian clay
Unit I is divided into two subunits based upon lithologic components. A gradational contact exists between the subunits and with Unit II be-low.
Subunit IA
Intervals: 1222A-1H, 0 cm, through 5H-6, 10 cm, and 199-1222B-1H, 0 cm, through 6H-2, 40 cm
Depths: 0–40.5 mbsf (Hole 1222A) and 0–47.1 mbsf (Hole 1222B) Age: Holocene to late Oligocene
Lithology: clay with zeolites
Subunit IA consists of light yellowish brown to very dark grayish brown (10YR 6/4 to 10YR 3/2) clay with zeolites. Zeolites (authigenic phillipsite) are common to abundant, especially in the lighter-colored (10YR 6/4) intervals. A minor amount of iron oxides and opaque miner-als are miner-also present, and a few small (2- to 3-mm diameter) manganese nodules are disseminated throughout this subunit. A thin interval of di-atomaceous clay is present near 17 mbsf (intervals 199-1222A-3H-2, 21 cm, through 3H-4, 82 cm, and 199-1222B-2H-7, 35 cm, through 3H-2, 87 cm). Within the diatom ooze are several unusual layers of laminated diatom ooze that contain a nearly pure diatom component (Fig. F4). Laminations are mainly white to olive (5Y 8/1 to 5Y 5/3). Diatom
frus-Core
Depth (mbsf)
RecoveryCoreRecovery Hole 1222A Hole 1222B 10 20 30 40 60 70 80 90 50 100 SITE 1222
Magneticsusceptibility(10
-6
SI ) Bulk density(g/cm
3) Magneticstratigraphy
Color reflectance( L*) Calcite(model wt%) Illite(model wt%) Smectite(model wt%) Opal(model wt%) Lithology Lithologic unit/subunit Age
Physical properties LAS Mineralogy Zone
Planktonicforaminifers Calcareousnannofossils Radiolarians 1H 1H 2H 3H 4H 5H 6H 7H 2H 3H 4H 5H 6H 7H 8H 9X 10X 11X 12X TD 107.3 mbsf TD 64.4 mbsf V IV III II IB IA Basalt Chert Radiolarian clay with increasing clay content
50 1501.2 1.430 50
Nannofossil ooze Clay with Fe oxides Clay with zeolites Laminated diatom ooze Pliocene Miocene Oligocene Eocene early late early middle early late CP17 CP16c/ a+b? Chalk on chert, 12X-CC CP9a Barren Barren Barren Barren RN10 RN9 RP22 RP21 RP20 RP 18/19 RP15 RN11 RN12 Massivereworking ? C6Cn C7n C7An C8n C9n C10n C12n ? 2060 2060 20602060
F3. Lithologic summary, p. 20.
199-1222A-3H-4 cm 70 80 100 90 60 50
tules within some laminae contain significant amounts of pyrite, mak-ing them appear very dark gray to black (10YR 2/2 to 10YR 2/1). A sharp contact exists between the base of the diatom ooze interval and the un-derlying clay of Subunit IA. In Hole 1222A, this contact also contains a large (5 cm diameter) botryoidal manganese nodule (interval 199-1222A-3H-4, 80–85 cm).
Subunit IB
Intervals: 1222A-5H-6, 10 cm, through 7H-2, 40 cm, and 199-1222B-6H-2, 40 cm, through 7H-5, 91 cm
Depths: 40.5–54.9 mbsf (Hole 1222A) and 47.1–61.8 mbsf (Hole 1222B)
Age: late to early Oligocene
Lithology: radiolarian clay grading to clay with radiolarians
Subunit IB consists of very dark grayish brown to dark brown (10YR 3/2 to 10YR 3/3) radiolarian clay. Bioturbation is slight to moderate throughout this interval causing some yellowish brown to brown (10YR 5/6 to 10YR 5/3) mottling. Radiolarian content varies only slightly, com-prising ~40% of the lithology. Minor components include oxide miner-als, zeolites, volcanic glass, and sponge spicules.
Unit II
Intervals: 1222A-7H-2, 40 cm, through 7H-4, 130 cm, and 199-1222B-7H-5, 91 cm, through 7H-CC
Depths: 54.9–58.7 mbsf (Hole 1222A) and 61.8–64.4 mbsf base of hole (Hole 1222B)
Age: early Oligocene
Lithology: nannofossil ooze
This unit consists of dark brown to brown (10YR 3/3 to 10YR 4/3) nan-nofossil clay grading downcore to yellowish brown (10YR 5/4) nanno-fossil ooze. Very pale brown (10YR 8/2) mottles are common. Nannofos-sil content (estimated from smear slides) gradually increases from 30% in the upper portion to 80% near the base of the unit. Minor amounts of iron oxides, zeolites, volcanic glass, and radiolarians are also present. The transition from Unit II to Unit III is gradual.
Unit III
Interval: 199-1222A-7H-4, 130 cm, through 8H-3, 115 cm Depth: 58.7–66.6 mbsf
Age: middle Eocene to early Eocene Lithology: iron oxide clay with zeolites
Unit IV
Interval: 199-1222A-8H-3, 115 cm, through 12X-CC, 4 cm Depth: 66.6–97.7 mbsf
Age: early Eocene Lithology: chert
Sediments comprising Unit IV were poorly recovered by drilling and are represented by a few small angular chert fragments recovered in the core catchers of the XCB. The uppermost 5.4 m of this unit (interval 199-1222A-8H-3, 155 cm, through 8H-CC) are highly disturbed by flow-in consisting of small chert fragments mixed with sediments from Unit III. The Unit III–IV transition was placed at the top of the flow-in disturbance because this is probably the depth at which chert was first encountered. Chert fragments are black (N1) and exhibit thin, very dark brown (10YR 2/2) laminations. Just above basement, a large chert nod-ule rimmed with very pale brown (10YR 8/2) nannofossil chalk provides a datum that indicates early Eocene age (Subzone CP9a [NP10]) (see
“Calcareous Nannofossils,” p. 7, in “Biostratigraphy”). A few small
fragments of claystone are also mixed with chert breccia near the base of Section 199-1222A-12X-CC.
Unit V
Interval: 199-1222A-12X-CC, 4–45 cm Depth: 97.7–97.8 mbsf
Age: early Eocene Lithology: basalt
Core 199-1222A-12X contains a fine-grained, weathered ocean-floor basalt with aphanitic texture and a glassy rim. Fragments are highly al-tered and show light greenish gray color (5YG 7/1).
Discussion/Summary
The sedimentary section at Site 1222 is dominated by chert and clay-rich lithologies. Nannofossils scraped from the rim of one chert frag-ment recovered directly above basefrag-ment basalt suggest sedifrag-mentation began during the early Eocene at ~53.5 Ma. Basal sediments at this site are poorly represented but probably include carbonate chalk and clay-stone lithologies, based on the few fragments recovered with chert drill-ing breccia in Section 199-1222A-12X-CC and at other Leg 199 drill sites. Sedimentation during the middle Eocene was dominated by clay, probably eolian transported. However, hydrothermal sources may have contributed a substantial amount of material to this site as suggested by the increased amount of iron oxide minerals (35%) compared to other sites. Sediments gradually shift in composition from clay to nannofossil ooze across the Eocene/Oligocene (E/O) boundary interval, a lithologic change that is likely related to the global deepening of the calcite com-pensation depth in the early Oligocene (van Andel et al., 1975).
Program Leg 138 (Kemp et al., 1995). The depositional model proposed for laminated diatom intervals suggests algal mats may represent re-gions near strong oceanic frontal boundaries. This would suggest that a water-mass boundary may have been present near 13°N above Site 1222 during the Pliocene.
Clay once again dominates the sequence in sediments younger than the Pliocene. More than 16 m of clay was deposited since the late Pliocene. Typically, pelagic clays accumulate at much slower rates, thus, sediment reworking in this portion of the sequence seems likely (see
“Radiolarians,” p. 8, in “Biostratigraphy”).
BIOSTRATIGRAPHY
Radiolarians provide the biostratigraphic framework for Site 1222. Planktonic foraminifers are completely dissolved in all samples investi-gated. Calcareous nannofossils of early Oligocene age are present in one short interval in Core 199-1222A-7H, and early Eocene calcareous nan-nofossils are present in chalk attached to a piece of chert in Section 199-1222A-12X-CC.
The biostratigraphic distribution of radiolarians suggests massive re-working and mixed Pliocene assemblages in the uppermost two and a half cores, between 0 and 21 mbsf (Fig. F5). The following two cores, between ~21 and 40 mbsf, contain upper and lower Miocene radiolar-ian assemblages. Two cores between ~40 and 60 mbsf contain upper and lower Oligocene radiolarian assemblages. Nannofossils are present between ~55 and 60 mbsf, supporting the radiolarian biostratigraphy. This upper part of the section at Site 1222 appears to contain several breaks in sedimentation. Unlike other Leg 199 sites, at Site 1222 a ma-jor hiatus is present between earliest Oligocene and middle Eocene time, having a duration on the order of ~5–6 m.y.
Calcareous Nannofossils
Calcareous nannofossils are present from Sample 199-1222A-7H-2, 60 cm, through 7H-CC. Sample 199-1222A-7H-2, 60 cm, contains a se-verely reduced, dissolution-biased assemblage with remains of Dictyoc-cites hesslandii, Sphenolithus moriformis, and distal shield rims of Cocco-lithus pelagicus. Discoaster deflandrei, Discoaster nodifer, and Discoaster tanii are also present; most specimens show calcite overgrowth. The up-permost occurrence of Reticulofenestra umbilicus is observed between Samples 199-1222A-7H-4, 60 cm, and 7H-4, 84 cm. It follows that the transition from nannofossil-bearing sediment to the overlying barren sediment in Core 199-1222A-7H is present just above the CP16c/CP17 (NP22/NP23) zonal boundary.
Nannofossil assemblages are increasingly dissolved through Section 199-1222A-7H-5. Samples 199-1222A-7H-5, 5 cm, and 7H-5, 50 cm, can be referred to Subzone CP16c (NP22), whereas the nannofossils in Sam-ple 199-1222A-7H-5, 100 cm, are too dissolved to say with any confi-dence whether this sample belongs to Subzone CP16c or CP16a+b (NP21). Sample 199-1222A-7H-5, 147 cm, only contains discoasters, but none of these are the exclusively Eocene forms that characterize Zone CP15 (NP20). Core 199-1222A-7H is barren of calcareous nannofossils below Sample 199-1222A-7H-5, 147 cm, although the core catcher sam-ple contains isolated contaminated pieces of nannofossil ooze belong-ing to the overlybelong-ing Oligocene Subzone CP16c (NP22).
Core
Depth (mbsf)
Recovery Core Recovery
Hole 1222A 10 20 30 40 60 70 80 90 110 50 100 1H 1H 2H 3H 4H 5H 6H 7H 2H 3H 4H 5H 6H 7H 8H 9X 10X 11X 12X TD 107.3 mbsf TD 64.4 mbsf Oligocene Miocene Pliocene early middle late
Calcareous nannofossils Radiolarians
early Barren Chalk on chert, 12X-CC: CP9a (NP10) Series Barren RP22 RN12 ? CP17 CP16c /a+b? RN10 RN9 RP20 RP15 RP18/19 RP21 late early Hole 1222B Barren Massive reworking Planktonicforaminifers Barren RN11 Eocene Not zoned late
Chalk attached to a piece of chert in Section 199-1222A-12X-CC con-tains nannofossils representing lowermost Subzone 9a (NP10) of the lower Eocene. The assemblage of this sample includes overgrown speci-mens of Tribrachiatus bramlettei, together with Chiasmolithus bidens, C. pelagicus, Discoaster mohleri, Discoaster multiradiatus, Discoaster nobilis, Ericsonia spp., Neochiastozygus junctus, Neocrepidolithus spp., Placozygus sigmoides, Prinsius bisulcus, Sphenolithus primus, and Toweius pertusus.
Planktonic Foraminifers
Planktonic foraminfers were not found in any core catcher samples from Site 1222.
Benthic Foraminifers
Core catcher samples from Cores 199-1222A-1H through 12X are barren of benthic foraminifers. However, benthic foraminifers were found at one horizon in Hole 1222B. Sample 199-1222B-1H-CC con-tains a benthic foraminiferal assemblage characterized by Siphonodo-saria abyssorum, Cibicidoides mundulus, Gyroidinoides soldanii, and Oridor-salis umbonatus. C. mundulus is a long-ranging species from late Oligocene to Pleistocene, and this species is abundant at bathyal and abyssal paleodepths (van Morkhoven et al., 1986). This assemblage shows moderate preservation.
Radiolarians
The preservation and abundance of radiolarians at this site varied considerably both downhole and within individual cores (Table T2). Re-working of Eocene and Oligocene taxa plus a number of hiatuses within the sedimentary sequence made zonal designation difficult. Zonal boundaries for radiolarians at Site 1222 are listed in Table T3.
Although Cores 199-1222A-1H and 2H contain a few moderately well preserved forms, it was not possible to assign an age to the mate-rial. It is probably Quaternary but with an admixture of Eocene and Oli-gocene. Several samples were taken from within Core 199-1222A-3H on either side of the diatom mats noted by the sedimentologists (see
“Sub-unit IA,” p. 4, in “Lithostratigraphy”). Along with reworked Eocene
species, Sample 199-1222A-3H-2, 14–16 cm, contains a mixed assem-blage of species indicative of the Pliocene. The presence of Pterocanium prismatium, Anthocyrtidium angulare, and Lamprocyrtis nigriniae suggest Zone RN12, but Stichocorys peregrina is also present, which suggests Zone RN11 or older. Sample 199-1222A-3H-2, 14–16 cm, and subsequent Core 199-1222A-3H samples all contain an abundance of fragments of the diatom Ethomodiscus rex. An age assignment of Zone RN10 is clearer for Samples 199-1222A-3H-2, 110–112 cm; 3H-3, 42–44 cm; and 3H-4, 18–20 cm, with a greater abundance of species such as S. peregrina, Spon-gaster tetras tetras, and P. prismatium amidst the ever-present reworked Eocene species. We have assigned an age of Zone RN9 to Sample 199-1222A-3H-4, 88–90 cm, because of the presence of Didymocyrtis penul-tima, the last presence of which marks the RP9/RP10 zonal boundary. Samples from the above-described interval represent the only Pliocene material found during Leg 199.
The next downhole sample for which it is possible to determine an age is Sample 199-1222A-5H-6, 45–47 cm. It belongs to uppermost Oli-gocene Zone RP22, based on the presence of Lychnocanoma elongata and
T2. Summary of radiolarian zonal boundary ages, p. 41.
the absence of Cyrtocapsella tetraperam, but also contains a large amount of reworked Eocene material. Sample 199-1222A-5-CC belongs to Zone RP21. The sample also contains a large number of orosphaerids and, once again, a reworked Eocene fauna. Core 199-1222A-6H and the up-per three sections of Core 199-1222A-7H contain only trace amounts of non–age diagnostic radiolarians. Abundance and preservation improves slightly in Samples 199-1222A-7H-4, 45–47 cm, and 7H-5, 45–47 cm. Based on the presence of Dorcadospyris spinosa, Dorcadospyris quadripes,
and Theocyrtis tuberosa, we assigned an age of Zone RP20 to these sam-ples, despite the absence of Lithocyclia angusta. In Sample 199-1222A-7H-6, 45–47 cm, it becomes more difficult to distinguish reworked spec-imens from in-place fauna. The rare and poorly preserved specspec-imens suggest an age of Zone RP18 or younger. Data from the nannofossil as-semblage in Sample 199-1222A-7H-5, 100 cm, indicate that an age younger than Zone RP18 is appropriate. There is an ~6-m.y. hiatus be-fore Sample 199-1222A-7H-7, 66–68 cm, which clearly belongs to Zone RP15 as do subsequent downhole samples (199-1222A-7H-CC; 8H-2, 45–46 cm; and 8H-3, 45–47 cm). The rest of the recovered material in Hole 1222A is barren of radiolarians or contains only trace amounts of non–age diagnostic forms.
Material recovered from Hole 1222B shows a similar pattern of dis-jointed ages, preservation, and radiolarian abundance. Sample 199-1222B-1H-CC contains an abundance of reworked Eocene fauna along with rare late Neogene forms such as Theocorythium vetulum, Didymo-cyrtis tetrathalamus, and Lamprocyrtis heteroporos. Samples from 199-1222B-2H-4, 36–38 cm; 2H-5, 43–45 cm; and 2H-CC probably belong to Zone RP11. In Samples 199-1222B-5H-CC, 6H-CC, and 7H-3, 45–47 cm, the fauna indicates an age of Zone RP21. Sample 199-1222B-5H-CC is particularly rich in orosphaerids. The remaining downhole samples (199-1222B-7H-5, 100–102 cm; 7H-6, 44–46 cm; and 7H-CC) all could be placed in Zone RP20.
PALEOMAGNETISM
All APC cores from Holes 1222A and 1222B that did not show a large drilling-related disturbance were measured on the shipboard pass-through cryogenic magnetometer. Natural remanent magnetization (NRM) was measured at 5-cm intervals in each core section, followed by three steps of alternating-field (AF) demagnetization up to a maximum peak field of 20 mT. In addition to whole long-core measurements, dis-crete samples were taken from Hole 1222A to carry out more detailed progressive demagnetization and rock-magnetic analysis.
The NRM intensities were in the order of 10–1 to 10–2 A/m and de-creased to ~10–2 to 10–3 A/m after partial AF demagnetization (Fig. F6). The drilling-induced overprint was mostly removed by AF demagnetiza-tion at 10 mT. Yet, a large group of ChRM direcdemagnetiza-tions show relatively high magnetic inclinations after blanket demagnetization, especially in the most clay-rich lithologic units. The cause of the steep inclinations is unclear and might be indicative of unrecognized deformation caused by drilling. We noticed that cores (e.g., 199-1222A-4H) with bedding features or burrows show that the sediment has been deformed near the core wall edges or “core liner.”
The paleomagnetic data from lithologic Subunit IA down to ~40 mbsf are not interpretable except for the very top of Hole 1222A. Core 199-1222A-4H displays a subvertical magnetic inclination, which is
Depth (mcd)
Intensity (A/m)
0
20
40
60
80
10-3 10-2 10-1 10-4
10
30
50
70
clearly not a record of the paleomagnetic field. We suspect that core de-formation is responsible for such a distribution of magnetization direc-tions. Other cores from both Holes 1222A and 1222B also show variable degrees of disturbance, mostly related to flow-in, and have not been considered for further paleomagnetic analysis.
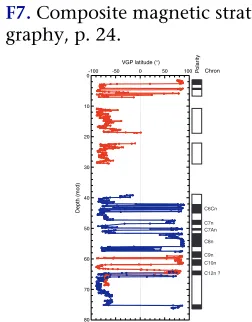
Sediments in lithologic Subunit IB provided identifiable paleomag-netic polarity reversals. A preliminary correlation of the magpaleomag-netic stra-tigraphy to the geomagnetic polarity timescale is shown in Figure F7. At the very top of the section, we were able to identify the bottom of po-larity Chron C1n (Brunhes). Stratigraphically downward, we identify Chrons C6Cn to (?)C12n. A long reversed-magnetization chron at the bottom of the section (~67 to 75 mcd) (Fig. F7) could represent Chron C18r, as Zone RP15 (middle Eocene) is found starting at ~66 mcd (see
“Radiolarians,” p. 8, in “Biostratigraphy”) and downhole.
COMPOSITE DEPTHS
Site 1222 extended to a total depth of 98.15 mbsf (Core 1222A-12X), with good recovery down to a depth of 71.13 mbsf (Core 199-1222A-8H). Below this depth, only chert and basalt were recovered. Similar to Site 1221, cores recovered from Site 1222 frequently showed evidence of flow-in, attributed to strong heave motions during coring. The predominantly clay and radiolarian clay found at Site 1222 showed signs of significant expansion during coring, which resulted in longer than average gaps between consecutive cores. Thus, although overlap between the two adjacent drilled holes was good, it was difficult to gen-erate a complete and continuous record.
A composite section was constructed for the upper 80 mcd of Site 1222 using multisensor track (MST) and color reflectance data to deter-mine depth offsets between cores from Holes 1222A and 1222B (Fig.
F8). Magnetic susceptibility (MS), P-wave velocity, natural gamma ray (NGR), and color reflectance data were collected at 2-cm intervals and GRA bulk density at 4-cm intervals in all APC cores. Disturbed intervals, as determined by visual inspection of split cores, are listed in Table T4.
Data from these intervals were removed prior to correlation work. Table
T5 lists the offsets that were applied to cores from each hole to create a composite depth record.
[image:10.612.430.556.73.234.2]It was possible to construct a continuous spliced record from Site 1222 down to the base of Core 199-1222A-4H (34.44 mbsf; 37.88 mcd), below which it was possible to align most cores from the two drilled holes to each other but without continuous overlap. As many intervals in Hole 1222B showed flow-in and had to be removed prior to correla-tion, data from below Core 199-122A-4H were merely appended to the splice. Exceptions to this are Cores 199-1222A-7H and 199-1222B-7H, which showed good overlap and allowed the splicing of an additional ~13 m from ~59 to 72 mcd.
Figure F9 shows the resulting spliced records for GRA bulk density, MS, and color reflectance (splice tie points for Site 1222 are given in Table T6). The unusual MS profile bears resemblance to that obtained from Site 1215. Together with age control provided by biostratigraphic datums (see “Biostratigraphy,” p. 7), this might allow further correla-tion between sites.
C6Cn C7n C7An C8n C9n C10n C12n ? -100 -50 0 50 100 0 10 20 30 40 50 60 70 80
VGP latitude (°)
Depth (mcd)
P
olar
ity
Chron
F7. Composite magnetic strati-graphy, p. 24.
1.1 1.3 1.4 1.6 1.8 0
20
40
60
80
GRA bulk density
Depth (mcd)
(g/cm3)
0 100 200
Magnetic susceptibility (10-6 SI)
20 40 60 80
Color reflectance (L*)
F8. GRA bulk density, magnetic susceptibility, and color reflec-tance data plotted vs. composite depth, p. 25.
T4. Core disturbance intervals, p. 45.
T5. Core composite depth offsets, p. 46.
1.1 1.3 1.4 1.6 1.8 0 20 40 60 80 Depth (mcd)
GRA bulk density (g/cm3)
0 80 160
Magnetic susceptibility (10-6 SI)
20 40 60 80
Color reflectance (L*)
F9. Spliced records of GRA bulk density, magnetic susceptibility, and the color reflectance parame-ter, p. 26.
SEDIMENTATION AND ACCUMULATION RATES
The radiolarian stratigraphy, together with a set of 21 paleomagnetic reversals, is defined in Holes 1222A and 1222B (Tables T7, T8). These stratigraphies are used to calculate the average linear sedimentation rates (LSRs) for Site 1222 through the section, with dependence on two nannofossil events providing age constraints near the base of the Oli-gocene and the base of the section (Fig. F10; Table T8). The paleomag-netic stratigraphy extends through the section recovered by APC coring (0–81 mcd). At the base of the Oligocene in Core 199-1222A-7H, there is a marked hiatus as the radiolarian assemblage (although poorly pre-served and containing reworked older specimens) shows a transition from the lower Oligocene Zone RP20 in Section 199-1222A-7H-5 through a poorly preserved upper Eocene interval in Section 7H-6, to a well-preserved middle Eocene assemblage (Zone RP15) in Section 7H-7 (see “Biostratigraphy,” p. 7). The age of the base of the hole is based on the identification a nannofossil assemblage from Zone NP10, recovered from the crust of a piece of chert in Section 199-1222A-12X-CC (Tables
T7,T8).
There is no site survey piston core from Site 1222; however, the pis-ton Core EW9709-14P (Lyle, 2000), taken at the next closest site (Site 1221), can be correlated to the density record of Site 1222 (Fig. F11). This correlation is consistent with radiolarian biostratigraphy in the piston core and at Site 1222. Unlike Site 1221, Site 1222 has a fairly thick interval of siliceous clays overlying the high-amplitude density variations found in the lower Oligocene section of lithologic Units II and III (see “Lithostratigraphy,” p. 4). The section in the piston core equivalent to lithologic Unit I in Site 1222 is represented by 4.5 m of pelagic red clay showing none of the density variations seen in Site 1222 (Fig. F11; see “Lithostratigraphy,” p. 4).
Based on a simple linear interpolation through the uppermost stra-tigraphic events (Tables T7,T8), the siliceous clays of the upper part of lithologic Subunits IA (see “Lithostratigraphy,” p. 4) have an LSR of about 5.5 m/m.y. Below this relatively high LSR of the Pliocene– Quaternary section, the rates decrease markedly through the Miocene (Fig. F10). Starting in the Oligocene (top of Chron C7n; Tables T7,T8), the LSR generally increases, reaching 3–6 m/m.y. in the Oligocene. Part of the base of the Oligocene may be missing in the hiatus interval that spans the E/O boundary, giving rise to the relatively low LSR (1.75 m/m.y.) in the lower Oligocene. Below the hiatus zone down to the base of the section, the LSR is estimated to be ~1.45 m/m.y.
LSR values may be combined with the dry bulk density (DBD) data from porosity measurements on individual samples (see “Physical
Properties,” p. 13) (Table T12) to determine the bulk mass
accumula-tion rates (MARs) of the sediments (Table T9). Sediment with an LSR of 1.0 cm/k.y. and a DBD of 1.0 g/cm3 will have an MAR value of 1.0 g/cm2/k.y. The observed values are rarely this high, so we report the data in milligrams per square centimeter per thousand years (mg/cm2/ k.y.) (Fig. F12). MAR values are relatively high in the Pliocene sedi-ments of Subunit IA (>250 mg/cm2/k.y.). These are the highest MAR values for the young part of the section seen at any of the Leg 199 sites. The lower portion of Subunit IA has lower flux values of 60–80 mg/cm2/k.y. The radiolarian clays of Subunit IB accumulated at a modest rate of ~150 mg/cm2/k.y. The lower Oligocene nannofossil ooze of Unit II displays flux values of only 50–100 mg/cm2/k.y.,
al-T7. Paleomagnetic events, p. 48.
T8. Nannofossil and radiolarian events, p. 49.
0 20 40 60 80 100
0 10 20 30 40 50 60
Depth (mcd) Age (Ma) Nannofossils Radiolarians Foraminifers Paleomagnetic reversal 5.5 m/m.y. 1.34 m/m.y. 0.50 m/m.y. 3.79 m/m.y. 6.0 m/m.y. 2.59 m/m.y. 1.75 m/m.y. 1.45 m/m.y. Hiatus interval
F10. LSRs and chronostratigraphic markers, p. 27.
1.1 1.2 1.3 1.4 1.5 1.6 1.7
1.1 1.2 1.3 1.4 1.5 1.6 1.7 1.8 0 10 20 30 40 50 60 70 EW9709-14P Site 1222 Site 1222 density (g/cm3)
EW9709-14P density (g/cm3)
Depth at Site 1222 (mcd)
F11. Density record of site survey piston Core EW9709-14P com-pared to density record of Site 1222, p. 28.
T9. Depths, ages, rates, and fluxes of sediments, p. 50.
0 10 20 30 40 50 60
0 50 100 150 200 250 300 350
Age (Ma)
MAR (mg/cm2/k.y.) Lithologic Subunit IA
Lithologic Subunit IB
Lithologic Unit IV Lithologic Unit III Lithologic Unit II
though data are few for this horizon. Unit III, a clay layer, accumu-lated quite slowly and may contain, or record, a significant hiatus. There are no data relevant to determination of fluxes in the chert ho-rizon of Unit IV.
GEOCHEMISTRY
Interstitial Water Geochemistry
We collected interstitial waters from Hole 1222A from one sample from every core for the first six cores at depths ranging from 2.95 to 47.85 mbsf (Table T10; Fig. F13).
Chlorinity, as measured by titration, increases with depth from 553 mM at 2.95 mbsf to 557 mM at 47.85 mbsf (Fig. F13). Sodium concen-trations (determined by charge balance) are, on average, 1.6% higher than those measured by ion chromatograph. Sodium concentrations generally remain steady at values similar to that of average seawater. Salinity, as measured by a handheld refractometer, increases with depth from 34.5 at 2.95 mbsf to 35.0 at 47.85 mbsf.
Alkalinity increases with depth from 2.51 mM at 2.95 mbsf to 3.00 mM at 47.85 mbsf. The pH varies between 6.98 and 7.13. Like all other Leg 199 sites, average sulfate concentrations are high (30.0 mM) and ammonium concentrations are low (≤6 µM), indicating little oxidation of organic matter.
Dissolved silica concentrations increase slightly with depth, from 474 µM at 2.95 mbsf to ~628 µM at 47.85 mbsf. These interstitial water silica values are consistent with dissolution of biogenic silica.
Calcium and magnesium show little evidence of basement alteration. Calcium and magnesium concentrations are relatively constant down-core (9 and 55 mM, respectively), except for one sample at 19.35 mbsf, which has relatively high Ca (14 mM) and low magnesium (50.1 mM) concentrations. Potassium concentrations decrease slightly downsec-tion from ~12 to 11 mM. Lithium concentradownsec-tions increase slightly downsection, from ~27 to 29 µM.
Strontium concentrations remain at values similar to seawater throughout the record, consistent with the low levels of carbonate in these sediments. Dissolved manganese increases from ~0 µM at 2.95 mbsf to ~40 µM at the level of the calcium maxima and the magnesium minima (19.35 mbsf) and subsequently decreases to negligible values at 47.85 mbsf. Barium is low throughout the profile (≤1 µM). Levels of dis-solved boron are slightly higher than average seawater (416 µM). Boron concentrations increase from ~472 µM at 2.95 mbsf to ~552 µM at 28.85 mbsf and subsequently decrease to ~487 µM at 47.85 mbsf (Table
T10).
In summary, the pore water profiles from Site 1220 primarily reflect minor organic matter degradation and the dissolution of biogenic sil-ica. Most of the dissolved chemical constituents show a lack of gradient with depth and values similar to or slightly higher than seawater.
Solid-Phase Geochemistry
We collected bulk-sediment samples in every other section, adjacent to the interval sampled for physical properties (see “Physical
Proper-ties,” p. 13) at Site 1222, resulting in a sampling resolution of
approxi-mately three samples per core. The bulk inductively coupled plasma–
T10. Interstitial water data, p. 51.
540 555 570 0 10 20 30 40 50
Cl (mM)
Depth (mbsf)
2 3 4 Alkalinity (mM)
25 30 35 SO4 (mM)
0 5 10 NH4 (µM)
0 600 1200 H4SiO4 (µM)
0 30 60 Ca and Mg (mM)
5 10 15 0 10 20 30 40 50
K (mM)
Depth (mbsf)
0 0.75 1.5 Ba (µM)
0 25 50 Mn (µM)
400 500 600 B (µM)
25 27.5 30 Li (µM)
50 75 100 Sr (µM)
atomic emission spectroscopy data from Site 1222 is suspect because of excessively high levels of drift during the run. This resulted in very poor precision for most elements (e.g., Ba = 26%, Ca = 34%, Fe = 79%, Mn = 32%, Si = 22%, and Sr = 85%). For this reason, we do not report the data. The poor precision for Site 1222 data probably results from exces-sive ship motion during sample weighing and analyses (see
“Geochem-istry,” p. 20, in the “Explanatory Notes” chapter for more discussion).
Calcium carbonate (CaCO3) (in weight percent) was determined by coulometric methods for two to three samples per core from 2.24 to 64.63 mbsf for Site 1222 (Table T11; Fig. F14). CaCO3 is low (<1 wt%) in Unit I and is moderate in the nannofossil ooze of Unit II (40–67 wt%). Organic carbon (in weight percent) determined for one sample per core is uniformly low (<0.15 wt%).
PHYSICAL PROPERTIES
Physical properties at Site 1222 were measured on whole cores, split cores, and discrete samples. MST measurements (bulk density, MS, P -wave velocity, and natural gamma radiation) and thermal conductivity comprised the whole-core measurements. Compressional wave velocity measurements on split cores and moisture and density (MAD) analyses on discrete core samples were made at a frequency of one per undis-turbed section in Hole 1222A. Light absorption spectroscopy (LAS) analyses were performed on the MAD samples as well as an additional one sample per section (located ~50 cm from the MAD sample).
Density and Porosity
Two methods were used to evaluate the wet bulk density at Site 1222. Gamma ray attenuation (GRA) provided an estimate from whole cores. MAD samples gave a second, independent measure of wet bulk density, along with providing DBD, grain density, water content, and porosity from discrete samples (Table T12). The GRA and MAD wet bulk densi-ties are a close match throughout the interval of core recovery in Hole 1222A (Fig. F15), with the exception of the interval from 6.90 to 14.40 mbsf (Sections 199-1222A-2H-2 through 2H-6). This interval contains a recurrence of the electronic artifact in the MST data acquisition that first appeared at Site 1220. The displacement is not present in the Hole 1222B GRA record, and, as at Sites 1220 and 1221, the appearance of Sections 199-1222A-2H-2 through 2H-6 does differ from that of adja-cent sediments. Crossplots of wet bulk density and DBD vs. interpo-lated GRA bulk density, which exclude data from the sections in ques-tion, display an excellent correlation between the two bulk density measures (Fig. F16).
The wet bulk density at the top of lithologic Unit I (0–40.5 mbsf) is 1.27 g/cm3. As the clays that comprise the unit compact, wet bulk den-sity increases with depth, reaching a maximum of 1.46 g/cm3 at 31.15 mbsf. The downhole trend of increasing density is interrupted between 16.8 and 20.2 mbsf by an interval of low-density (1.23–1.27 g/cm3) dia-tom ooze (see “Unit I,” p. 4, in “Lithostratigraphy”). The small-scale variation in bulk density that accompanies alternating lithologies in Subunit IA is demonstrated by low density in diatom-rich sediments and higher density in clayey intervals in Core 199-1222A-3H (Fig. F17). A sharp decrease in wet bulk density to ~1.25 g/cm3 is present in the lowermost part of Subunit IA. The bulk density remains at this level,
av-T11. CaCO3 and Corg data, p. 52.
0 20406080 100 0 10 20 30 40 50 60 70 CaCO3 (wt%) Depth (mbsf)
F14. CaCO3 data, p. 31.
T12. Moisture and density mea-sures, p. 53.
0 50 100 60 80 Porosity (%) Depth (mbsf) A Water content (%) 1.2 1.6
Wet bulk density (g/cm3)
B
GRA bulk density (g/cm3)
2.4 2.8
Grain density (g/cm3)
C II IA IV III IB V Lithologicunit/sub u nit
F15. Moisture and density mea-surements, p. 32.
1.2 1.4 1.6
1.2 1.4 1.6 y = 0.369 + 0.717x R = 0.95
W
et b
ulk density (g/cm
3) A 0.2 0.4 0.6 0.8
1.2 1.4 1.6 y = -1.076 + 1.191x R = 0.95
Interpolated GRA density (g/cm3)
Dr
y b
u
lk density (g/cm
3)
B
eraging 1.24 g/cm3, in the radiolarian clay of Subunit IB (40.5–54.9 mbsf). Wet bulk density increases sharply to 1.40 g/cm3 at the top of Unit II (58.7–66.6 mbsf) and remains at roughly this level throughout the nannofossil ooze of this unit. A rapid decrease in bulk density to 1.20 g/cm3 marks the top of lithologic Unit III (58.7–66.6 mbsf), and wet bulk density averages 1.21 g/cm3 for the clays in this unit.
Grain density varies over a wide range (2.21–2.77 g/cm3) at Site 1222 as a result of the combination of different lithologies (Fig. F15). The grain density is roughly 2.60–2.65 g/cm3 at the top of Unit I, reflecting the predominance of clay. Higher grain densities, up to 2.77 g/cm3 at 2.25 mbsf, possibly reflect the presence of manganese oxide and other opaque sediment constituents (see “Unit I,” p. 4, in “Lithostratig-raphy”). Grain density decreases downhole to 2.30 g/cm3 at 21.65 mbsf in the clay below the diatom ooze in Subunit IA. Below 21.65 mbsf, grain density increases and is ~2.53 g/cm3 between 25 and 35 mbsf. The density is lower at the base of Subunit IA (2.36 g/cm3) in the transition to the radiolarian clay of Subunit IB. Grain density in Subunit IB ranges from 2.21 to 2.52 g/cm3, with the highest densities at the base of the unit. Grain density in the underlying nannofossil ooze of Unit II varies in a narrow range about an average of 2.65 g/cm3. Grain density de-creases in the Unit III clay, ranging from 2.45 to 2.63 g/cm3 and averag-ing 2.52 g/cm3.
Sediment porosity near the seafloor at Site 1222 is 85%. A downhole trend of decreasing porosity, to 69% at 31.15 mbsf, is interrupted by the high-porosity (85%) diatom ooze between 16.8 and 20.2 mbsf (Fig.
F15). Below 31.15 mbsf, porosity in the Unit I clays increases with depth to 84% at 39.15 mbsf. Most of Subunit IB has a porosity of ~86%. The porosity of the radiolarian clays decreases at the base of the unit in the transition to the lower-porosity (~75%) nannofossil ooze of Unit II. Porosity increases sharply to 88% at the top of Unit III and remains roughly at this level throughout the unit.
LAS
LAS studies were conducted on sediments from Hole 1222A at a fre-quency of two samples per undisturbed section (see Vanden Berg and
Jarrard, this volume, for a discussion of the LAS technique). Samples
were not collected below 66.2 mbsf because of poor core recovery. Semi-quantitative mineral concentrations were calculated from the collected spectra, assuming a four-component system: calcite, opal, smectite, and illite (Table T13).
Calcite is overestimated throughout Site 1222 because of the light-ness of the material (Fig. F18). The high concentrations of zeolites may be contributing to this light color. Overall, the clay intervals show high concentrations of smectite and illite and also correspond to areas of low opal. The illite–smectite transition is found in the upper 10 m of sedi-ment. The diatom ooze (~17 mbsf) shows a large drop in clay and an in-crease in opal as well as the radiolarian ooze of Subunit IB. The nanno-fossil ooze of Unit II is associated with the expected high calcite values (up to 80%). Postcruise work will involve a recalculation of these con-centrations using better quality standards. This should eliminate the overestimated calcite and the variability in the illite values.
3H-1 3H-2 3H-3 3H-4 3H-5 Mn nodule Magnetic susceptibility (10-6 SI)
GRA bulk density (g/cm3)
Velocity (m/s)
Natural gamma (cps)
0 255075 100 1.1 1.2 1.3 1.41500 1540 0 10 20 15 16 17 18 19 20 21 22 Depth (mbsf) Laminated diatom ooze Laminated diatom ooze Laminated diatom ooze
F17. Comparison of MS, GRA den-sity, velocity, and NGR with digi-tal core images, p. 34.
T13. LAS-based mineralogy, p. 54.
Depth (mbsf) 10 20 30 40 60 50 Nannofossil ooze Radiolarian clay Lam. diat. ooze Clay with Fe oxides
Lithology Lithologic unit/subunit Clay with zeolites 0 Clay with zeolites IA IB II III
0255075 100 0255075 100 0255075 100 0255075 100 Calcite (model wt%) Opal (model wt%) Smectite (model wt%) Illite (model wt%)
Compressional Wave Velocity
Compressional wave velocity was measured by the P-wave logger (PWL) on all whole cores from Holes 1222A and 1222B. The insertion and contact probe systems were used to measure velocities on split cores from Hole 1222A (Table T14). Agreement between PWL and split-core velocities is good, typically displaying offsets of <10 m/s (Fig. F19). The difference between the whole-core and split-core velocities is greater in the radiolarian clay between 50 and 52 mbsf, where contact probe velocities are ~30 m/s higher than the PWL velocities. This dis-parity in velocities in radiolarian clay and ooze is present at other Leg 199 sites and possibly results from dewatering of the radiolarian-rich sediment after core splitting.
Velocity varies with lithology at Site 1222 (Fig. F19). In the Subunit IA clay, transverse velocity is 1510 m/s near the seafloor and is at a max-imum of 1558 m/s in the diatom ooze at 20.11 mbsf. The velocity varia-tion that accompanies alternating lithologies in Subunit IA is displayed in the PWL record for Core 199-1222A-3H (Fig. F17), in which peaks in velocity correspond to layers of laminated diatom ooze and lower ve-locities are present in clay intervals. Velocity increases slightly with depth in Subunit IA and is ~1520 m/s at the base of the unit. In Subunit IB velocity is 1512 m/s at 40.66 mbsf and rapidly increases to 1563 m/s at 45.66 mbsf. Below this depth, velocity decreases downhole and is 1524 m/s at the base of the unit. Overall, the average velocity for the ra-diolarian clay of Subunit IB is 1543 m/s. The downhole decrease in ve-locity continues in the nannofossil ooze of Unit II. The average veve-locity for this unit is 1519 m/s. Velocity sharply increases to 1543 m/s at the top Unit III. It decreases with depth in the clay of Unit III to 1519 m/s at 66.16 mbsf, just above the base of the unit.
Velocity anisotropy was determined with the contact probe system to evaluate changes in fabric that might accompany sediment burial. The clays of Subunit IA are nearly isotropic with a range in anisotropy from 0.6% to 2.0% without a downhole trend, suggesting that little particle reorientation has occurred (Table T14).
Thermal Conductivity
Thermal conductivity was measured on the third section of all un-disturbed cores from Holes 1222A and 1222B (Table T15). Overall, the conductivity of sediments recovered at Site 1222 is low, ranging from 0.69 to 0.82 W/(m·K). Near the top of Subunit IA, thermal conductiv-ity is 0.72 W/(m·K) (Fig. F20). It increases downhole in the clay to 0.82 W/(m·K) at 28.16 m/s. This increase accompanies the downhole de-crease in porosity. Thermal conductivity dede-creases to 0.73 W/(m·K) near the base of Subunit IA as porosity increases in transition to the ra-diolarian clay of Subunit IB. The high-porosity rara-diolarian clay of Sub-unit IB has the lowest conductivity at Site 1222, averaging 0.71 W/ (m·K). Below the radiolarian clay, thermal conductivity increases to an average of 0.78 W/(m·K) in the nannofossil ooze of Unit II. As porosity increases in the clay of Unit III, thermal conductivity decreases to 0.71 W/(m·K) at 66.16 mbsf.
Natural Gamma Radiation
Natural gamma radiation was measured on all whole cores from Holes 1222A and 1222B (Fig. F21). The NGR values are as high as 137.1
T14. Split-core velocity measure-ments, p. 55.
0
50
100 1450 1500 15501600
Depth (mbsf) Velocity (m/s) Lithologicunit/sub unit II IB IA III IV V
F19. Compressional wave velocity, p. 36.
T15. Thermal conductivity, p. 56.
0
50
100 0.6 0.7 0.8 0.9
Thermal conductivity (W/[m·K]) Depth (mbsf) Lithologicunit/sub unit II IB IA III IV V
F20. Thermal conductivity, p. 37.
0
50
100 0 50 100 150
Depth (mbsf) Natural gamma (cps) Lithologicunit/sub unit II IB IA III IV V
counts per second (cps) at 1.0 mbsf before they decrease to an average of 19.8 cps for the rest of Subunit IA. Between 16.8 and 20.2 mbsf, nat-ural gamma radiation values decrease to an average of 8.0 cps in the in-terval of diatom-rich sediments. Within this inin-terval, thin layers of lam-inated diatom ooze are present, which record minima in NGR values (Fig. F17). In the upper radiolarian-rich part of Subunit IB (40.5–52.1 mbsf), NGR values decrease to an average of 5.4 cps. The lower section of Subunit IB (52.6–56.5 mbsf) records a rise in values to an average of 12.6 cps and correlates to an interval of more clay-rich sediments. Be-low 56.5 mbsf, NGR values decrease downcore to near background lev-els.
MS
Whole-core MS measurements were made on all cores from Holes 1222A and 1222B (Fig. F22) and correlate well with other physical prop-erty measurements. MS values in the upper section of Subunit IA (0.0– 16.8 mbsf) average 40 × 10–6 SI, followed by a decrease between 16.8 and 20.4 mbsf to an average of 24 × 10–6 SI. This low-susceptibility in-terval correlates with the zone of diatom-rich sediments. Within this interval, lower than average susceptibility (as low as 3 × 10⁻⁶ SI) corre-lates with thin layers of laminated diatom ooze (Fig. F17). The lower part of Subunit IA (20.4–40.5 mbsf) is characterized by a broad peak in susceptibility, with values as high as 202 × 10–6 SI at 31.5 mbsf. Between 40.5 and 52.1 mbsf in the radiolarian-rich interval of Subunit IB, sus-ceptibility decreases to an average of 45 × 10–6 SI before increasing again to an average of 73 × 10–6 SI in the clay-rich interval at the base of Sub-unit IB and the top of Unit II (52.1–56.5 mbsf) (see “Subunit IB,” p. 5,
and “Unit II,” p. 5, both in “Lithostratigraphy”). Between 56.5 and
59.9 mbsf, MS decreases to an of average 29 × 10–6 SI in the nannofossil ooze. The clay-rich Unit III and top of Unit IV mark an increase in sus-ceptibility to an average of 64 × 10–6 SI.
0
50
100 0 100 200
Depth (mbsf)
Magnetic susceptibility (10-6
SI) Lithologicunit/sub
unit
II
IB IA
III IV V
REFERENCES
Barber, R.T., 1992. Fall survey cruise finds cooling conditions in equatorial Pacific.
U.S. JGOFS News, 4:1–6.
Cande, S.C., LaBrecque, J.L., Larson, R.L., Pitmann, W.C., III, Golovchenko, X., and
Haxby, W.F., 1989.
Magnetic Lineations of the World’s Ocean Basins.
AAPG Map Ser.,
13.
Engebretson, D.C., Cox, A., and Gordon, R.G., 1985. Relative Motions Between Oceanic and Continental Plates in the Pacific Basin. Spec. Pap.—Geol. Soc. Am., 206.
Gripp, A.E., and Gordon, R.G., 1990. Current plate velocities relative to the hotspots incorporating the NUVEL-1 global plate motion model. Geophys. Res. Lett.,
17:1109–1112.
Kemp, A.E.S., Baldauf, J.G., and Pearce, RB, 1995. Origins and paleoceanographic sig-nificance of laminated diatom ooze from the eastern equatorial Pacific Ocean. In
Pisias, N.G., Mayer, L.A., Janecek, T.R., Palmer-Julson, A., and van Andel, T.H. (Eds.), Proc. ODP, Sci. Results, 138: College Station, TX (Ocean Drilling Program), 641–645.
Lyle, M., 2000. Data submission to ODP Pollution Prevention and Safety Panel: proposed
drill sites for ODP Leg 198—a Paleogene equatorial APC transect.
BSU-CGISS Tech
Rept.,
2000-03.
Sanfilippo, A., and Nigrini, C., 1996. Radiolarian biomarkers at the Oligocene/Mio-cene boundary. In Moguilevsky, A., Watley, R. (Eds.), Microfossils and Oceanic Envi-ronments: Proc. ODP and the Mar. Biosphere Int. Conf.: Aberystwyth, Wales (Univ. Wales, Aberystwyth Press), 317–326.
Sanfilippo, A., and Nigrini, C., 1998. Code numbers for Cenozoic low latitude radio-larian biostratigraphic zones and GPTS conversion tables. Mar. Micropaleontol.,
33:109–156.
Shackleton, N.J., Baldauf, J.G., Flores, J.-A., Iwai, M., Moore, T.C., Jr., Raffi, I., and Vincent, E., 1995. Biostratigraphic summary for Leg 138. In Pisias, N.G., Mayer, L.A., Janecek, T.R., Palmer-Julson, A., and van Andel, T.H. (Eds.), Proc. ODP, Sci. Results, 138: College Station, TX (Ocean Drilling Program), 517–536.
van Andel, T.H., Heath, G.R., and Moore, T.C., Jr., 1975. Cenozoic History and Pale-oceanography of the Central Equatorial Pacific Ocean: A Regional Synthesis of Deep Sea Drilling Project Data. Mem.—Geol. Soc. Am., 143.
Figure F1. Location of Site 1222 in the Leg 199 transect. In the lower panel, gray shading = seafloor depths >5000 mbsl, red shading = approximate position of the nominal target crust of the 56-Ma transect.
160°W 150° 140° 130°
0° 10° 20° 30° N
0 500 1000
Site 1215
Site 1216
Site 1217
Site 1218 Site 1219
Site 1220 Site 1221 Site 1222
Site 40
Site 42 Site 43
Site 69 Site 70
Site 71
Site 72
Site 160 Site 161
Site 162
Site 163
Site 573 Site 574
Site 575 Honolulu
Molokai F.Z.
Clipperton F .Z.
Clarion F.Z.
Site 1216
Site 1217
Site 1218 Site 1222
Site 1221
Site 1220 Site 1215
Molokai Fracture Zone
Clarion Fracture Zone
Mahi Mahi Fracture Zone
Site 1219
Clipperton Fracture Zone
574
573 575 161
162
163
40
42 43
70
71
72
0° 10° 20°
5° 15° 25° N
150°W 145° 140° 135°
km
Figure F2. Seismic reflection profile through Site 1222. The sedimentary section is marked by a weakly re-flective unit between the seafloor and ~62 ms two-way traveltime (TWT) below the seafloor, assumed to be clays. The next two prominent reflectors (~120 and 147 ms TWT mbsf) are interpreted to mark chert layers at the contact between middle and lower Eocene sediments and basement, respectively (see Lyle et al., this volume).
PAT12-Line 6
Bandpass 3 km
W
EW9709-18GC
X Line 3 E
Site 1222
6600
6700
6800
6900
7000 6500
7100
7200
Basement P2? P3?
T
w
o-w
a
y
tr
a
v
eltime (ms)
Hour
Figure F3. Lithologic summary for Site 1222. Note that lithologic units are based upon Hole 1222A recov-ery. LAS = light absorption spectroscopy, TD = total depth.
Core
Depth (mbsf)
Recovery Core Recovery Hole 1222A Hole 1222B 10 20 30 40 60 70 80 90 50 100 SITE 1222
Magnetic susceptibility (10
-6
SI )
Bulk density (g/cm
3)
Magnetic stratigraphy
Color reflectance ( L*) Calcite (model wt%) Illite (model wt%) Smectite (model wt%) Opal (model wt%)
Lithology Lithologic unit/subunit Age
Physical
properties LAS Mineralogy
Zone
Planktonic foraminifers Calcareous nannofossils Radiolarians
1H 1H 2H 3H 4H 5H 6H 7H 2H 3H 4H 5H 6H 7H 8H 9X 10X 11X 12X TD 107.3 mbsf TD 64.4 mbsf V IV III II IB IA Basalt Chert Radiolarian clay with increasing clay content
50 150 1.2 1.4 30 50
Nannofossil ooze Clay with Fe oxides Clay with zeolites Laminated diatom ooze Pliocene Miocene Oligocene Eocene early late early middle early late CP17 CP16c/ a+b? Chalk on chert, 12X-CC CP9a Barren Barren Barren Barren RN10 RN9 RP22 RP21 RP20 RP 18/19 RP15 RN11 RN12 Massive reworking ? C6Cn C7n C7An C8n C9n C10n C12n ? 20 60
Figure F4. Close-up digital photograph of laminated diatom ooze (interval 199-1222A-3H-4, 50–100 cm; Unit I).
199-1222A-3H-4 cm
70
80
Figure F5. Calcareous and siliceous biostratigraphy for Site 1222. Horizontal dashed lines indicate that a boundary can only be approximated by available biostratigraphy. TD = total depth.
Core
Depth (mbsf)
Recovery Core Recovery
Hole 1222A
10
20
30
40
60
70
80
90
110 50
100
1H 1H
2H
3H
4H
5H
6H
7H 2H
3H
4H
5H
6H
7H
8H
9X
10X
11X
12X
TD 107.3 mbsf
TD 64.4 mbsf
Oligocene
Miocene
Pliocene
early
middle
late
Calcareous nannofossils Radiolarians
early
Barren
Chalk on chert, 12X-CC: CP9a (NP10) Series
Barren
RP22 RN12
?
CP17
CP16c /a+b?
RN10
RN9
RP20
RP15 RP18/19
RP21
late
early
Hole 1222B
Barren
Massive reworking Planktonic foraminifers
Barren RN11
Eocene
Figure F6. Archive-half magnetization intensities after AF demagnetization at a peak field of 20 mT for Holes 1222A and 1222B. Open circles = Hole 1222A, solid circles = Hole 1222B.
Depth (mcd)
Intensity (A/m)
0
20
40
60
80
10-3 10-2 10-1
10-4
10
30
50
Figure F7. Composite magnetic stratigraphy at Site 1222. Virtual geomagnetic pole (VGP) latitudes were obtained after partial AF demagnetization of continuous measurements at a peak field of 20 mT. Polarity column shows interpreted zones of normal (black) and reversed (white) magnetization.
C6Cn
C7n C7An
C8n
C9n
C10n
C12n ?
-100 -50 0 50 100
0
10
20
30
40
50
60
70
80
VGP latitude (
°
)
Depth (mcd)
P
olar
ity
Figure F8. Gamma ray attenuation (GRA) bulk density, magnetic susceptibility, and color reflectance (L*) data for Holes 1222A (black; left curve in each panel) and 1222B (blue; right curve in each panel) plotted vs. composite depth. The data from Holes 1222B are offset by constants for illustration purposes. All data sets are smoothed with a nine-point Gaussian filter. Intervals with obvious flow-in or drilling disturbance are removed from the data sets (see Table T4, p. 45).
1.1 1.3 1.4 1.6 1.8 0
20
40
60
80
GRA bulk density
Depth (mcd)
(g/cm
3)
0 100 200
Magnetic susceptibility
(10
-6SI)
20 40 60 80
Figure F9. Spliced records of gamma ray attenuation (GRA) bulk density, magnetic susceptibility and the color reflectance parameter (L*) for Site 1222. Lithology changes are clearly visible just above ~70 mcd, where a more carbonate rich interval displays higher GRA bulk density and lower magnetic susceptibility values. The large jump in GRA bulk density observed at ~6 mcd is attributed to be an instrumental elec-tronic artifact that was previously observed in Sites 1220 and 1221 GRA records.
1.1 1.3 1.4 1.6 1.8 0
20
40
60
80
Depth (mcd)
GRA bulk density
(g/cm
3)
0 80 160
Magnetic susceptibility
(10
-6SI)
20 40 60 80
Figure F10. LSRs and chronostratigraphic markers for Site 1222.
0
20
40
60
80
100
0 10 20 30 40 50 60
Depth (mcd)
Age (Ma)
Nannofossils
Radiolarians
Foraminifers
Paleomagnetic reversal 5.5 m/m.y.
1.34 m/m.y.
0.50 m/m.y.
3.79 m/m.y.
6.0 m/m.y.
2.59 m/m.y.
1.75 m/m.y.
Figure F11. Density record of site survey piston Core EW9709-14P (red) compared to density record of Site 1222 (blue).
1.1 1.2 1.3 1.4 1.5 1.6 1.7
1.1 1.2 1.3 1.4 1.5 1.6 1.7 1.8
0
10
20
30
40
50
60
70
EW9709-14P
Site 1222
Site 1222 density (g/cm
3)
EW9709-14P density (g/cm
3)
Figure F12. Mass accumulation rates (MARs) of sediments from Site 1222.
0
10
20
30
40
50
60
0 50 100 150 200 250 300 350
Age (Ma)
MAR (mg/cm
2/k.y.)
Lithologic Subunit IA
Lithologic Subunit IB
Figure F13. Interstitial water data from Site 1222. Solid circles = Ca, crosses = Mg.
540 555 570 0
10
20
30
40
50
Cl (mM)
Depth (mbsf)
2 3 4
Alkalinity (mM)
25 30 35
SO4 (mM)
0 5 10
NH4 (µM)
0 600 1200 H4SiO4 (µM)
0 30 60
Ca and Mg (mM)
5 10 15
0
10
20
30
40
50
K (mM)
Depth (mbsf)
0 0.75 1.5 Ba (µM)
0 25 50
Mn (µM)
400 500 600 B (µM)
25 27.5 30
Li (µM)
50 75 100
Figure F14. CaCO3 data, determined by coulometric methods, from Site 1222.
0 20 40 60 80 100
0
10
20
30
40
50
60
70
CaCO
3(wt%)
Figure F15. Moisture and density measurements for Hole 1222A. A. Porosity (solid symbols) and water con-tent (open symbols). B. Discrete-sample wet bulk density (open symbols) and gamma ray attenuation (GRA) bulk density (line). C. Grain density. Lithologic Units I–V are noted on the right side of the figure.
0
50
100
60 80
Porosity
(%)
Depth (mbsf)
A
Water content
(%)
1.2 1.6
Wet bulk density
(g/cm
3)
B
GRA bulk density
(g/cm
3)
2.4 2.8
Grain density
(g/cm
3)
C
II IA
IV III IB
V
Lithologic
unit/sub
Figure F16. (A) Wet and (B) dry bulk density from discrete samples from Hole 1222A plotted with gamma ray attenuation (GRA) bulk density interpolated with a 20-cm-wide Gaussian window. GRA bulk densities from Sections 199-1222A-2H-2 through 2H-6, which appear to be offset by an electronic artifact in MST data acquisition, are not included in the comparison.
1.2 1.4 1.6
1.2 1.4 1.6
y = 0.369 + 0.717x R = 0.95
W
et b
ulk density (g/cm
3
)
A
0.2 0.4 0.6 0.8
1.2 1.4 1.6
y = -1.076 + 1.191x R = 0.95
Interpolated GRA density (g/cm
3)
Dr
y b
ulk density (g/cm
3
)
Figure F17. Comparison of magnetic susceptibility, gamma ray attenuation (GRA) bulk density, velocity, and natural gamma radiation with the digital core images from the diatom-rich Sections 199-1222A-3H-1 through 3H-5. cps = counts per second.
3H-1
3H-2
3H-3
3H-4
3H-5 Mn nodule
Magnetic susceptibility
(10
-6SI)
GRA bulk density
(g/cm
3)
Velocity
(m/s)
Natural gamma
(cps)
0 25 50 75 100 1.1 1.2 1.3 1.4 1500 1540 0 10 20
15
16
17
18
19
20
21
22
Depth (mbsf)
Laminated diatom ooze
Laminated diatom ooze
Figure F18. LAS mineralogy determinations for Hole 1222A. Lithologic Units I–III are noted to the left of the figure. Lam. diat. ooze = laminated diatom ooze.
Depth (mbsf)
10
20
30
40
60 50
Nannofossil ooze Radiolarian clay Lam.
diat. ooze
Clay with Fe oxides Lithology Lithologic unit/subunit
Clay with zeolites 0
Clay with zeolites
IA
IB
II
III
0 25 50 75 100 0 25 50 75 100 0 25 50 75 100 0 25 50 75 100
Calcite (model wt%)
Opal (model wt%)
Smectite (model wt%)
Figure F19. Compressional wave velocity from the PWL (line) and transverse velocity measured with the insertion (squares) and contact probe (circles) systems for Hole 1222A. Lithologic Units I–V are noted on the right side of the figure.
0
50
100
1450 1500 1550 1600
Depth (mbsf)
Velocity
(m/s)
Lithologic
unit/sub
unit
II
IB
IA
III
IV
Figure F20. Thermal conductivity for Holes 1222A (solid symbols) and 1222B (open symbols). Lithologic Units I–V are noted on the right side of the figure.
0
50
100
0.6 0.7 0.8 0.9
Thermal conductivity
(W/[m·K])
Depth (mbsf)
Lithologic
unit/sub
unit
II
IB
IA
III
IV
Figure F21. Natural gamma radiation for Hole 1222A. Lithologic Units I–V are noted on the right side of the figure. cps = counts per second.
0
50
100
0 50 100 150
Depth (mbsf)
Natural gamma
(cps)
Lithologic
unit/sub
unit
II
IB
IA
III
IV
Figure F22. Magnetic susceptibility for Hole 1222A. Lithologic Units I–V are noted on the right side of the figure.
0
50
100
0 100 200
Depth (mbsf)
Magnetic susceptibility
(10
-6SI)
Lithologic
unit/sub
unit
II
IB
IA
III
IV
Table T1. Coring summary, Site 1222.
Note: The expanded coring summary table is available in ASCII (see the “Supplementary Material” contents list).
Hole 1222A
Latitude: 13°48.9780′N Longitude: 143°53.3477′W
Time on site (hr): 57