marized in Table I, while the minimum and maximum required average transmitted powers in the cell for the different modes are given in Table V. Given the video bitrates of 4.25–16.9 kbps in the various modem modes, the corresponding average video peak signal-to-noise ratio (PSNR) improvement of approximately 6 dB can be inferred from Fig. 1, where the corresponding PSNR values are approximately 32.5, 35, and 38.5 dB, respectively. This PSNR improvement is achievable in cell areas, where the average transmitted power levels of Table V can be maintained, supporting one of the above legitimate modes of operation of the multimode transceiver.
Index Terms— Error-rate-based transmission power control,
H.263 base video communications, interactive wireless video, QAM-based video communications, transmission power control for multimode modems, video communications in interference-limited environments, video transceivers.
I. MOTIVATION
T
HE MATURE voice- and data-oriented second-generation standard mobile radio systems such as, for example, the global system of mobile communications (GSM) [32], have not been contrived to support interactive videophony. Nonetheless, with the advent of the specially designed error-resilient fixed-rate video codecs of [1] it is possible to provide low-resolution videophone services over these low-rate constant Baud-rate schemes.1 By contrast, the existing standard video codecs, such as the motion pictures expert group codecs (MPEG1) [2] and MPEG2 [3] or the International Telecommunications Union (ITU) H.263 codec [4] were designed for benign low error-rate Gaussian wire-line links, where error-sensitive but high-compression variable-length coding techniques can be invoked. In these standard codecs, the time-variant video motion activity and the variable-length coding techniques employed result in a time-variant bitrate fluctuation and a near-constant perceptual video quality. A range of associated video compression aspects were documented for example in recent excellent special issues [5]–[8].Manuscript received May 8, 1997; revised February 25, 1998. This work was supported by the Mobile Virtual Centre of Excellence, U.K.
The authors are with the Department of Electrical and Computer Science, University of Southampton, SO17 1BJ, U.K.
Publisher Item Identifier S 0018-9545(99)07388-0.
1A range of video sequences encoded at various bitrates between 6.7
and 13 kbps can be viewed under the worldwide web address http://www-mobile.ecs.soton.ac.uk.
langen University, Germany [10], [11], Pelz, Bosch, Germany [13], Ngan, Australia [12], Gharavi, Loughborough University, U.K., etc. endeavoured to design appropriate transceivers to overcome the H.263 scheme’s inherent limitations and to facilitate interactive videophony using this bandwidth-efficient codec [9]–[13].
In our previous work [16], we contrived an adaptive packe-tization and rate-control scheme, which allowed us to maintain a fixed target bitrate at the cost of a time-variant video quality as in the codecs of [1]. This fixed-rate packetizer was now capable of supporting fixed-rate transmissions, but the codec’s high-channel error sensitivity persisted due to the high-compression variable-length coding techniques. Hence, we incorporated a binary feedback acknowledgment flag in to our transmission regime, which facilitates for the local and remote reconstruction buffers to remain in synchronous rela-tionship having the same contents—an issue to be elaborated on at a later stage.
Explicitly, in order to support wireless multimedia services before the arrival of the long-awaited MPEG4 codec standard [8], either error-resilient fixed-rate proprietory video codecs [1] have to be employed or a rate control and acknowledgment regime, similar to the adaptive packetization and recoding scheme of [16] must be invoked. This bitrate control scheme can instruct the H.263 codec to reencode a video frame using a more coarse quantizer if the number of bits generated sig-nificantly exceeds the “payload-capacity” of the transmission packet used by the current modem mode. This scheme will be highlighted in more depth in Section II.
Focusing briefly on the developments in the field of trans-mission issues, at the time of writing the wireless com-munications community is working toward the definition of the third-generation multimedia personal communications net-work (PCN), which is referred to as a personal commu-nications system (PCS) in North America. The European community’s research in advanced communications equipment (RACE) program [14] and the follow-up framework referred to as advanced communications technologies and services (ACTS) program [15], [18] spearheaded these initiatives. At the time of writing, four third-generation standardization proposals have been submitted to the European Telecom-munications Standardization Institute (ETSI) [19]: wide-band code-division multiple access (CDMA) [20]–[22], adaptive
time-division multiple access (TDMA) [23] (ATDMA), hybrid TDMA/CDMA [24], orthogonal frequency division multiplex (OFDM) [17], [25] and opportunity-driven multiple access (ODMA). We note that the Nokia testbed portrayed in [22] was designed with video transmission capabilities up to 128 kbps in mind. Similarly, cognizance was given to the aspects of less bandwidth constrained, i.e., higher rate video communications by the Japanese wide-band CDMA proposal [26] for the Intelligent Mobile Terminal IMT 2000 emerging from NTT DoCoMo. These standardization activities are portrayed in more depth in [19].
Motivated by these worldwide trends, in this contribution we set out to contrive an H.263-based [4] pilot symbol assisted intelligent multimode transceiver [17], which can adapt to time-variant system optimization criteria under a variety of propagation conditions. The philosophy of our trans-ceiver is congenial to the so-called toolbox-based software radios [27], where the base-band toolbox algorithms can be invoked on a time-variant basis in order to accommodate the time-variant channel conditions experienced. These long-term reconfigurable transceiver features were detailed in [16], hence, here only a brief system summary will be provided in the next section with reference to Tables I and II. We note, however, that the system proposed in [16] dispensed with using power control and relied purely on varying the number of modulation levels as a means of adapting to time-variant channel conditions. Burst-by-burst adaptive modems, which support dynamically varied short-term reconfiguration, were researched, for example, by Sampei et al. [28], [29] and Goldsmith et al. [30], [31].
By contrast, in this treatise we propose an intelligent, bit-error-rate (BER), BER gradient, and frame-bit-error-rate (FER)-based power-control technique, which, in conjunction with the proposed power-control algorithm of Fig. 6 and Table IV, can maintain the target transmission FER required by the video source codec for its near-unimpaired operation, irrespective of the modem’s instantaneous mode of operation. Owing to the packet acknowledgment and corrupted packet dropping tech-nique used the high-compression, but error-sensitive H.263 video codec experiences no transmission errors and, hence, it is rendered amenable to wireless videophony.
The outline of the paper is as follows. Section II summarizes the video transceiver features leading to the main topic of this contribution—the power-control algorithm proposed in Section III. The power-control performance is characterized in Section IV and its effect on the transceiver’s power consump-tion and interference performance is discussed in Secconsump-tions V and VI, respectively.
II. VIDEO TRANSCEIVER
The proposed video transceiver is based on the H.263 video codec [4]. The video coded bit stream was protected by binary Bose–Chaudhuri–Hocquenghem (BCH) coding [32] combined with an intelligent multimode pilot symbol-assisted (PSA) quadrature amplitude modulation (QAM) modem [17], which can be configured under network control to operate as a 1, 2, and 4 bits/symbol scheme, while maintaining a constant
TABLE I
GENERICSYSTEMFEATURES OF THE200-kHz BANDWIDTH RECONFIGURABLEMULTIMODETRANSCEIVERSUPPORTING
9 QCIF-RESOLUTIONVIDEO+SPEECHUSERS
TABLE II
OPERATIONAL-MODESPECIFICTRANSCEIVERPARAMETERS
Fig. 1. Image quality peak signal-to-noise ratio (PSNR) versus coded bitrate performance of the H.263 codec for the “Miss America” sequence in color and grey scale at 10 and 30 frames/s.
signaling rate. This allows our system to ensure a constant 200-kHz bandwidth operation, providing a backward compati-ble evolutionary path for future intelligent multimode systems, which may replace, for example, the GSM communications [32], which also has a 200-kHz TDMA channel bandwidth. Here, we refrain from detailing the modulation and forward-error correction (FEC) aspects of our system due to lack of space and simply summarize the generic system features in Table I and the operational mode specific parameters in Table II. Let us now concentrate on the important issues of bit-rate control, supporting the constant bandwidth operation of the transceiver.
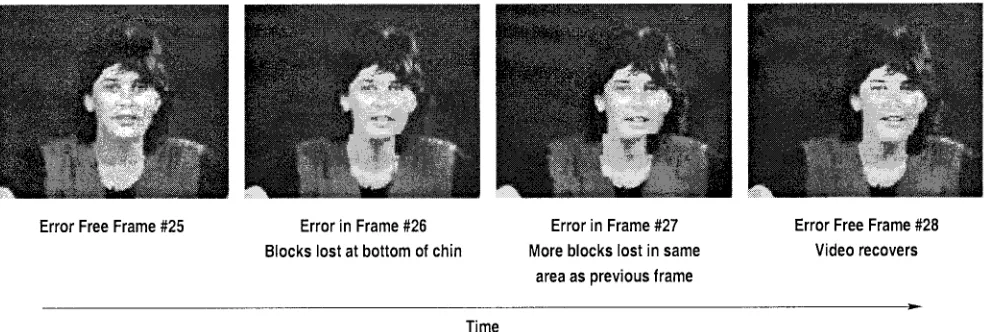
Fig. 2. Typical expected video quality of the proposed power-controlled video transceiver in its 16QAM mode for an frame error rate (FER) (or packet dropping rate) of 5%. This figure also shows the error recovery and concealment used in frames 26 and 27.
variant. However, most existing mobile radio systems transmit at a fixed bitrate. Our proposed multimode system maintains a constant signaling rate or symbol rate leading to a different constant video bitrate for each of the modulation schemes invoked (which are listed in Table II). Furthermore, we note that due to the H.263 scheme’s variable-length coding all bits are equally vulnerable to transmission errors. Hence, a single-class FEC scheme was employed for the 2QAM and 4QAM schemes, while in the 16QAM arrangement, the modem exhibited two different integrity subclasses (C1 and C2 [17]), but their integrity difference was equalized using two different FEC codes, as seen in Table II.
The corresponding objective video quality expressed in peak signal-to-noise ratio (PSNR) versus bitrate performance of the video codec was quantified in Fig. 1 and the portrayed relationship plays an important role in the codecs’ bitrate control. For our experiments the ITU’s 176 144 pixel quarter common intermediate format (QCIF) was employed in the 8.55-kbps/16.9-kbps 4QAM/16QAM modes, while the 128 96 pixel sub-QCIF (SQCIF) was invoked in the 4.25-kbps 2QAM mode, using the Miss America (MA) video clip. These graphs suggest that at a given bitrate, the grey scale and color PSNR performances are rather similar, with the grey-scale video PSNR being slightly higher. This is because color coding requires the allocation of some bits for conveying the color information. Note furthermore that the PSNR difference becomes slightly more dominant with increasing bitrates. The low PSNR difference between the grey and color scenarios suggests that assuming a constant bitrate, only a small fraction of the overall bitrate has to be allocated to convey the color information and, therefore, the PSNR penalty due to reducing the bitrate and fidelity of the luminance component is minimal. Observe in the figure the near-linear PSNR versus bitrate relationship when using logarithmic axes. The QCIF video PSNR’s associated with the supported video rates of 4.25, 8.55, and 16.9 kbps can be inferred from Fig. 1, which are around 32.5, 35, and 38.5 dB, respectively, as also seen in Table II.
The bitrate control algorithm modifies the quantizer in the H.263 video codec in order to maintain the required
Fig. 3. Image quality (PSNR) versus video frame index (or time), showing the effect of packet loss between frames 25 and 28, as shown in Fig. 2.
target bitrate, which can be accommodated by the current modem mode at the stipulated fixed signaling rate. In these investigations a fixed framerate of 10 frames/s was employed. The packetizer proposed in [16] supported the system’s robust operation by allowing the codec to drop corrupted video packets upto dropping rates of about 5% without significantly impairing the perceived video quality [16]. If this packet dropping rate is not exceeded, the video quality degradation is not objectionable and unupdated video frame areas are updated in consecutive frames, curtailing artifacts.
[image:3.612.322.539.277.441.2]Fig. 4. Average image quality (PSNR) versus transmission frame-error rate for a range of video sequence and modulation modes.
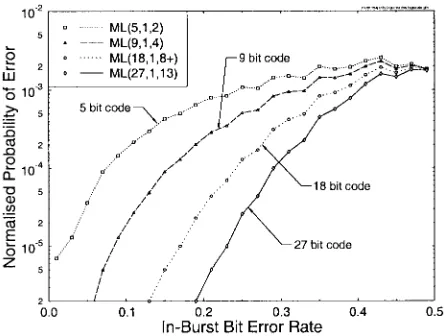
Fig. 5. Numerical evaluation of probability of error in majority logic codes, normalized by the chance of occurrence of the given in-burst BER.
sequences and for arbitrary FER’s, as long as the frame errors are separated by at least one error-free frame. These claims are also corroborated by Fig. 3, which portrays the corresponding PSNR versus frame index performance, indicating the isolated error event of Fig. 2, where the PSNR curve temporarily caves in at frame 26 when the indicated error occurs. Again, the salient system aspects can be inferred from Table I.
In order to demonstrate the video quality degradation in-flicted by transmission frame errors, Fig. 4 shows the effect of different FER’s for various video sequences and modulation modes, including all three modes of operation for the “Miss America” video sequence. Results for the 4QAM mode are also shown for the “Salesman” and “Suzie” video sequences, demonstrating that the PSNR versus FER performance is similar for all three video sequences.
The vitally important one-bit video packet acknowledgment flag is always transmitted strongly error protected and super-imposed on the reverse-direction time-division duplex (TDD) video packet. Hence, it has a delay of one TDD frame duration or 20 ms. In order to strongly protect the one-bit video packet acknowledgment flag we invoked a majority logic (ML) code, which was the strongest available code for the one-bit binary
flag to be transmitted. The maximum in-burst BER the code can cope with can be close to the 50% limit. For example, the ML(31,1,15) code, encoding the flag by repeating it 31 times can correct up to 15 bit errors, i.e., it can cope with an in-burst BER of upto 48.4%. This is much better than the correction capability of the identical-length BCH(31,6,7) code. In order to identify the required coding power and the expected FBER performance, for our system, the histogram of in-burst bit error rates was calculated for our system described in Table I. Since the system experienced both Rayleigh fast fading and shadow fading, very high in-burst BER’s can be encountered. The probability of a majority logic code in error was normalized by the probability of occurrence of the given in-burst BER, which is shown in Fig. 5. In order to ensure virtually error-free feedbacks, we opted for the ML(27,1,13) code in our system. Let us now consider the proposed power-control algorithm.
III. POWER CONTROL
In recent years, there has been a great deal of research in the field of transmission power-control algorithms. Much has resulted from the need for accurate power control in code division multiple access (CDMA)-based mobile radio systems. However, there has also been a substantial amount of research into using power control to reduce the transmitted power requirements and cochannel interference in TDMA systems. Some articles of particular interest are those due, for example, to Zander [33], [34] Zorzi [35], Leung [36], Ariyavisitakul et
al. [37], Pichna et al. [38] and Lee et al. [39]. A power-control
algorithm needs an accurate and recent estimation of the radio channel’s quality. The systems that rely on the received signal strength indicator (RSSI) to measure channel quality have to tolerate that the accuracy of the channel estimation is reduced in an interference-limited environment. Various techniques to reduce this inaccuracy have been suggested, in particular, an averaging technique by Austin and St¨uber [40]. Error-rate-based power-control schemes give a reliable channel-quality estimation, but have some limitations. An attractive power-control algorithm based on a combination of BER and RSSI estimates was proposed by Chuang and Sollenberger [41]. Also, Kumar et al. [42] suggested a BER-oriented power-control algorithm. Following a literature survey, we concluded that the BER-based power-control policy was attractive, but for our video transceiver, a more sophisticated variable-stepsize BER gradient-oriented power-control algorithm was required, which was also capable of supporting multimode constant FER video transmissions.
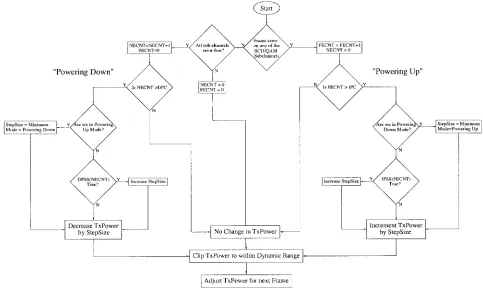
[image:4.612.58.280.270.438.2]Fig. 6. Flow-chart of the BER-based up-link power-control algorithm, using the variables of Table IV, which are invoked by the MS.
packet, which is associated with a delayed indication of the channel quality. If this delay is too high, the frame error flag may be of little use. This delay is one of the disadvantages of BER-based techniques in comparison to systems that use an RSSI reading carried out by the receiver in order to set the transmission power. However, RSSI-based channel quality estimates are often misleading due to high levels of cochannel interference.
In our forthcoming discourse, we first highlight the rationale behind the proposed power-control algorithm and then formal-ize its description by providing the flow-chart of it, albeit due to space limitations, we refrain from detailing the optimization of its parameters. The true number of bit errors in a trans-mission burst is only known to the receiver, if the channel coding used has not become overloaded by too many errors. This is true for both convolutional and block codes, although convolutional codes are oblivious of being overloaded, while block codes are capable of detecting these events. Hence, block codes are more attractive in this application. Clearly, when the channel coding is overloaded, a frame error is resulted. For example, in the 2QAM and 4QAM modes of Table II we used the binary Bose–Chaudhuri–Hocquenghem BCH(255,171,11) forward error correction (FEC) coding, correcting up to errors and if the number of errors is higher than , then a frame error occurs. Note, however, that the algorithm is generic, irrespective of the FEC code used, as long as the FEC code has a sufficiently reliable error detection capability, an issue that was treated in depth, for example, in [32, ch. 4]. In addition to the repetition-coded one-bit frame error flag (issues of which will be discussed later), our algorithm uses the
parameters of Fig. 6 and Table IV, including the actual number of errors corrected by the channel coding as an additional indicator of channel quality. If the number of errors in the BCH-coded frame is zero the channel is considered good and reducing the transmission power should be considered. By contrast, if the number of errors in the frame is higher than the correcting capability of the FEC code, then a frame error has occurred and increasing the transmission power should be of urgent consideration. However, if the number of errors contained in the BCH-coded frame is correctable by the FEC, there are three possible situations that should be considered. First, if the number of errors is near to the error correction capability of the code where a frame error would occur or the number of errors in successive frames has been increasing, then the transmission power should be increased. Second, if the number of errors in the frame is low and has been reducing in previous frames, then the power should be reduced. Finally, when the frame is not error-free, but the errors are correctable by the FEC, it is logical to keep the transmission power constant.
TABLE III
POWER-CONTROLALGORITHM’SFEATURES
TABLE IV
POWER-CONTROLALGORITHMPARAMETERS
power of 1 W with a dynamic range of 64 dB, as in GSM [32].
The simplified flow chart of the power-control algorithm is shown in Fig. 6, which will be briefly highlighted below. In contrast to previous proposals, our algorithm has a set of variable parameters that can be modified to accommodate varying channel conditions, modulation schemes or other factors. These parameters are summarized in Table IV. Before transmitting a burst, the receiver infers from the received video packet the number of bit errors corrected or whether the last frame was errorneously received. If there was a frame error or the number of errors was close to causing a frame error, the frame error counter was incremented. Explicitly, if the number of bit errors in a BCH-coded frame was close to the FEC overload condition, which in the 2QAM and 4QAM modes was , this event was considered a “near frame error” (NFE) condition, as seen in Table IV. The parameter “frame error count” registered the number of frame errors that have occurred in successive frames. When the “frame error count” is incremented, the “no error counter” (NEC) is reset, where
the NEC was defined as the number of consecutive error-free frames received in a row.
When a received video packet did not contain any errors even before FEC was invoked, then the NEC was incremented, while the FEC was reset. The transmission bursts received with a low number of errors constituting a low proportion of the FEC code’s error correction capability, were classified as error free, where the corresponding near-error-free threshold of Table IV was a further optimized algorithmic parameter.
If the previous transmission burst was received with errors, which were corrected by the channel coding, but the number of errors was lower than what would be considered as an NFE, although higher than that, which would be classed as a near-error-free frame, then the FEC and NEC are reset and the transmission power is left unchanged.
Following a number of successive frame errors, the MS decides to increase the transmission power. The number of erroneous frames, “inc power count” in Table IV, which is required to initiate power boosting, is another optimized pa-rameter of the algorithm. Upon powering up, the MS initially starts increasing the power by the smallest stepsize. However, if frame errors continue to occur, the stepsize is increased. The stepsize increase is a function of the FEC value, and this function, which we refer to as “inc power step size” in Table IV is a further optimized parameter of the algorithm.
When the MS is informed by the error rate feedback channel that the last frames have been received error-free, the handset decreases the transmission power. The number of error-free frames, “decpowcount” in Table IV, encountered before the handset powers down is yet another optimized parameter of the algorithm. As with powering up, the initial reduction of power is carried out using the smallest stepsize. If, however, after powering down the next few frames are still error-free, then the reduction stepsize is increased. The stepsize increment is governed by the function “decpowerstepsize” of Table IV, which is dependent on the the number of successive error-free frames received. This function is also a fundamental optimized parameter of the algorithm. Furthermore, we note that the absolute dynamic range of the algorithm is limited by the maximum transmission power of 30 dBm and by the 64-dB dynamic range of the algorithm. In summary, the parameters that govern the behavior of the power-control algorithm are shown in Table IV, while its operation is summarized in the flow chart of Fig. 6. Further details of its inner workings can be inferred by referring to the flow-chart. In the next section, let us now briefly characterize the performance of the power-control algorithm.
IV. PERFORMANCE OFMULTIMODEPOWERCONTROL
Fig. 7. FER with no power control versus user and interferer distance from base station (BS) for the 4QAM mode of operation.
Fig. 8. Various example waveforms associated with the 2QAM mode of the error-rate-based power-control algorithm. (a) Best case situation when both interfer and user are close to their BS. (b) Worst case situation, when both interfer and user are at the edge of their cell.
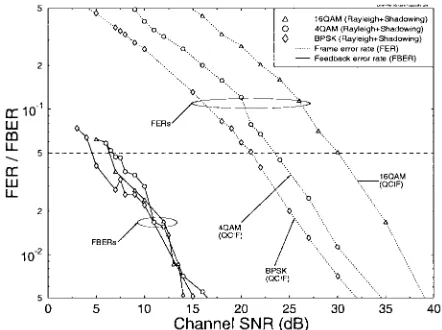
perceptual video quality at a transmission FER of 5%, it was programmed to operate at this FER. Nonetheless, the system is sufficiently flexible to operate at any arbitrary FER. Decreasing the tolerable FER requires, however, an increased transmitted power or channel SNR and vice versa, as evidenced by Fig. 9, portraying the FER versus channel SNR performance for the various modes of operation shown in Table I. The figure also shows the feedback error rate (FBER) versus channel SNR relationship, demonstrating again that at a given channel SNR the FBER is typically 1.5 orders of magnitude lower than the FER.
When feedback errors do occur (which is fairly infrequent), the effect of these can be removed during the next INTRA-frame transmission, or during the INTRA-update of the mac-roblocks affected. The rate at which these INTRA-updates occur is dependent on the additional robustness required. However, the more frequent the INTRA-updates, the lower the video quality since the INTRA-blocks use up a larger fraction of the available bitrate.
Following these arguments, we configured the power-control scheme to maintain this 5% target FER. Given the
Fig. 9. FER and FBER versus channel SNR for the various operational modes.
[image:7.612.320.541.501.666.2]Fig. 10. FER with power control, versus user and interferer distance from BS for 2QAM.
Observe also that when the interferer is at a distance of 200 m from its BS and, hence, the farthest from the serving BS, a maximum of 5% FER is maintained for all user distances within the cell. By contrast, for an interferer distance of 200 m, when the interferer is closest to the serving BS, the maximum acceptable user distance is about 140 m. In other words, over the majority of the cell a better than required FER is maintained at the cost of a high transmitted power, while in certain cell areas the FER performance is inadequate.
In Fig. 8(a) and (b), we displayed two operational scenarios as snap-shot examples for the best and worst case situations in which the power-control scheme was used. We note, however that these examples cannot be used to judge the quality of the power control on a statistical basis. A more pertinent power-control quality assessment can be inferred from Figs. 10 and 11. The 2QAM mode was used and the best case was, when the interferer was as far from the serving BS as possible, i.e., at 200 m from its own BS, while the user was as close to its serving BS’s, as possible, i.e., at 0 m. By contrast, the worst case is when they are both at the edge of their cells, with the interferer in its own cell, but as close to the serving BS as possible. Explicitly, Fig. 8(a) and (b) displays the power-controlled transmission power, slow fading envelope, the signal-to-interference noise-ratio (SINR) averaged over a timeslot and the frame error flag (FEF) as a function of time for the best and worst case interferer and user positions, respectively. We note that for the sake of improved visibility the slow-fading envelope was shifted in the figures. Observe that in the best case situation the transmitted power is close to its minimum of 34 dBm, while the worst case example requires a substantially increased transmitted power. The worst case example of Fig. 8(b) demonstrates, how the power control attempts to compensate after a one-frame latency for degrading SINR values. Furthermore, notice in the figures how the densely colocated FEF’s indicate when, for example, a rapid power boost is required to compensate for a deep fade.
Let us now characterize the power-control error of our algorithm in more relevant statistical terms. This error term
(a)
(b)
[image:8.612.62.275.62.248.2]Fig. 11. Histogram of the estimated power-control error of the power-control algorithm at vehicular speeds of 3, 14, 28, and 56 mph.
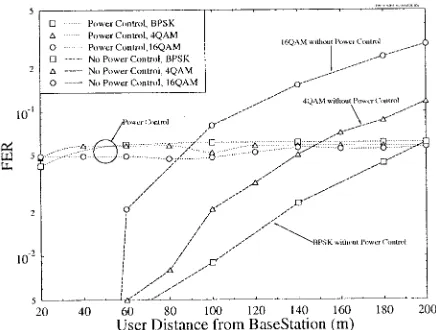
Fig. 12. Average FER with and without power control, versus user distance from BS for the maximum interference that can be caused by a single interferer.
is defined as the difference between the actual transmitted power, and the minimum required transmission power, where we assume that the minimum required power is equal to the inverse of the slow fading of the channel. In reality the required power will be always higher than the minimum value computed this way, in order to cope with the effects of fast-fading and interference. Accordingly, the histograms of the difference between the transmitted power and the inverse of the slow fading of the channel were calculated for vehicular speeds of 3, 14, 28, and 56 mph, which are shown in Fig. 11. A positive power-control error indicates an excess of transmission power, while a negative power-control error indicates that the transmission power was less than the minimum required power. The power-control algorithm is weighted toward increasing the transmission power, in order to maintain a low FER, therefore, the mean power-control error is always greater than zero.
[image:8.612.322.540.303.468.2]Fig. 13. Average transmitted power for a 2QAM/16QAM user, with a single 2QAM/16QAM interferer, respectively, versus user and interferer distance from BS.
over the geographic area of the cell, which implies a near-unimpaired video quality. Observe in the figure that in the extreme vicinity of the BS in the 2QAM mode the power could not be reduced below the dBm minimum level, which resulted in a reduced FER. In the case of 4QAM and 16QAM, however (which are not shown in the figure), this phenomenon was less pronounced.
Fig. 12 shows the system’s FER performance for the 2QAM, 4QAM, and 16QAM modes of operation. These curves were obtained for the worst case interferer offset of 200 m in Fig. 10 and in the corresponding simulations for 4QAM. A conclusion of the above findings was that the proposed BER-based power-control algorithm was capable of assisting in different modulation schemes. Although for 2QAM the power control seem to actually degrade the FER performance, we will show that maintaining the required target FER allows the portables to operate at significantly reduced transmitted power and battery consumption.
V. AVERAGE TRANSMITTED POWER
When there is no power control, the average transmit-ted power is identical to the fixed power of each portable. When using power control, the average transmitted power required for maintaining an FER of 5% and, hence, unimpaired video quality, varies within the cell and depends also on the modulation mode used. The corresponding simulation results are shown in Fig. 13 for 2QAM and 16QAM, respectively. Explicitly, these figures demonstrate how the average required transmitted power varies with user and interferer distances from their respective BS’s, where averaging was carried out over the set of users at all locations within the cell. As expected, the average required transmitted power increases when users move away from their BS, but the position of the interferer also has an effect. It should be noted that the maximum average power is less than 30 dBm the power that we used for the fixed power simulations. Furthermore, we note that the position of the interferer has more of an
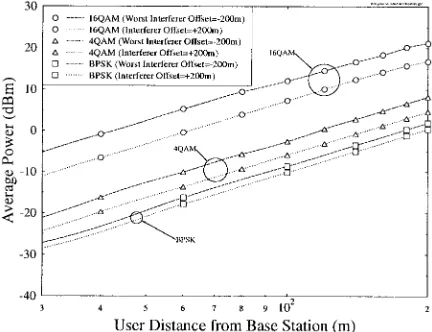
Fig. 14. Average transmission power versus user distance from BS for the best (200 m) and worst (0200 m) interferer positions and for 2QAM, 4QAM, and 16QAM modes of operation.
effect in conjunction with the less robust scheme, namely 16QAM, where the lowest transmitted power is required when the interferers are close to their own BS’s, transmitting also at low powers.
The average transmitted power required for maintaining an FER of 5% and, hence, near-unimpaired video quality, versus user distance from the BS for interferer offsets of 200 and 200 m are plotted for the 2QAM, 4QAM and 16QAM modes of operation in Fig. 14. It was found from this figure that the average power in terms of user distance could be modeled using (1)
dB (1)
[image:9.612.323.539.309.475.2]TABLE V
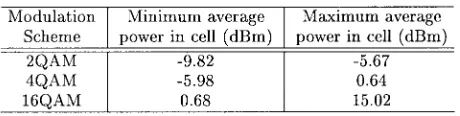
GEOGRAPHICALLYAVERAGEDTRANSMISSIONPOWER IN THECELL INdBm,FORVARIOUSMODULATIONSCHEMES
AND FOR THEBEST ANDWORSTINTERFERERPOSITIONS
Here we introduce the geographically averaged MS transmit power consumption in the cell as a performance metric in order to evaluate the effect of the power control. Assuming a uniform geographical MS distribution and a circular cell area, the geographically averaged MS transmit power consumption can be calculated using the mean value theoreom, stating that the average value for a two-dimensional function can be found by dividing the corresponding enclosed volume by the base area. In this case, the base area is that of a circle, i.e., . The volume of the integral of (1) for the range of possible user radii and angles from the BS after division by is given by
Aver. Power in Cell (dB)
dB (2)
[image:10.612.319.540.59.228.2]This equation implies that the average MS transmission power in the cell, where averaging is carried out over the set of all MS’s, is 7.6 dB less than the average required power used by a user at the edge of the cell, where averaging in this sense is over the set of users at any given location provided that the users have a uniform geographical distribution. In the case of a linear 35 dB/decade pathloss power-law model, this is equivalent to the average power of a user at a distance of 0.61 from his BS. Using the offset found from Fig. 14, the geographically averaged MS transmission power in the cell is tabulated in Table V for the 2QAM, 4QAM and 16QAM modes of our transceiver. Since is dependent on both the modulation scheme and the interferer position, as shown in Fig. 14, the table includes results for the maximum and minimum average power that can be expected in a cell. The minimum average power occurs, when the interferer is close to its BS, therefore, transmits at a lower power, thereby reducing the amount of cochannel interference it inflicts. The maximum average power occurs, when the interferer is at the edge of its cell and at the closest point to the interfered BS.
In conclusion, it can be seen from the table that even for the most “power-thirsty” 16QAM mode the required worst case average MS power in the cell is about 15 dB less than the maximum allowed transmitted power of 30 dBm used in conjunction with the power controlled scheme. In comparison to the best case required average MS transmit power the power reduction is about 30 dB. The simulations without power
Fig. 15. Average transmission power (dBm) versus transmission FER for all three modes of operation for users at 200 m from their BS moving at 28 mph, with a single interfer at the closest point in a cochannel cell, corresponding to the worst case situation. The maximum transmission power is limited to 30 dBm.
control used a fixed transmission power of 30 dBm for all MS’s and achieved worse performance at the edge of the cells than the power controlled MS’s, as was shown in Fig. 12.
Fig. 15 shows the average required transmission power versus FER for the three modes of operation in the worst case, i.e., for a user at the edge of the serving cell and for a single interferer in a position of the cochannel cell, where it inflicts maximum interference. The figure allows the tradeoffs in terms of required transmission power, FER and modulation mode to be appreciated. A user experiencing too high a FER can increase the transmission power in order to reduce the FER. Alternatively, the user can switch to a more robust modulation scheme, resulting in a considerable reduction in the FER. A combination of changing to a more robust modulation scheme and reducing power can maintain the same FER at the consequential loss of video quality. A range of further interesting system design aspects can be inferred from this figure by the reader.
VI. SIGNAL-TO-INTERFERENCE PERFORMANCE
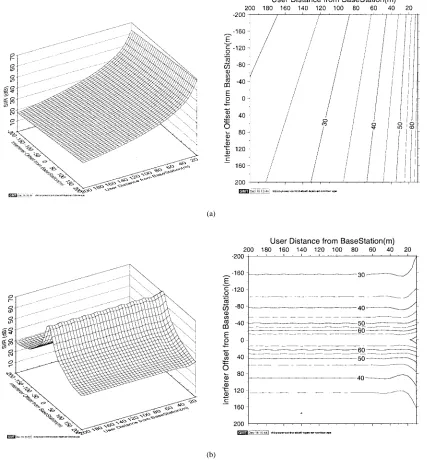
In this section, we will show the effect of the proposed power-control algorithm on the signal-to-interference (SIR) ratio experienced by the mobiles across the cell area. Fig. 16(a) and (b) shows the simulated SIR performance without power control for the channel conditions of Table I, using slow and fast fading.
[image:10.612.55.285.99.157.2](a)
[image:11.612.89.516.63.526.2](b)
Fig. 16. Simulated average SIR ratio with and without power control versus user and interferer distance from the BS.
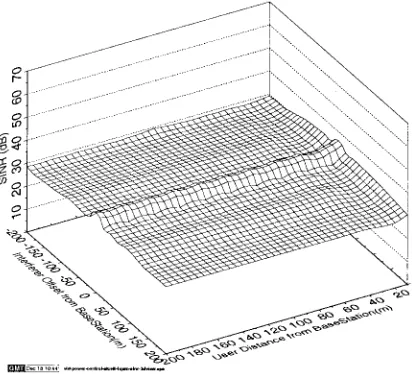
geographical SINR distribution is quite similar to that of the SIR, as seen in Fig. 16(a). However, when power control is used, the geographical SINR profile becomes near constant, as shown in Fig. 17. This is expected, since the power-control algorithm is attempting to keep the FER constant, which is closely related to the SINR. When possible, the transmitter powers down, which on the average reduces the power consumption and the SIR but, therefore, the effect of noise becomes more dominant.
VII. CONCLUSION
The proposed BER-based power-control algorithm is capa-ble of maintaining the target FER of the multimode transceiver in any of the modem modes. Depending on the mode used different video bitrates and, hence, different video qualities
Fig. 17. Simulated average SINR with power control for a single 4QAM interferer versus user and interferer distance from the BS.
ACKNOWLEDGMENT
The authors would like to thank the anonymous reviewers for their constructive criticism and efforts in expanding and improving the manuscript.
REFERENCES
[1] J. Streit and L. Hanzo, “Vector-quantised low-rate cordless videophone systems,” IEEE Trans. Veh. Technol., vol. 42, pp. 340–357, May 1997. [2] ISO/IEC 11172 MPEG 1 Int. Standard, “Coding of moving pictures and
associated audio for digital storage media up to about 1.5 Mbit/s,” pts. 1–3.
[3] ISO/IEC CD 13818 MPEG 2 Int. Standard, “Information technology: Generic coding of moving video and associated audio information,” pts. 1–3.
[4] ITU-T, Recommendation H.263: “Video coding for low bitrate commu-nication,” approved 1996.
[5] K. H. Tzou, H. G. Mussmann, and K. Aizawa, Guest Eds., “Special issue on very low bitrate video coding,” IEEE Trans. Circuits Syst. Video
Technol., vol. 4, pp. 213–357, June 1994.
[6] B. Girod, et al., Guest Eds., “Special issue on image sequence com-pression,” IEEE Trans. Image Compression, vol. 3, pp. 465–716, Sept. 1994.
[7] H. Gharavi, H. Yasuda, and T. H. Meng, Guest Eds., “Special issue on wireless visual communications,” IEEE Trans. Circuits Syst. Video
Technol., vol. 6, pp. 133–237, Apr. 1996.
[8] Y.-Q. Zhang, F. Pereira, T. Sikora, and C. Reader, Guest Eds., “Special issue on MPEG-4,” IEEE Trans. Circuits Syst. Video Technol., vol. 7, Feb. 1997.
[9] M. Khansari, A. Jalali, E. Dubois, and P. Mermelstein, “Low bit-rate video transmission over fading channels for wireless microcellular systems,” IEEE Trans. Circuits Syst. Video Technol., vol. 6, pp. 1–11, Feb. 1996.
[10] N. F¨arber, E. Steinbach, and B. Girod, “Robust H.263 video transmission over wireless channels,” in Proc. Int. Picture Coding Symp. (PCS), Melborne, Australia, Mar. 1996, pp. 575–578.
[11] E. Steinbach, N. Faerber, and B. Girod, “Standard compatible extension of H.263 for robust video transmission in mobile environments,” IEEE
Trans. Circuits Syst. Video Technol., to be published (see:
http://www-nt.e-technik.uni-erlangen.de/girod/publications.html).
[12] K. N. Ngan and W. L. Chooi, “Very low bitrate video coding using 3-D subband approach,” IEEE Trans. Circuits Syst. Video Technol., vol. 4, no. 3, pp. 309–316, June 1994.
[13] R. M. Pelz, “An unequal error protectedp 2 8 kbit/s video transmission for DECT,” in Veh. Technol. Conf., IEEE, pp. 1020–1024, 1994. [14] “Special issue: The European path toward UMTS,” IEEE Personal
Commun.: Mag. Nomadic Commun. Computing, vol. 2, pp. 2–63, Feb.
1995.
[15] “Advanced communications technologies and services (ACTS),” Work-plan, Eur. Commission, DGXIII-B-RA946043-WP, Aug. 1994. [16] P. Cherriman and L. Hanzo, “Programable h.263-based wireless
video transceivers for interference-limited environments,” IEEE Trans.
Circuits Syst. Video Technol., to be published (see:
http://www-mobile.ecs.soton.ac.uk).
[17] W. Webb and L. Hanzo, Modern Quadrature Amplitude Modulation:
Principles and Applications for Wireless Communications. New York: IEEE–Pentech Press, 1994.
[18] J. S. da Silva, B. Arroyo-Fernandez, B. Barani, J. Pereira, and D. Ikonomou, “Mobile and personal communications: ACTS and beyond,” in Wireless Communications—TDMA versus CDMA, S. G. Glisic and P. A. Leppanen, Eds. Norwell, MA: Kluwer Academic, 1997, pp. 379–415.
[19] T. Ojanpera, “Overview of research activities for third generation mobile communications,” in Wireless Communications—TDMA versus CDMA, S. G. Glisic and P. A. Leppanen, Eds. Norwell, MA: Kluwer, 1997, pp. 415–446.
[20] K. Pehkonen et al., “A performance analysis of TDMA and CDMA based air interface solutions for UMTS high bitrate services,” in Proc.
PIMRC’97, Helsinki, Finland, Sept. 1997, pp. 22–26.
[21] T. Ojanpera et al., “Analysis of CDMA and TDMA for 3rd generation mobile radio systems,” in Proc. Veh. Technol. Conf., Phoenix, AZ, May 1997, vol. 2, pp. 840–844.
[22] K. Pajukoski et al., “Wideband CDMA test system,” in Proc. PIMRC’97, Helsinki, Finland, Sept. 1997, pp. 669–673.
[23] A. Klein et al., “FRAMES multiple access mode 1—Wideband TDMA with and without spreading,” in Proc. PIMRC’97, Helsinki, Finland, Sept. 1997, pp. 37–41.
[24] P. W. Baier, P. Jung, and A. Klein, “Taking the challenge of multiple access for third-generation cellular mobile radio systems—A European view,” IEEE Commun. Mag., vol. 34, no. 2, pp. 82–89, Feb. 1996. [25] B. Engstroem and C. Oesterberg, “A system for test of multiaccess
methods based on OFDM,” in Proc. Veh. Technol. Conf., Stockholm, Sweden, 1994, pp. 1843–1847.
[26] F. Adachi et al., “Coherent DS-CDMA—Promising multiple access for wireless multimedia mobile communications,” in Proc. IEEE ISSSTA’96, pp. 351–358, Mainz, Germany, Sept. 1996.
[27] “Feature topic: Software radios,” IEEE Commun. Mag., vol. 33, pp. 24–68, May 1995.
[28] S. Sampei, T. Ue, N. Morinaga, and K. Hamguchi, “Laboratory experi-mental results of an adaptive modulation TDMA/TDD for wireless mul-timedia communication systems,” in Proc. IEEE PIMRC’97, Helsinki, Finland, Sept. 1997, pp. 467–471.
[29] K. Arimochi, S. Sampei, and N. Morinaga, “Adaptive modulation system with discrete power control and predistortion-type nonlinear compensation for high spectral efficient and high power efficient wireless communication systems,” in Proc. IEEE PIMRC’97, Helsinki, Finland, Sept. 1997, pp. 472–477.
[30] S.-G. Chua and A. Goldsmith, “Variable-rate variable-power mqam for fading channels,” in 46th Veh. Technol. Conf., Atlanta, GA, 1996, pp. 815–819.
[31] A. Goldsmith and S. Chua, “Variable-rate variable-power MQAM for fading channels,” IEEE Trans Commun., vol. 45, pp. 1218–1230, Oct. 1997.
[32] R. Steele (Ed.), Mobile Radio Communications. New York: IEEE–Pentech Press, 1992.
[33] J. Zander, “Performance of optimum transmitter power control in cellular radio systems,” IEEE Trans. Veh. Technol., vol. 41, pp. 57–62, Feb. 1992.
[34] J. Zander, “Distributed cochannel interference control in cellular radio systems,” IEEE Trans. Veh. Technol., vol. 41, pp. 305–311, Aug. 1992. [35] M. Zorzi, “Power control and diversity in mobile radio cellular systems in the presence of Ricean fading and log-normal shadowing,” IEEE
Trans. Veh. Technol., vol. 45, pp. 373–382, May 1996.
[36] Y.-W. Leung, “Power control in cellular networks subject to mea-surement error,” IEEE Trans. Commun., vol. 44, pp. 772–775, July 1996.
[37] S. Ariyavisitakul and L. F. Chang, “Signal and interference statistics of a CDMA system with feedback power control,” IEEE Trans. Commun., vol. 41, pp. 1626–1634, Nov. 1993.
[38] R. Pichna and Q. Wang, “Power control,” in The Mobile