JOURNAL OF FOREST SCIENCE, 63, 2017 (10): 463–469
doi: 10.17221/22/2017-JFS
Efficiency of sector sampling for estimating juniper
forest attributes vs. fixed area plot
Mohammad Hussein SERAJ, Bahman KIANI*
Department of Forest Science, Faculty of Natural Resources, Yazd University, Yazd, Iran *Corresponding author: [email protected]
Abstract
Seraj M.H., Kiani B. (2017): Efficiency of sector sampling for estimating juniper forest attributes vs. fixed area plot. J. For. Sci., 63: 463–469.
Juniper forests grow in mountain areas and many difficulties are encountered in their sampling. Sector sampling as an unbiased and cost-effective method was tested for the sampling of a 12.5-ha juniper forest. To begin with, a point-map of trees was created and 50 quadrats were determined systematically. Fixed area plots were measured within these 50 × 50 m quadrats. In each quadrat, eight sectors with 45° angle were determined. One-sector and two-sector scenarios randomly besides four-sector scenario systematically were conducted. Accuracy and precision of sampling methods were compared. Also, statistical analysis was conducted to compare sector sampling scenarios with fixed area plot (FAP) and real data. Results showed that four-sector scenario estimates were close to FAP method in precision and accuracy. Statistical analysis showed that there was no significant difference between sector sampling scenarios and FAP and in real data. But in correlation analysis only the four-sector scenario could compete with FAP method. Regarding consumed time and sampling error simultaneously, the efficiency of sector sampling was higher than that of FAP method for estimating density and close to FAP method for estimating crown cover. It can be concluded that in laborious situations such as in juniper forests, sector sampling can be competitive with FAP method with notice-able parsimony. But more study is still needed to decrease sampling error and optimize sector angle with the purpose of cost saving.
Keywords: accuracy; crown cover; density; precision; plot shape
Supported by the Yazd University, Project No. 50/338716.
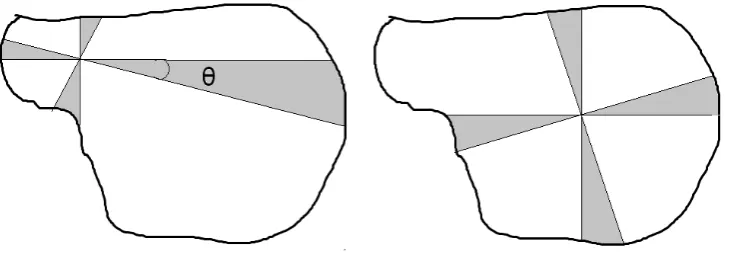
Sector sampling was developed for sampling tree patches that remained from clear cutting in Can-ada. Today this method is noteworthy because of unbiased estimations, simplicity and independence to knowing the stand area (Iles, Smith 2006). Sec-tor sampling uses a slice shape that is named secSec-tor, as a part of the circle. In fact, the patch is assumed as a circle and a part of this circle is measured with predetermined angle Θ (Fig. 1).
The sector sampling methodology assumes a sampling area shaped as a circle and is suitable to overcome the edge effects. Yet it reduces time and effort of the survey and provides good accuracy of the estimate. Sector sampling could also be
use-ful for the rapid and accurate sampling of coarse woody debris (Chiriaco 2010).
As the starting point of each sector is selected randomly, the area varies between sectors (Fig. 1). In a sector, each tree has the same probability Θ/2π of being included in the sample. If opposite clusters are selected, this balanced selection was found to be desirable and effective by many researchers, e.g. McGarrigle and Kershaw (2016).
mid-dle of the remaining patch, scarce literature about sector sampling can be found. McGarrigle and Kershaw (2016) compared sector sampling with traditional sampling methods in Acadian riparian forests. They concluded that balanced sector plots performed better than single sectors but density estimates were variable in sectors. They suggested that different sector angles must be tested in ripari-an forests. Lynch (2006) tried to decrease the vari-ance of sector sampling using Monte Carlo simula-tion. Two-phase sector sampling was conducted to estimate farm trees by Chiriaco (2010) and also by Corona et al. (2011). They concluded that sec-tor sampling is a fast method and provides satis-factory and reliable results. Eskelson et al. (2013) found that sector sampling is not as accurate as strip sampling for the inventory of riparian forests.
Inadequate literature about sector sampling calls for more studies to reduce bias, error, and special-ized sector angle, in particular vegetation. Here we tested sector sampling for the first time in ju-niper forests and compared it to FAP method and fully enumerated data. As juniper forests grow in impassable mountains, sector sampling as a fast method with lower fieldwork may economize the inventory of this type of forests.
MATERIAL AND METHODS
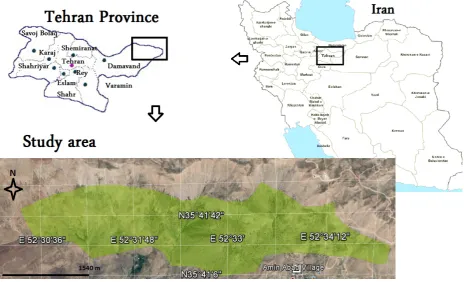
Study area. This study was conducted in Amina- bad located in Firoozkooh County, 143 km far from
Tehran (Fig. 2). Here Juniperus excelsa M. von
Bieberstein makes a 613-ha forest between 52°33' and 52°35' longitude and 35°41' to 35°43' latitude. Other accompanying trees and shrubs include
Amygdalus lucioides Spach, Rhamnus pallasii
Fisch-er, Cerasus microcarpa Boissier, Berberis crataegina
de Candolle, Lonicera nummularifolia Jaubert & Spach, and Crataegus spp.(Ramin et al. 2012).
The climate of the area is semi-wet and ultra-cold with 392 mm annual precipitation and 5.5°C mean
annual temperature. Juniper forests belong to the Iran-Touran mountain forests zone and are eco-logically valuable.
Methodology. To select a representative area, a field trip was conducted. Finally, a rectangular 12.5-ha area was selected. This area was divided into fifty 50 × 50 m quadrats. In each quadrat, azi-muth and distance to the bottom left corner were measured for all juniper trees. Crown diameters were also measured to calculate the crown area. Using triangular equations, for each tree a coordi-nate (xy) was computed. Data were imported to Mi-crosoft Excel Professional Plus (Version 2013) and arrived to ArcGIS Desktop (Version 10.2, 2013) for creating a point map.
As the spatial pattern of forest trees affects re-sults of sampling methods, the spatial pattern of ju-niper trees was examined by two nearest neighbour
and Ripley’s K function methods in ArcGIS
envi-ronment. Ripley’s K function is calculated at mul-tiple distances allowing to see how point pattern distributions can change with scale. For example, at near distances the points could cluster, while at farther distances points could be dispersed. Rip-ley’s K function can be calculated in a univariate form where we are describing the spatial pattern of only one species. Alternatively, K can be calculated in a bivariate form where we are interested in the spatial pattern of a species compared with other species of trees (Dixon 2002), as Eq. 1:
2p ij d , /
K d A W I i j n (1)
where:
d – distance to features,
Ap – area of the plot,
Wij – correction of the edge effect,
Id – equal to 1 if the distance between features is less than or equal to d, otherwise it is 0,
n – sample size.
The nearest neighbour function is defined in rela-tion to some point of a point process already
[image:2.595.117.482.53.181.2]ing in some region of the space. More precisely, for some point in the point process the nearest neigh-bour function is the probability distribution of the distance from that point to the nearest or closest neighbouring point (Wuenschel 2007), as Eq. 2:
2 n
R d
A
(2)
where:
R – nearest neighbour statistic,
d– – mean observed nearest neighbour distance,
A – total area.
We used nine permutations for calculating con-fidence intervals and Ripley’s edge correction method.
To conduct sampling, each quadrat was divided into eight sectors with Θ = 45°. A sector was selected randomly and all trees inside the sector were count-ed and their crown area was calculatcount-ed. The amount of density and crown cover for this sector were mul-tiplied by 8 to compute density and crown cover of the total quadrat. Again, another random sector was selected and all calculations were repeated. In the 3rd
scenario, an average of these sectors was computed for density and crown cover. A systematic four-sec-tor scenario also was conducted. In each quadrat, a 2,000 m2 circular plot was determined and density
and cover were computed (Fig. 3).
Accuracy and precision of estimates were com-pared for five scenarios. Eqs 3–5 were used to
cal-culate sampling error (E) and percent bias (B%) as criterions for sampling precision and accuracy, respectively:
SE
E t (3)
where:
t – critical value of Student’s t-distribution for α = 0.05 and df = n – 1,
SE – standard error of the estimated mean.
% / 100
E E X (4)
where:
E% – percent error,
X– – estimated mean.
% EV RV / RV 100
B (5)
EV – estimated value of the mean,
RV – real value of the mean derived from fully enumer-ated data.
[image:3.595.64.529.59.341.2]To compare methods with fully enumerated data a one-sample Wilcoxon test was conducted. Also, a paired samples Wilcoxon signed ranks test was used to compare sector sampling scenarios with FAP method. Pearson correlation analysis was conducted to clarify the relationship between esti-mates of sector sampling scenarios and FAP meth-od as a reliable and standard methmeth-od. Efficiency of
sector sampling was evaluated by Eq. 6 (Heidari et al. 2008):
2EFF T E% (6)
where:
EFF – efficiency of sampling method,
T – total time of sampling.
This criterion for all sector sampling scenarios was calculated and compared with the FAP meth-od. The smaller this criterion is, the more efficient the sampling method is.
RESULTS
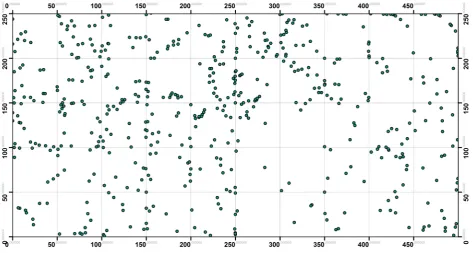
A point-map of trees can be observed in Fig. 4. Analysing the spatial pattern using the nearest neighbour index showed that juniper trees have a clumped pattern that can be related to habitat
limi-tations, especially not enough soil for regeneration and growth of seedlings. Also, juniper tree seeds are rather heavy, which supports this clumped pat-tern. Ripley’s K-function showed that the clumped pattern continues to about 180 m far from trees.
Descriptive statistics of variables for different scenarios are shown in Table 1. As can be seen, re-sults of sector sampling were close to FAP method. Real density was 10.8 trees and real crown cover was 351 m2 per plot, which resulted from fully
enu-merating (100% inventory). The accuracy of two-sector scenario for estimating density and four-sec-tor scenario for estimating crown cover was closer to FAP method. Besides, the precision of four-sec-tor scenario was higher both for estimating density and crown cover.
[image:4.595.66.534.55.175.2]Statistical analysis with one-sample Wilcoxon test showed that there was no significant difference between scenarios in real density and real crown cover (Table 2). It is mentioned that Z-value cannot
Fig. 3. From left: one-sector, two-sector, four-sector and fixed area plot scenarios
[image:4.595.62.536.490.743.2]be displayed in SPSS (Version 21, 2012), so it is not presented in Table 2.
The paired-samples Wilcoxon test also showed that there was no significant difference between sector sampling and FAP method in estimating density and crown cover (Table 3).
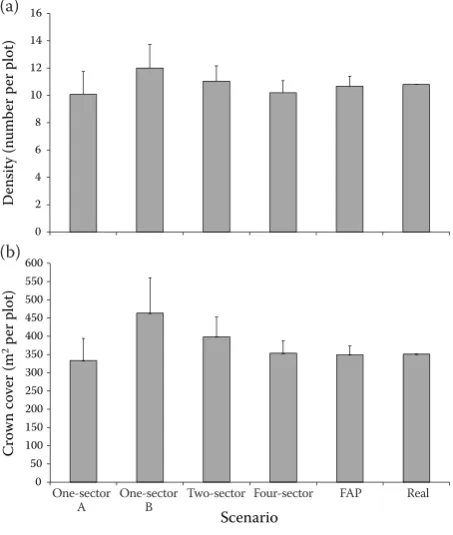
To better imagine the results, a graphical com-parison of estimated density and crown cover can be seen in Figs 5a, b. Clearly, the four-sector sce-nario has more acceptable and accurate results.
It can be said that the FAP method is a low biased and precise method as expected. But the four-sec-tor sampling scenario can also compete to estimate forest attributes. Efficiency of sampling methods is shown in Table 4.
It is clear that sector sampling scenarios are more efficient than the FAP method because of
la-Table 3. Results of the paired-samples Wilcoxon test for comparing sector sampling and fixed area plot (FAP) method
Pair rank differenceDensity (number per plot)Z-value P-value rank differenceCrown cover (mZ-value2 per plot)P-value
One-sector A-FAP –1.12 –0.85 0.39 –6.16 –0.77 0.43
One-sector B-FAP –5.41 –0.28 0.77 –0.68 –0.82 0.93
Two-sector-FAP –0.5 –0.31 0.75 –1.12 –0.38 0.70
[image:5.595.63.534.72.222.2]Four-sector-FAP 4.93 –0.77 0.43 3.69 –0.19 0.84
Table 2. Results of one-sample Wilcoxon test for compar-ing scenarios with real data
Scenario (number per plot)Density Crown cover (m2 per plot) mean P-value mean P-value One-sector A 10.08 0.57 333.44 0.24 One-sector B 12.00 0.75 463.47 0.74 Two-sector 11.04 0.86 398.45 0.93 Four-sector 10.20 0.48 353.47 0.54
FAP 10.60 0.63 349.50 0.98
[image:5.595.305.532.337.605.2]FAP – fixed area plot
Table 1. Accuracy and precision of sector sampling vs. fixed area plot (FAP) method
Scenario Mean SD SE E% B%
Density
(number per plot)
one-sector A 10.08 11.73 1.66 32.93 –6.66
one-sector B 12.00 12.16 1.72 28.66 11.11
two-sector 11.04 7.91 1.12 20.28 2.22
four-sector 10.20 6.15 0.87 17.05 –5.55
FAP 10.60 5.09 0.72 13.58 –1.85
Crown cover (m2 per plot)
one-sector A 333.44 426.79 60.35 36.19 –5
one-sector B 463.47 681.36 96.35 41.57 32.04
two-sector 398.45 383.49 54.23 27.22 13.51
four-sector 353.47 242.67 34.31 19.41 0.70
FAP 349.50 170.31 24.08 13.77 –0.42
[image:5.595.63.292.524.628.2]SD – standard deviation, SE – standard error, E% – percent error, B% – percent bias
Fig. 5. Comparing estimated density (a), crown cover (b) between scenarios (error bars represent standard error) FAP – fixed area plot
0 2 4 6 8 10 12 14 16 D en sity (n um be r p er p lot ) 0 50 100 150 200 250 300 350 400 450 500 550 600
One-sector A One-sector B Two-sector Four-sector FAP Real
Cro w n co ve r ( m 2pe r p lo t) Scenario
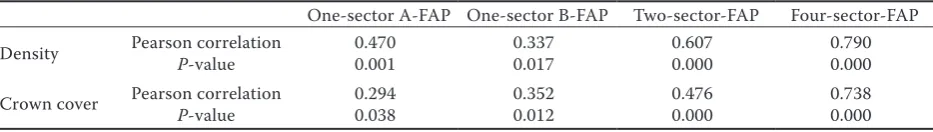
bour saving in sector sampling. Here squared er-ror percent was used because of its priority to time. To clarify the statistical relation between sector sampling and FAP method in estimating forest at-tributes, a correlation analysis was conducted. Re-sults can be seen in Table 5.
(a)
(b)
One-sector
[image:5.595.61.534.679.757.2]It can be seen from the correlation table that only in the four-sector scenario there is a strong rela-tionship with FAP estimates. So it can be said that one-sector and two-sector scenarios cannot be competitive with FAP method.
DISCUSSION
Sector sampling was introduced in 2006 mainly for accurate estimation of tree patches remaining from clear cutting in Canada. With regard to sim-plicity and unbiasedness, it was emphasized to be efficient in forest inventory. But it was not popu-lar, maybe because of this supposition that sector sampling is specific for the inventory of patches. Whereas it may be useful for sampling of forest communities with clustered pattern or other veg-etation as used by McGarrigle and Kershaw (2016) for riparian forests of the Acadian river in Canada.
Our results revealed that juniper trees follow a clumped pattern in the study area. This pattern is mainly a consequence of habitat limitations, e.g. lack of suitable soil for germination, having weighty seeds that cannot recede far from parent trees and finally human impacts. These results were
sup-ported by Houle and Duchesne (1999) for
Juni-peruscommunis Linnaeus. They concluded that the
clumped dispersion pattern in a juniper population may be related to the fact that most seed cones fall directly underneath the mother plant, so these seeds are deposited in clumps. Whereas Castel-lano and Boyce (2007) reported a random pat-tern for Juniperus virginiana Linnaeus. We
empha-size that the spatial pattern of forest trees is highly scale-based. But for juniper trees with regard to weighty seeds and limited conditions to grow seed-lings, a clumped pattern is more imaginable.
Here we tested the cluster sampling method in ju-niper forests for the first time. Our results showed that the sampling error in sector sampling was higher than in FAP method but it decreased with sampling additional clusters. It can be said that a maximum of four clusters in each pivot point is enough for sampling each quadrat. As in mountain areas it is impossible to identify patch borders, we propose to specify rectangular plots and determine clusters inside these quadrats like in this research.
The accuracy of sector sampling was surprisingly close to the FAP method supported by Smith et al. (2008). For the inventory of Thailand forests Tong-son et al. (2011) reported 33% sampling error for sector sampling but they mentioned that because of more time consumed in FAP method, sector sampling is more efficient.
As the total time for conducting the FAP method in our study was 1,760 min (about 35 min for each plot), needed time to conduct one-, two-, and four-sector scenarios was about 220, 440 and 890 min, respectively. With regard to error percent and time consumption of the sector sampling scenarios, it can be said that sector sampling is more efficient than the FAP method for estimating stand density and is as efficient as the FAP method for estimating stand crown cover. These results were in agreement with those of Corona et al. (2011).
[image:6.595.64.532.73.164.2]Statistical analysis showed that sector sampling is not different from FAP and fully enumerating data. It can be said that it has stability of estimation on
Table 4. Comparing the efficiency of sampling scenarios
Method Time (h) Density Crown cover
E% time × (E%)2 E% time × (E%)2
One-sector A 3.66 32.93 3,968.8 36.19 4,793.5
One-sector B 3.66 28.66 3,006.3 41.57 6,324.7
Two-sector 7.33 20.28 3,014.6 27.22 5,431
Four-sector 14.66 17.05 4,261.7 19.41 5,523.1
FAP 29.33 13.58 5,408.9 13.77 5,561.3
FAP – fixed area plot, E% – percent error
Table 5. Results of correlation analysis between sector sampling and fixed area plot (FAP) method
One-sector A-FAP One-sector B-FAP Two-sector-FAP Four-sector-FAP Density Pearson correlationP-value 0.4700.001 0.3370.017 0.6070.000 0.7900.000
[image:6.595.64.531.215.281.2]a plot scale and can carefully quantify the variabil-ity of forest communvariabil-ity. But the correlation analy-sis indicated that only in the four-sector scenario there is a strong relationship between estimates of FAP method and sector sampling method. Hence we do not recommend one- and two-sector scenar-ios for juniper forests.
For future studies, we recommend running the simulation of sampling scheme, using bootstrap to extract more reliable and stable confidence in-tervals, different sector angles, different configura-tion of sectors, e.g. random pivot point. Our results also showed that sector sampling usually has a high sampling error especially when the one-sector sce-nario is implemented. Therefore more study is still needed to optimize and modify the sector sampling method for usual inventory of juniper forest stands.
Acknowledgement
We thank all Firoozkooh Office of Natural Re-source staff who have supported data collection.
References
Castellano S.M., Boyce R.L. (2007): Spatial patterns of Ju-niperus virginiana and Loniceramaackii on a road cut in Kentucky. The Journal of the Torrey Botanical Society, 134: 188–198.
Chiriaco M.V. (2010): On the Extension of Large-scale For-est Inventories to Non-forFor-est Areas. Viterbo, University of Tuscia: 129.
Corona P., Fattorini L., Franceschi S. (2011): Two-stage sector sampling for estimating small woodlot attributes. Canadian Journal of Forest Research, 41: 1819–1826.
Dixon P.M. (2002): Ripley’s K function. In: El-Shaarawi A.H., Piegorsch W.W. (eds): Encyclopedia of Environmetrics. New York, John Wiley & Sons: 1796–1803.
Eskelson B.N.I., Anderson P.D., Tenesgen H. (2013): Sam-pling and modeling riparian forest structure and riparian microclimate. In: Anderson P.D., Ronnenberg K.L. (eds): Density Management in the 21st Century: West Side Story. General Technical Report PNW-GTR-880. Portland, USDA Forest Service: 126–135.
Heidari R.H., Namiranian M., Zobeiri M., Sobhani H. (2008): Study of applicability of point-center quarter sampling method in Zagros forests (case study: Kermanshah prov-ince). Iranian Journal of Natural Resources, 61: 85–97. Houle D., Duchesne M. (1999): The spatial pattern of a
Juni-peruscommunis var. depressa population on a continental dune in subarctic Québec, Canada. Canadian Journal of Forest Research, 29: 446–450.
Iles K., Smith N. (2006): A new type of plot that is particu-larly useful for sampling small clusters of objects. Forest Science, 52: 148–157.
Lynch T.B. (2006): Variance reduction for sector sampling. Forest Science, 52: 251–261.
McGarrigle E., Kershaw J.A. (2016): Sector Sampling in Ri-parian Zones in the Acadian Forest Region. Fredericton, University of Brunswick: 30.
Ramin M., Shataei S., Habashi H., Khoshnevis M. (2012): In-vestigation on some quantitative and qualitative character-istics of juniper stands in Aminabad of Firouzkoh. Journal of Wood and Forest Science and Technology, 19: 21–40. Smith N., Iles K., Raynor K. (2008): Investigation of some
sector sampling statistical properties. Forest Science, 54: 67–76.
Tongson P., Duangsathaporn K., Prosomsin P. (2011): Yield assessment of tree resources outside the forest using sector sampling: A case study of a public park, Bangkok Metropolis, Thailand. Kasetsart Journal (NaturalScience), 45: 396–403.
Wuenschel A. (2007): Nearest neighbor index application. Available at http://web.pdx.edu/~jduh/courses/Archive/ geog490f07/Projects/Wuenschel_NNI.pdf