The methods analysis of hazards and product defects
in food processing
Krzysztof Przystupa
1*
Department of Automation, Faculty of Mechanical Engineering, Lublin University of Technology, Lublin, Poland
*Corresponding author: [email protected]
Citation: Przystupa K. (2018): The methods analysis of hazards and product defects in food processing. Czech J. Food Sci., 37: 44–50.
Abstract: The paper pertains to the issue of quality assurance methods. Particular emphasis is placed upon the exa-mination of hazards and possible product defects in food processing. At present, Polish regulations oblige any food processing entity to implement HACCP system. The system is perceived as a universal vaccine preventing the emer-gence of possible hazards or reducing the risk to an acceptable level. As far as defects are concerned, these are either disregarded altogether or do not occur at all. Meanwhile, the practice proves the case is not so. The research aspect of the paper revolves around an attempt to transplant solutions primarily applied in the automotive sector onto food processing industry. The practical aspect of the paper is manifested in the analysis of causes behind defects and ha-zards conducted on the basis of bakery industry. Potential haha-zards and product defects emerging from the process were identified in the course of the study. In addition, in order to eliminate these, their level was established with the application of various methods.
Keywords: food processing; HACCP; statistical control; product defects
In light of HACCP system (Hazard Analysis and Criti-cal Control Points), in food processing industry, the emergence of product defects is motivated by the pres-ence of hazards which were not eliminated at a spe-cific level of the technological process, or whose level was not reduced to an acceptable level, i.e. one safe for consumers’ health (Mortimore 2013). Three main categories of hazards can be enumerated in such a context:
(1) physical hazards (Z1); (2) chemical hazards (Z2); (3) biological hazards (Z3).
Such an interpretation of quality does not auto-matically ensure defect-free products. Any negative characteristic of a product which reduces its consumer value or even disqualifies it and makes it unsuitable for consumption constitutes a product defect. With regard to baked goods, defects may be classified into
the following groups: external appearance defects, crumb’s defects, taste and aroma defects, staling.
As far as baked goods are concerned, e.g. rye or mixed bread, the most frequent defects include the following:
(1) External appearance defects: (a) shape defects (W1);
(b) low volume of the loaf (W2); (c) crust defects (W3).
(2) Internal defects:
(a) taste and aroma defects (W4); (b) crumb’s defects (W5).
Manufacturing Practice (Przystupa 2007; Kokkina-kis et al. 2008).
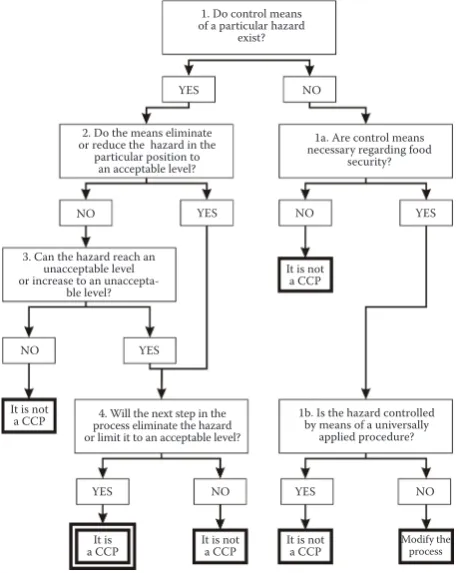
By definition, HACCP determines which threats ought to be considered as critical and which stage they ought to be focused upon (Critical Control Points). The decision tree approach constitutes a popular tool applied in the process Figure 1.
In food processing practice, no other methods aiming to identify hazards have emerged.
On the other hand, the literature associated with product quality management offers a considerable number of practical methods and tools facilitating product quality control (Turlejska 2003; Bakri 2017).
The practical goal of the article is to show the evalu-ation of quality assurance methods in the production of foodstuffs on the example of bread production. The article presents alternative methods of food safety analysis, including those that take into account product defects, not only the hazards.
The scientific objective of the article is to show how to transfer methods commonly used in the automo-tive industry to the food sector, in which the HACCP system is obligatory. It should be noted that the pre-sented considerations are not aimed at eliminating the HACCP system, but rather to support it.
MATERIAL AND METHODS
Popular classifications encompass (Adam 1994; Płaska 2000) the following: traditional magnificent seven tools, new magnificent seven tools, and a group of other tools. The traditional tools include: check sheet, histogram, control chart, Ishikawa diagram, Pareto chart, Scatter diagram and Flow chart.
The new magnificent seven tools encompass: af-finity diagram, interrelationship diagram, tree dia-gram, matrix diadia-gram, matrix data analysis chart, process decision program chart, activity network diagram. The remaining tools, which have not been outlined in the above groups, but are universally ap-plied in quality management, especially in automo-tive sector, include: FMEA analysis, brainstorming, 5S method, SMED method, six sigma method, 8D method (Dahlgaard 2006; Ericson 2015).
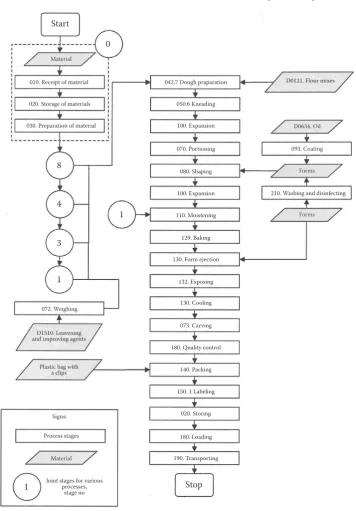
Rye bread production process constitutes the object of the study (Figure 2). The process is semi-automatic and universally implemented in small and medium facilities. The bakery the data was extracted from
operates on the basis of an implemented and docu-mented product quality system. The owner’s repre-sentative for quality and product health and safety is employed in the bakery.
RESULTS AND DISCUSSION
Decision tree method. The analysis revolves around
following the algorithm outlined in Figure 1. The anal-ysis is conducted for each stage of the technological process (Figure 2) (Gerdes 2017).
[image:2.595.304.534.459.746.2]The analysis provides information regarding which stage, i.e. critical control point (CCP), the hazard is the most likely to escape control in and become impossible to be eliminated in subsequent stages. However, the analysis does not offer the assessment of the significance regarding the identified CCPs. In addition, it does not grade and rank the identified critical control points. It does not encompass product defects either. It strictly pertains to hazards emerg-ing at individual stages of the technological process. The analysis conducted in the bakery revealed that the following constitute critical points in the facility: receipt of raw materials (CCP1) and baking (CCP2).
Figure 1. Decision tree
1. Do control means of a particular hazard
exist?
2. Do the means eliminate or reduce the hazard in the particular position to
an acceptable level?
1a. Are control means necessary regarding food
security?
3. Can the hazard reach an unacceptable level or increase to an
unaccepta-ble level?
1b. Is the hazard controlled by means of a universally
applied procedure? 4. Will the next step in the
process eliminate the hazard or limit it to an acceptable level?
YES YES
YES
YES YES
YES NO
NO NO
NO
NO NO
It is not a CCP
It is not a CCP It is not
a CCP It is
a CCP
It is not a CCP
Alternative research methods
FMEA method. It is a method a standardization
deliverable was developed for (IEC 812). The method (Figure 3) revolves around establishing causes behind defects of the product, raw material, or production stage. The probability of the emergence of a failure constitutes the measure of the stages’ significance (Risk Priority Number- RPN). The index is calcu-lated as the mathematical product of the severity (S)
[image:3.595.118.475.97.609.2]of the potential cause, likelihood of the occurrence of the defect or hazard (O) and the possibility of de-tection (D). Each of the individual elements is as-cribed weight ranging from 0 to 10. The final score constitutes a number in the range between 0–1000. Events of the highest score pose the greatest hazards for the technological process, thus for the product itself. A premise is made that critical points are re-flected in 3–5 stages or analyzed failures (hazards) with the highest RPN (Scipioni 2002).
Figure 2. A simplified diagram outlining rye bread technological production process
Start
Material
010. Receipt of material
020. Storage of materials
030. Preparation of material
8
4
3
1
1
1
0
042.7 Dough praparation
050.6 Kneading
100. Expansion
070. Portioning
080. Shaping
100. Expansion
110. Moistening
129. Baking
130. Form ejection
132. Exposing
130. Cooling
073. Carving
180. Quality control
140. Packing
150. 1 Labeling
020. Storing
180. Loading
190. Transporting
Stop
D0121. Flour mixes
D0634. Oil
093. Coating
Forms
210. Wasbing and disinfecting
Forms
072. Weighing
D1510. Leavening and improving agents
Plastic bag with a clips
Signs:
Process stages
Material
Joint stages for various processes,
Based upon FMEA, it was observed that the re-ceipt of raw materials (Z1 and Z3) and baking (W3) constitute critical points (both scored RPN of 1000). A further RPN of 900 was calculated for egg crack-ing (Z1 and Z3), and 810 for the receipt of materials into production.
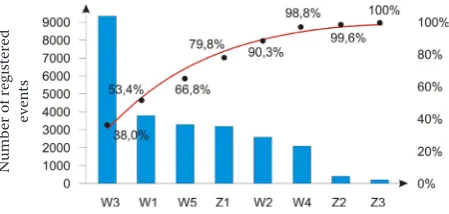
Pareto chart. Lorentz Pareto analysis is a type
of chart containing both ‘bars’ and a line chart. The bars show the values in descending order, and the line graph shows the accumulated sums of each category from left to right. The diagram was named after Vilfred Pareta. The left vertical axis usually contains observation frequencies, but it can also represent a cost or other important measure. The right vertical axis represents the cumulative percentage of all observations, the total cost, or the sum of the selected measure. Because the causes are sorted in descending order, this function is concave. The goal is to show the most signifi-cant of (usually) large number of factors. In quality control, the Pareto diagram usually represents the most common causes of damage, the most common types, the most common reasons for complaints, etc. The method requires the possession of quantitative data regarding the hitherto course of the process. In the evaluated case, the data encompassed the pe-riod 100 000 loaves of bread were produced in. Like in previous approaches, the development of the tech-nological process chart is a prerequisite in this case as well. Subsequently, potential hazards and/or prod-uct defects emerging in the assessed period are de-scribed. Five defects (W1-W5) and three hazards (Z1-Z3) were identified in the bakery. Figure 4 out-lines the quantitative sheet of the registered events. In case of baker’s goods, a joint analysis of haz-ards present in the production process and
prod-uct defects may seem somewhat faulty. This results from the sequence and significance of the event for the product. In general, product defects constitute non-removable features of the product. Hazards, on the other hand, are associated with the produc-tion process itself, thus the majority of these ought to be eliminated when implementing the Good Hygienic Practice and Good Manufacturing Prac-tice. The remaining hazards ought to be controlled and maintained at a non-hazardous level. The issue of which events are attached to the defined categories is significant. The quality assessment on the basis of the Pareto chart was conducted by calculating the percentage share of individual events (Kardas 2017; Tian 2017). Afterwards, results were presented in the chart (Figure 5).
[image:4.595.64.292.90.287.2]The analysis of Figure 5 indicates that the emergence of defective products is the key problem of the studied bakery. Hazards associated with the technological process bear less significance. Three main defects W3, W1 and W5 result in the emergence of 66.8% of defective products. The fact that W1 constitutes 38% of the total number of failures is noteworthy. Such a high value necessitates an in-depth analysis associated with causes behind the emergence of de-fective crust. In addition, the bakery is characterized by a relatively low number of hazards out of which Z1 constitutes 13% of the total number of registered
[image:4.595.304.532.489.602.2]Figure 3. FMEA method diagram
Figure 4. Hazards and defects registered in the produc-tion process
Figure 5. Pareto chart
N
umb
er of r
eg
ist
er
ed
even
ts
N
umb
er of r
eg
ist
er
ed
even
[image:4.595.306.531.644.751.2]cases. A large discrepancy between Z1, Z2 and Z3 may stem from a certain ‘leakiness’ of the existing quality system, i.e. HACCP.
Quantitative indexes. In order to evaluate
pro-duction quality before the mandatory HACCP qual-ity control system was implemented, the owner intuitively applied the quantitative quality index. The index is defined as a ratio of the actual process output to the targeted value. The literature of the subject defines the index as the product capability index (Oborski et al. 2017). The owner of the bak-ery aspires to achieve 3 or less defective loaves among 50 000 final products. Therefore, it means that the owner targets Cp = 1.33 (share of defects approx. 0.006%). This value reflects the output of large series in long-term perspective. The value meets the Japanese standard adopted in the 1980s in the automotive sector. The Cp proves the owner aspires to achieve extremely high output quality. Based upon the author’s professional experience, it can be estimated that slight defects (irrelevant for con-sumers) in the bakery industry emerge in approx. 1 out of 500 items. On the other hand, as far as the serious, consumer relevant defects are concerned, a defec-tive item emerges in between 1000 and 2000 final products. Clearly, the type of product is signifi-cant in the present case. The data discussed above are approximate and, based upon the Pareto chart (Figure 5), do not reflect the situation of the bak-ery well. Undeniably, it stems from a vthe bak-ery general and ambiguous description of defects and hazards registered in the bakery. To conclude, the number of failures in the process is too great when compared with the owner’s targeted value. As a consequence, the process is currently under further analysis.
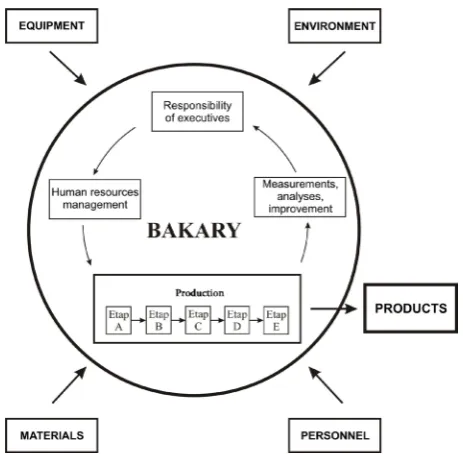
Ishikawa diagram. Baking process consists of indi-vidual stages and technological operations (Figure 6), which, when operating properly, result in the manu-facture of high quality product. Apart from the tech-nology directly associated with manufacturing, the impact of areas surrounding the production is significant for product quality (Figure 7). A separate Ishikawa diagram was composed for each identified defect and each identified hazard in association with areas impacting the production process (Figure 8).
The Isikawa chart (due to its characteristic appear-ance called the fish bone chart) allows to identify the reasons for actual or potential failures of various types of projects. For this reason, this method is also called a cause-and-effect diagram. The scope of ap-plication of this method was initially limited only
[image:5.595.304.531.108.214.2]to industry, but in a short time it proved to be useful in many other areas. The graph consists of arrows with descriptions, combining in such a way that the main arrow indicates the effect, i.e. a description of the failure that is being tested. The shape resembles a fish bone, where: the head of a fish means a prob-lem to be solved, the backbone of a fish is a group of causes that can affect the appearance of a problem, and define the specific causes belonging to a given group of causes.
Figure 6. Outline of technological processes and opera-tions
010 – receipt of material; 020 – materials storage; 030 – mate-rials preparation; 040 – dosing; 050 – mixing; 060 – ferment-ing; 070 – portionferment-ing; 080 – formferment-ing; 090 – adding extras; 100 – expansion; 110 – preparation for baking; 120 – baking; 130 – cooling; 140 – carving; 150 – packing; 160 – preserva-tion; 170 – labeling; 180 – storing; 190 – quality control; 200 – loading; 210 – transporting; 220 – washing and disinfecting; 230 – displaying
Figure 7. Processes significant from the perspective of quality assurance systems
[image:5.595.302.534.368.595.2]The categories of causes shown in Figure 8 are usu-ally chosen from the set:
(1) Personnel – including qualifications, job sat-isfaction, habits or seniority,
(2) Environment – containing elements of the work environment,
(3) Management – including the organizational structure, work organization,
(4) Material – containing input materials, substi-tutes, semi-finished products,
(5) Equipment including tools, modernity, per-formance, precision, durability, safety and working conditions.
You can also use other categories (e.g. procedures, equipment, materials, information and people) de-pending on the field in which the chart is used. Each category of causes is expanded with further detailed causes. If necessary, a sub-carrier is also included. Expansion of the graph ends when the phenomenon is fully identified.
The diagram (Figure 8) indicates that human factor plays a significant role in each area of baker’s goods production. Disadvantageous events result from noncompliance with instructions and low awareness level—lack of trainings, deviations from procedures, lack of supervision, etc.
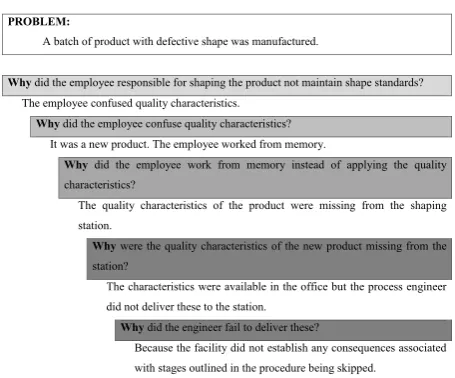
Whys method. One of the methods applied in searching for causes of original hazards and defects associated with the human factor is the 5 (Chlebus & Werbińska-Wojciechowska 2017). Whys ap-proach. The method utilizes a series of five questions. All these questions begin with the word ‘why’, hence the name of the approach. Usually, the initial question is very general, and each subsequent one specifies the previously given answer. Figure 9 outlines an example of exploring causes with the application of the method.
The method enabled the critical cause behind the emergence of defective products to be detected. The effectiveness of the method depends largely upon maintaining the standard of questions asked. The following constitute the main principles of the method:
(1) Right and comprehensible formulation and definition of the problem,
(2) cause-effect logic and differentiation between causes (hazards) and symptoms (defects) must be pre-sent,
(3) the analysis ought to be conducted on a step-by-step basis without jumping to seemingly obvious conclusions,
(4) causes ought to be sought for in processes instead of people,
(5) ‘why’ questions ought to be posed until the root cause, i.e. one when once eliminated will eradicate the problem altogether, is established.
CONCLUSIONS
The analysis of baker’s goods’ quality on the basis of HACCP conforms with legal regulations but does not considerably contribute to quality improvements. Each of the discussed methods boosts product quality. The most significant reasons behind the emergence of inconsistencies were associated with employees’ non-compliance with standards and regulations. Re-sults of FMEA confirm the significance of the listed causes behind inconsistencies emerging in the
[image:6.595.308.530.104.269.2]pro-Figure 8. Example Ishikawa (Drozd & Bielski 2017) diagram for W1 defect (shape defect)
Figure 9. Whys algorithm for W1 defect (shape defect)
PROBLEM:
A batch of product with defective shape was manufactured.
Whydid the employee responsible for shaping the product not maintain shape standards? The employee confused quality characteristics.
Why did the employee confuse quality characteristics? It was a new product. The employee worked from memory.
Why did the employee work from memory instead of applying the quality characteristics?
The quality characteristics of the product were missing from the shaping station.
Why were the quality characteristics of the new product missing from the station?
The characteristics were available in the office but the process engineer did not deliver these to the station.
Why did the engineer fail to deliver these?
Because the facility did not establish any consequences associated with stages outlined in the procedure being skipped.
MANAGEMENT ENVIRONMENT PERSONNEL Lack of fixed
regulations and production environmentDefects of stages
Product shaping Employees’ low
awareness level No DDD
measures Lack of instructions
and procedures
Lack or inappropriate
quality characteristics Process organization defects Non-compilance with
QMS and HACCP
Improper tools
EQUIPMENT MATERIALS Low materials
quality Bad technical
condition
Low auxiliary materials quality Lack of controlling
[image:6.595.305.533.304.493.2]cess. The quantitative picture of the problem is well described in the Pareto chart. The chart indicates that approx. 14% of causes produce 67% of effects. The Ishikawa diagram represents cause-effect relation-ships in the process and graphically present significant causes. The 5 Whys method enables the root causes of an issue to be established. The remaining methods play a supplementary function in the studied com-pany as far as the product quality is concerned. The analyses facilitated the establishment of a preventive action plan in relation to a narrow group of specifi-cally selected causes.
References
Adam Jr. E.E. (1994): Alternative quality improvement practices and organization performance. Journal of Op-erations Management, 12: 27–44.
Chlebus M., Werbińska-Wojciechowska S. (2017): Wybrane problemy oceny niezawodnościowej procesów produk-cyjnych. Zeszyty Naukowe Politechniki Poznańskiej. Organizacja i Zarządzanie, 72: 5–18.
Dahlgaard J.J., Dahlgaard-Park S.M. (2006): Lean produc-tion, six sigma quality, TQM and company cultureLean production, six sigma quality, TQM and company culture. The TQM Magazine, 18(3): 263–281.
Drozd R., Bielski R. (2017): Zarządzanie ryzykiem zawo-dowym w procesie produkcyjnym–zagadnienia teor-etyczne i przypadek praktyczny. Przedsiębiorstwo we współczesnej gospodarce-teoria i praktyka, 1: 7–15. Ericson C.A. (2015): Hazard Analysis Techniques for System
Safety. 2nd Ed.? New Jersey, John Wiley & Sons: 57–67. Gerdes M. (2017): Wykorzystanie drzew decyzyjnych oraz
wpływu parametrów ekstrakcji cech do projektowania odpornych sieci czujników. Eksploatacja i Niezawodność – Maintenance and Reliability, 19: 31–42.
Kardas E. (2017): Wykorzystanie narzędzi jakości do oce-ny jakościowej wybranego produktu. Zarządzanie Przedsiębiorstwem, 20: 10–15.
Kokkinakis E.N., Fragkiadakis G.A., Ioakeimidi S.H., Giank-oulof I.B., Kokkinaki A.N. (2008): Microbiological quality of ice cream after HACCP implementation: a factory case study. Czech Journal of Food Sciences, 26: 383–391. Bakri J.M., Maarof A.G., Norazmir M.N. (2017): Confusion de-termination of critical control point (CCP) via HACCP deci-sion trees. International Food Research Journal, 24: 747–754. Mortimore S., Wallace, C. (2013): HACCP: A Practical Ap-proach. Berlin, Springer Science & Business Media: 2–35. Oborski P., Bielicki B. (2017): System przetwarzania danych pomiarowych wykorzystujący SPC do obróbki krótkich serii zgodny z ideą Przemysłu 4.0. Pomiary Automatyka Robotyka, 21: 71–78.
Płaska S. (2000): Wprowadzenie do Statystycznego Sterow-ania Procesami Technologicznymi. Lublin, Wydawnictwo Politechniki Lubelskiej: 23–134.
Przystupa K. (2007): GHP i GMP w zakładzie gastronom-icznym. PAN Lublin: 19–59.
Scipioni A., Saccarola G., Centazzo A., Arena F. (2002): FMEA methodology design, implementation and inte-gration with HACCP system in a food company. Food Control 13: 495–501.
Tian F. (2017): A supply chain traceability system for food safety based on HACCP, blockchain & Internet of things. In: 2017 International Conference on Service Systems and Service Management, 1–6. doi 10.1109/ ICSSSM.2017.7996119
Turlejska H. (2003): Zasady GHP/GMP oraz system HACCP jako narzędzia zapewnienia bezpieczeństwa zdrowotnego żywności. Warszawa, Fundacja Programów Pomocy dla Rolnictwa (FAPA): 73.