Abstract—The spatial stimulus-response compatibility (SRC) effect shows that better human performance results from some spatial arrangements of controls and displays than others. This study investigated spatial stimulus-response compatibility effect with the presence of precue in a dual-task paradigm with a primary pursuit manual tracking task and a secondary spatial SRC task. The objective was to establish data for making ergonomics recommendations for human-machine interface design in control consoles. The results showed significant spatial stimulus-response (S-R) compatibility effect with the presence of precue, leading to different response times of the participants in the secondary discrete response task. BC (both transverse and longitudinal compatible) S-R mapping condition resulted in shorter reaction time. BI (both transverse and longitudinal incompatible) condition may not lead to the worst reaction time because two linear incompatibilities can be perceived as a single incompatibility in diagonal directions.
Index Terms—spatial stimulus-response compatibility, precue, dual-task paradigm
I. INTRODUCTION
N man-machine system, a fundamental communication medium is provided by displays and controls. One preferred response to a stimulus is always chosen in certain situations. ‘Population stereotype’ can be used to describe this phenomenon. The existence of an excellent pairing of response sets (control devices) and stimulus sets (displays) is proposed. Population stereotypes can be expressed by the probability with which a response is chosen. It is believed that compatible pairings in general lead to faster reaction time and lower error rates. According to Umiltá and Nicoletti [1], the higher efficiency and accuracy of compatible S-R combination is due to lower recoding demands and higher information transfer rates during responses. In order to
Manuscript received October 13, 2016; revised November 27, 2016. The work described in this paper was fully supported by a grant from City University of Hong Kong (SRG7004663).
Ken S.S. MAN is with the Department of Systems Engineering and Engineering Management, City University of Hong Kong, Kowloon Tong, Hong Kong (Email: [email protected]).
Coskun DIZMEN, was with SEEM Department of City University of Hong Kong. He is now with Logistics Department of Beifang Minzu University, China (Email: [email protected]).
Steve N.H. TSANG is with the Department of Systems Engineering and Engineering Management, City University of Hong Kong, Kowloon Tong, Hong Kong (Email: [email protected]).
Alan H.S. CHAN is with the Department of Systems Engineering and Engineering Management, City University of Hong Kong, Kowloon Tong, Hong Kong (Tel: (852) 2788 8439; Fax: (852) 2788 8423; Email: [email protected]).
improve response time and reduce human error, the design of control and display configurations should satisfy the expectations of the relevant user population. Posner [2] found that faster and more accurate responses were elicited when the precue and target occur on the same side and vice versa. Only few studies have been conducted to examine precuing effects in a dual-task paradigm in which participants have to primarily focus to a dynamic moving target while eliciting responses to a side task [3]. However, no studies have been conducted to investigate the spatial stimulus-response compatibility effect with the presence of precue in a dual-task paradigm. In consideration of the importance of spatial compatibility in human-machine interface design, it is essential to have a better understanding of the spatial stimulus-response compatibility effect with the presence of precue, particularly in a dual-task paradigm.
II. METHOD
A. Participant
Thirty six Chinese students (21 males and 15 females) aged between 20 and 24 (median = 20) from City University of Hong Kong participated in this experiment. Only one student was left-handers, while the others were right-handers. All of them had normal or corrected-to-normal vision and normal color vision. They all gave informed consent before the start of the experiment and did not report any physical or health problems involving their hands.
B. Apparatus and Design
In this experiment, a dual-task paradigm with a primary pursuit manual tracking task and a secondary spatial S-R compatibility (SRC) task was used for testing using a computer with a 17-inch LCD monitor. The primary tracking task comprised a 10 mm diameter circle target with a cross inside and a 5 x 5 mm ‘cross’ cursor within a field of 130 mm (width) x 130 mm (height) (15˚ x 15˚ at a viewing distance of 500 mm). A joystick was used to move the cursor for target tracking. A pilot study established an appropriate control-response ratio for joystick and cursor movement. The visual target trajectory was derived from three sine wave functions (0.07, 0.14, 0.23 Hz) with a random angle-translation function creating an unpredictable movement path. Note that because of the different levels of difficulties employed for the tracking task, the target trajectory and speed were adjusted accordingly with reference to the tracking task difficulty. Root mean square tracking
Influence of Precue on Spatial
Stimulus-Response Compatibility Effect
in a Dual-Task Paradigm
Ken S.S. MAN, Coskun DIZMEN, Steve N.H. TSANG and Alan H.S. CHAN
error (RMSTE) measured the average deviation of the cursor from the target in pixels.
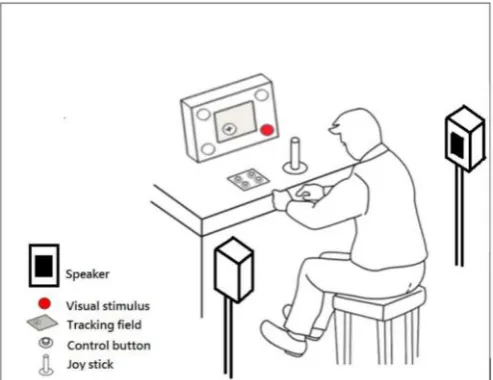
As for the secondary SRC task, the stimulus target signal was presented in visual, auditory, or tactile modality depending on the testing condition. In visual modality presentation, there were four 30 mm diameter circles separated by 160 mm in both horizontal and vertical dimensions to form a square representing front-right, front-left, rear-right, and rear-left positions and locating at the four corners of the tracking field with two visual precues at the middle position of both left and right (Fig. 1).
For the presentation of auditory precue, the two visual precues in the spatial compatibility task were transformed in form of auditory signals coming from two speakers located at ear level and to the both left and right positions at 500 mm from participants (Fig. 2). The auditory signal was a ‘Ding’ sound lasting for 700 ms. The ambient sound level was controlled to less than 50 dBA and a 790 Hz and 75 dBA tone was used as the auditory signal.
For the presentation of tactile precue, a Velcro belt with two tactors (2.54 cm x 1.85 cm x 1.07 cm, VBW32, Audiological Engineering Corp., Somerville, MA) attached was fastened around the participant’s waist for vibrotactile stimulation. Two tactors were positioned on the both left and right of the participant’s waist (Fig. 3). Because of the different body circumferences of different participants, the separation between the tactors was adjusted before the start of the experiment to guarantee the participant can clearly perceive the stimulation of the tactors from the left and right positions. Appropriate frequency and intensity level of the tactors were determined carefully to ensure they were sufficient for perceptible vibrotactile stimulation.
When participants received the signal from the SRC task, they needed to elicit a response on the basis of the mapping conditions being tested as fast as they can. A four keys (front-right, front-left, rear-right, and rear-left) custom-made control box interfaces with the computer for response inputs. There were four spatial S-R mapping conditions, viz. both transverse and longitudinal compatible (BC), transverse compatible and longitudinal incompatible (TC), longitudinal compatible and transverse incompatible (LC), and both transverse and longitudinal incompatible (BI). For the BC mapping, the stimuli and response keys were congruous in both longitudinal and transverse orientations such that participants will respond by pressing the front-right key for front-right signal and front-left key for front-left, and so on for the other congruous matched pairs. For the BI mapping, the S-R mappings were opposite and incongruous compared to those in the BC condition. For TC and the LC mappings, incongruous S-R mappings occurred in the longitudinal and the transverse orientations, respectively (Fig. 4).
[image:2.595.48.295.198.390.2] [image:2.595.306.553.224.409.2]In order to examine the precuing effect on the SRC task, prior to the presentation of the target of the SRC task, a precue in visual, auditory or tactile modality was given. The orthogonal cuing paradigm developed by Spence and Driver [4] was adopted in the experiment. With the orthogonal cuing paradigm, shifts of spatial attention can be measured by using an uninformative precue for subsequent target location. It was Fig. 3. Schematic diagrams for the experimental setup with tactile modality presentation of precue and visual modality presentation of stimulus for the spatial compatibility task. Note that two tactors attached on the left and right of the participant’s waist.
Fig. 1. Schematic diagrams for the experimental setup with visual modality presentation of precue and visual modality presentation of stimulus for the spatial compatibility task.
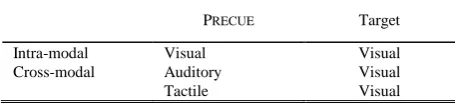
[image:2.595.48.295.546.736.2]said to be orthogonal because the spatial dimension of the irrelevant precues (left and right) was orthogonal to the spatial dimension of the targets (up and down). Specifically, the task of the participants was to make an up/down decision (response) immediately after the presentation of the precue appearing equiprobably on the ipsilateral (same) and the contralateral (opposite) side of the target. As the required up/down judgment for the target location was orthogonal to the left/right direction of the spatial uninformative precue, the response to the target thus was not be biased by the lateral position of the precue and so the precue should not prime a particular response. As a result, any facilitation in response performance can therefore be attributable to attentional cuing (i.e. a perceptual benefit facilitating subsequent responses) but not response priming by the cue. Three different stimulus onset asynchronies (SOAs), 200, 600, 1000 ms commonly used by researchers were tested in the experiment. The duration of the precue and the target were confirmed in the pilot test. Fig. 5 illustrates the precue-target presentation sequence of an auditory precue appearing on the same side as a visual target. Given that there were three modalities to be tested and that intra-modal and cross-modal precue-target pairings were to be examined, three different precue-target combinations were studied here (Table I).
C. Procedure
At the beginning of the experiment, adequate tracking practice was provided to each participant to make them familiar with the use of the joystick. Before each trial, participants used their dominant hand to control the joystick and the non-dominant hand rested at the central position of the discrete response control box. Each block contained 24 practice trials and 48 test trials. Additional practice was given as necessary to ensure that 24 correct trials were achieved in the practice session before test trials started. Each test trial started with the presentation of the visual target circle and the cursor at the center of the display. The participant clicked the joystick button to initiate target movement, and then manipulated the joystick to move the cross so as to try to
superimpose it onto the target circle. After a random delay of 1-4 s, one of the two precues signals located on both right-hand side and left-hand side in different modalities according to the task requirement was presented. Right after the random SOA (200, 600, or 1000 ms), one of the four circles on the monitor positioned at four corners of the monitor was lit up. Upon detecting the signal, participants needed to press an appropriate key with their index finger (for right keys) or middle finger (for left keys) of the left hand according to the mapping condition being tested. The circle was lit up for 1 s or until a response was given, and was then reset and a new trial presented after a random delay of 1-4 s. The time elapsed from the onset of stimulus presentation to response detection was taken as the reaction time (RT). A response made after 1 s was considered as a miss, and a make-up trial was given at the end of the block. Make-up trials were also given for the incorrect responses. No feedback on the accuracy of the S-R compatibility task was given.
III. RESULT
A. Primary Task – Root Mean Square Tracking Error (RMSTE)
In this study, tracking performance was measured using root mean square tracking error (RMSTE), which is the difference in pixel deviation between tracked target and the following cursor.
For four S-R mapping conditions, altogether, 144 (36 participants x 4 conditions) RMSTEs were obtained. The range of the values was between 13.64 and 85.19 pixels. 1 (0.69%) outlier RMSTEs beyond the upper control limit (+3σ) of 73.59 pixels was excluded from analysis. The average RMSTEs and standard deviations under the four S-R mapping conditions are summarized as Table II. Of the four mappings, the average RMSTE for LC was the lowest (31.77 pixels), while that for TC was the highest (35.45 pixels). The RMSTE for LC was 6.32%, 5.82% and 10.38%, respectively lower than that for BC, BI and TC. Further examination of RMSTEs was performed with analysis of variance (ANOVA). The main factor considered was S-R mapping condition (BC, Fig. 5. An illustration of the precue-target stimulus presentation with an auditory precue and a visual target. After a random delay of 1 – 4 s, an auditory precue (a ‘Ding’ sound) was presented from the speaker on the left hand side of the participant. Right after the random SOA (200, 600, or 1000 ms), the target appears orthogonal (up here) to the side of the precue (left here). Note that the impending target had 50% chance (equiprobable) on the same (ipsilateral) side or opposite (contralateral) side of the precue. The figure shows the precue-target pairing appears on the same side.
TABLEI
THE PRECUE-TARGET COMBINATIONS FOR UNIMODAL PRECUING
PRECUE Target
Intra-modal Visual Visual
Cross-modal Auditory Visual
[image:3.595.311.547.293.429.2]Tactile Visual
[image:3.595.51.291.360.486.2] [image:3.595.46.274.542.595.2]BI, LC and TC). The results showed the spatial stimulus-response mapping condition (p > 0.05) was not significant for RMSTE.
B. Secondary Task- Reaction Time (RT)
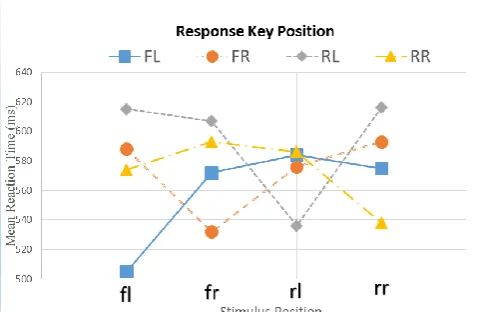
For four S-R mapping conditions, there were altogether 7329 responses (36 participants x 4 conditions x 48 trials + 417 complementary trials for missing and incorrect responses) collected in the spatial compatibility task. For the 6912 (94.31%) correct responses, the mean and standard deviation of the reaction times (RTs) were 574 and 130 ms, respectively. Altogether, 37 outlier reaction times beyond the upper and lower control limits (±3σ) of 966 and 183 ms, respectively, were discarded from analysis. A total of 6875 responses (mean = 572 ms, SD = 127 ms) were thus scrutinized for further analysis. Table III summarizes the mean reaction times computed for different stimulus positions (fl, fr, rl, and rr) and response key positions (FL, FR, RL, and RR). The shortest mean reaction time (505 ms) was obtained from responses to the fl stimulus with the FL response key, while the longest mean reaction time (616 ms) was to the rr stimulus with the RL response key. The response time for different stimulus positions ranged from 568 (fl and rl) to 578 (rr) ms. The reaction times for FL, FR, RL, and RR key positions were 558, 571, 590, and 571 ms, respectively. The data in Table III indicate that the relative positions of visual stimulus and responses key contributed to the differences in reaction times and particular S-R mappings would lead to faster responses. Table IV summarizes the mean reaction times for different mapping conditions. The fastest reaction time was obtained for the BC condition (526 ms) in which stimulus and response positions were correspondingly matched in both the transverse and longitudinal orientations. For the other three conditions with one or no orientation compatibly mapped, surprisingly, BI was not the one with the longest mean reaction time. Rather, the slowest response (593 ms) was found with the TC condition. The mean reaction time of BC condition was 10.46%, 11.79%, and 12.74% shorter than that of BI, LC, and TC conditions, respectively. Overall, the average size of compatibility effects was a reduction of 61.33 ms (11.66%) in reaction time when compatibility existed in both orientations.
Further examination of reaction times was conducted using the repeated-measure analysis of variance (ANOVA). The main factors were stimulus position (fl, fr, rl, and rr) and response position (FL, FR, RL, and RR). As the sphericity assumption for the within-subject factor of stimulus position was violated, a Greenhouse–Geisser epsilon was applied to
adjust the degrees of freedom for that factor [5]. The results showed that both the stimulus position [F(2.99,1286.65)=3.99,p < 0.05] and response position [F(3,1293)=29.61,p < 0.0001] were significant and their two-way interaction was also significant [F(9,3879)=3.99,p < 0.0001]. Fig. 6 shows the interaction plot of stimulus position and response key position. Among the sixteen stimulus-key mappings, fl stimulus position responded with FL key resulted in the fastest reaction time (504 ms), while the reaction time for rr stimulus pairing with RL key was the slowest (614 ms). From the interaction plot, the four pairs of corresponding stimulus and response key positions (fl-FL, fr-FR, rl-RL, rr-RR) always exhibited faster reaction times than other stimulus-key mappings, implying that if the mappings were compatible in both transverse and longitudinal orientations (BC), the reaction times elicited were always the shortest (Fig. 6). Among the three incompatible cases, incompatibility in the longitudinal orientation (TC) led to the longest reaction time. The relatively slower performance in this condition indicated that a reverse in front-rear position of the stimulus-key relation was the most confusing to the participants and additional translation time was required for them to recognize the correct responses.
TABLEIV
MEAN REACTION TIMES (RTS) AND STANDARD DEVIATIONS (SDS) FOR DIFFERENT S-R MAPPINGS
S-R Mapping Mean
RT (ms) SD (ms) Both transverse and
longitudinal compatible (BC)
526 131
Both transverse and
longitudinal incompatible (BI) 581 120 Longitudinal compatible and
transverse incompatible (LC)
588 123
Transverse compatible and
longitudinal incompatible (TC) 593 124 TABLEIII
MEAN REACTION TIMES (RTS) FOR DIFFERENT STIMULUS POSITIONS AND RESPONSE KEY POSITIONS
Stimulus Position
Response Key Position
MEAN RT
(MS) SD (ms)
fl FL 504S 122
FR 586 130
RL 607 125
RR 574 117
fr FL 570 111
FR 532 136
RL 604 123
RR 592 122
rl FL 583 120
FR 574 116
RL 533 130
RR 583 122
rr FL 573 121
FR 591 128
RL 614L 124
RR 535 140
S=The shortest mean reaction time; L=The longest mean reaction time TABLEII
AVERAGE ROOT MEAN SQUARE TRACKING ERRORS (RMSTES) AND
STANDARD DEVIATIONS (SDS) FOR DIFFERENT S-R MAPPINGS
S-R Mapping
AVERAGE
RMSTE (PIXEL)
SD (pixel)
Both transverse and longitudinal compatible (BC)
33.91 14.56
Both transverse and
longitudinal incompatible (BI)
33.73 12.30
Longitudinal compatible and transverse incompatible (LC)
31.77 10.81
Transverse compatible and longitudinal incompatible (TC)
C. Secondary Task –Response Error
For four S-R mapping conditions, a total of 417 (5.69%) incorrect or missing responses (responses made after the time limit of 1 s) were recorded. The percentages of incorrect and missing responses were 1.05% and 4.64%, respectively. The mean error percentages (EPs) computed for different S-R mappings are summarized in Table V. Among the four mapping conditions, BC exhibited the smallest EP (3.18%), while EP for BI was the highest (5.36%). Because the EP data represent a non-normal distribution, the non-parametric Kruskal-Wallis test was conducted for further analysis. The main factor examined was S-R mapping condition. The results showed that the main factor of S-R mapping (p > 0.05) was not significant.
IV. DISCUSSION
The aim of this study was to examine spatial stimulus-response compatibility effect with the presence of precue in a dual-task paradigm. The results obtained here showed that spatial stimulus-response compatibility effect was not significant for continuous response task. Moreover, the spatial S-R compatibility was significant to the reaction time of secondary discrete response task but not significant to the response error of that.
A. Primary Task – Root Mean Square Tracking Error (RMSTE)
Different mapping conditions required different coding demands [1], such that the duration of visual stimulus encoding, and hence the interference with the tracking task should be different. In previous spatial compatibility study [6], the average root mean square tracking error (RMSTE) for responses to the compatible (BC) condition was significantly
lower than that of the other three incompatible conditions. However, in this study, it was surprising that there was no significant difference among four mapping conditions with the presence of precue. The different results between the two studies were possibly due to the precuing effects.
With different types of precue, the difference in root mean square tracking error (RMSTE) was not obvious. This showed that no contributions to the performance of primary tracking task had been made by the presence of precue because the main function of precue was to remind participants that the signal needed a response will appear very soon, as a result, it made participants allocate their spatial resource capacity for the secondary task when precue was presented.
B. Secondary Task- Reaction Time (RT)
From the results of the secondary task, BC S-R mapping condition led to the fastest reaction time. Among the four mapping conditions, BC was by far the most direct and natural enabling participants to relatively easily encode the stimulus and swiftly produce the corresponding response. However, for the other three incompatible conditions, an extra process was needed to retrieve information about the indirect incompatible mapping between the stimulus and response from the cognitive declarative resource (responsible for long-term storage of information) so as to make a correct response. Therefore, it may be hypothesized that the significantly better response performance obtained from BC was due to the low demand that the compatible configuration made on the declarative resource.
With regard to the spatial compatibility effects, the results here indicated that compatibility in both orientations (BC condition) gave 11.66% decrease in response times. It was believed that the better performance stemmed from the natural tendency to respond in the direction of stimulation, demanding less recoding and a higher rate of information transfer during the response process [5], [7]-[9]. Among other three mapping conditions (TC, LC and BI), surprisingly, the TC condition led to the longest reaction time (593 ms) instead of BI. The speculated reason for this, as reported by some of the participants, the BI condition could be treated as just diagonally reversed, such that there was only one incompatible orientation, diagonal incompatibility, instead of two. Thus, the coding demand for BI may not be as heavy as expected. On the contrary, Chan and Chan [10], [11] using a similar stimulus-response setting, reported the LC condition produced the longest reaction time instead of the TC condition as in this study. They suggested that the response time advantage of TC over LC could be explained by the existence of a right-left prevalence in spatial compatibility. In both of their studies, the participants were instructed to use either two feet or two hands for responses, in which the two effectors were coded on an anatomical right-left dimension, providing a relative salient frame of reference in the horizontal right-left dimension and leading to better performance under the transverse (right-left) compatible conditions (BC and TC) than transverse incompatible conditions (BI and LC). However, in this study, the participants made responses by using only their left hand, while the right hand was responsible for the tracking task. With unimanual two-finger responses of the left hand, the TABLEV
MEAN REACTION TIMES (RTS) AND STANDARD DEVIATIONS (SDS) FOR DIFFERENT S-R MAPPINGS
S-R Mapping Mean
percentage SD Both transverse and
longitudinal compatible (BC)
3.18% 3.68%
Both transverse and
longitudinal incompatible (BI)
5.36% 5.80%
Longitudinal compatible and
transverse incompatible (LC) 5.14% 5.78% Transverse compatible and
longitudinal incompatible (TC)
[image:5.595.47.292.53.209.2]3.93% 4.99%
right-left prevalence was absent [12].
C. Secondary Task –Response Error
In this experiment, there were only a few response errors and these were found to be insignificant with regard to the mapping conditions indicating participants did not respond to the spatial mapping task at the expense of accuracy, or, it may be that they emphasized response accuracy more than response time despite of being told to respond as fast and accurately as they could.
V. CONCLUSION
In summary, this study examined spatial stimulus-response compatibility effect with the presence of precue in a dual-task paradigm. The effect of S-R mapping condition became insignificant on the performance of primary tracking task with the presence of precue. As discussed above, precuing effect was found to shift spatial resources of participants to secondary discrete task. There was still a significant effect of S-R mapping condition on the reaction time of secondary discrete task with the presence of precue. BC (both transverse and longitudinal compatible) S-R mapping condition still resulted in better response performance. BI (both transverse and longitudinal incompatible) condition may not lead to the worst reaction time due to its being regarded as diagonally incompatible. However, more research effort is needed to assess the improvement of the use of precue in such condition. As a result of this study, it is suggested that precue can be used with stimulus-response compatibility effect to improve the performance of a discrete response task in a dual-task paradigm where requires concurrent manual operation for a continuous task and a discrete choice response task.
REFERENCES
[1] Umiltá, C. and Nicoletti, R., “Spatial stimulus-response compatibility,” In: R.W. Proctor and T.G. Reeve, eds.
Stimulus-response Compatibility: An Integrated Perspective.
Amsterdam: North-Holland, 1990, pp. 89-116.
[2] Posner, M.I., “Orienting of attention,” Quarterly Journal of
Experimental Psychology, vol. 32, no. 1, pp. 3–25, Feb. 1980.
[3] Ferris, T.K. and Sarter, N.B., “Cross-modal links among vision, audition, and touch in complex environments,” Human Factors: The
Journal of the Human Factors and Ergonomics Society, vol. 50, no. 1,
pp. 17–26, Feb. 2008.
[4] Spence, C.J. and Driver, J., “Covert spatial orienting in audition: Exogenous and endogenous mechanisms,” Journal of Experimental
Psychology: Human Perception and Performance, vol. 20, no. 3, pp.
555–574, Jun. 1994.
[5] Leech, N.L., Barrett, K.C. and Morgan, G.A., “SPSS for intermediate statistics: Use and interpretation,” Psychology Press, 2005, pp. 151. [6] Tsang N.H., “Multi-task Performance in Processing Four-choice
Spatial Stimulus-Response (S-R) Mappings: Implications for Multimodal Human-machine Interface Design,” P.h.D dissertation, Dept. S.E.E.M., City University Hong Kong, Hong Kong, 2014. [7] Proctor, R.W. and Vu, K.L., “Stimulus-Response Compatibility
Principles: Data, Theory, and Application,” Boca Raton: CRC Press, 2006.
[8] Chan, A.H.S. and Chan, K.W.L., “Three-dimensional spatial stimulus–response (S–R) compatibility for visual signals with hand and foot controls,” Applied Ergonomics, vol. 41, no. 6, pp. 840-848, Oct. 2010.
[9] Chan, K.W.L. and Chan, A.H.S., “Spatial stimulus response compatibility for a horizontal visual display with hand and foot controls,” Ergonomics, vol. 54, no. 3, pp. 233-245, Mar. 2011. [10] Chan, K.W.L. and Chan, A.H.S., “Spatial stimulus–response (S-R)
compatibility for foot controls with visual displays,” International
Journal of Industrial Ergonomics, vol. 39, no. 2, pp. 396-402, Mar.
2009.
[11] Chan, K.W.L. and Chan, A.H.S., “Spatial stimulus-response (SR) compatibility effect for hand controls with visual signals on horizontal plane,” Proceedings of the International MultiConference of
Engineers and Computer Scientists, vol. 2, pp. 1974-1976. 2009.
[12] Vu, K. P. L., and Proctor, R. W., “Determinants of right–left and top–bottom prevalence for two-dimensional spatial compatibility,”
Journal of Experimental Psychology: Human Perception and