ENERGY USE AND ENERGY TECHNOLOGIES ON THE UNIVERSITY OF CANTERBURY CAMPUS
A thesis presented in fulfillment of the requirements for the degree
of
Master of Engineering in the
University of Canterbury
by R.W. Tromop
Building energy systems and the use of energy in an institution, (The University of Canterbury's Ilam campus) are .investigated in this report. The existing installed systems are analysed and alternative "State of the Art" building energy systems are investigated. While technical and economic factors are the main criteria by which these systems are judged, commercial acceptability in New Zealand has also been a major concern.
section 1 details existing campus building energy systems. section 2 examines the following alternative systems:
1. Peak Shaving of electrical demand peaks, is compared with energy cost savings from electrical load reductions.
2. Provision of both heat and electricity needs for the campus by combined Heat and Power (CHP) plant. A CHP plant analysis spreadsheet was developed to help determine the performance of the plant under the varying simultaneous heat and electrical loads on the campus.
3. Alternative air conditioning systems are examined including, centralised distriCt cooling schemes, evaporative cooling, and cold thermal storage.
ACKNOWLEDGEMENTS
I would like to thank my superviser, Dr G J Parker, Senior Lecturer in the Department of Mechanical Engineering of the University of Canterbury. He has provided valued guidance throughout this study.
Professor A Williamson (Chemical and Process Engineering) and Dr A Tucker (Mechanical Engineering) have both provided helpful input in specific areas.
INTRODUCTION. 1
SECTION 1 EXISTING SYSTEMS 2
'1.1 ELECTRICAL SYSTEM 2
1.1.1 CAMPUS ELECTRICAL SUPPLY AND DISTRIBUTION. 2 1.1.2 ELECTRICITY PRICING STRUCTURE 4
Other Applicable Tariffs. 8
Implications of ND6 Tariff 10
1.1.3 CAMPUS ELECTRICITY CONSUMPTION CHARACTERISTICS 12
Daily Demand. 12
Annual Electrical consumption. 14
1.1.4 NEW TARIFF STRUCTURES 16
1.2 CAMPUS STEAM HEATING SYSTEM 18
1.2.1 STEAM HEATING SYSTEM DESCRIPTION. 18
Heating System Performance. 20
Steam Production and Coal Consumption. 23
1.3 CAMPUS AIRCONDITIONING 26
Cooling Load Distribution 26
1.4 ENERGY MANAGEMENT AND CONTROL SYSTEM 28 System Architecture and Main Features 29
SECTION 2. ENERGY TECHNOLOGIES FOR CAMPUS 32
2.1 ELECTRICITY USE REDUCTION. 32
2.1.1 ELECTRICAL PEAK SHAVING. 32
Peak Shaving System Costs. 35
2.1.2 ELECTRICAL LOAD REDUCTION. 36
Factors influencing CHP feasibility 39
2.2.1 CHP PLANT CHARACTERISTICS. 40
Steam Turbines. 40
Back Pressure and Pass out Turbines. 42
Gas Turbines 44
2.2.2 ASSSESSMENT OF FEASIBILITY OF CHP FOR CAMPUS. 48
Design Heat and Power Loads. 48
2.2.3 CHP SCHEME ANALYSIS RESULTS. 50 1. Back Pressure Turbine, 7 Bar Exhaust Pressure. 50 2. Pass Out Turbine, 7 Bar Pass Out Pressure. 56 3. Gas Turbine, Waste Heat Recovery Boiler. 60 Discussion of CHP analysis results 64
2.3 CAMPUS AIR CONDITIONING SYSTEMS. 66
2.4
2.3.1 THE REQUIREMENT FOR AIR CONDITIONING. 2.3.2 DISTRICT COOLING SCHEMES.
2.3.3 EVAPORATIVE COOLING
Evaporative Cooling of Air
Evaporative Cooling of Chilled Water Evaporative cooling and Legionaires 2.3.4 Discussion
-
Campus coolingTHERMAL STORAGE SYSTEMS.
2.4.1 THERMAL STORAGE BENEFITS. 2.4.2 COOLING THERMAL STORAGE.
2.4.3 CHILLED WATER STORAGE SYSTEMS. 2.4.4 ICE STORAGE SYSTEMS.
Ice Store System Configurations chiller / Store Arrangements
Desease
66 68 74 75 78 82 83
e4
84 84 86 ~O
9/t,
2.4.5 ICE STORE OPERATING STRATEGY FOR THE CAMPUS. 100
2.4.6 ALTERNATIVE SYSTEMS. 102
2.4.7 HEATING THERMAL STORAGE. 103
2.4.8 DISCUSSION - THERMAL STORAGE SYSTEMS 103. 2.5 CONVERSION FROM STEAM TO HOT WATER HEATING. 105 2.5.1 STEAM TO HOT WATER CONVERSIONS. 105 Pressure and Temperature constraints 107 Steam / Hot Water operating differences 107 2.5.2 STEAM / HOT WATER HEATING ANALYSIS RESULTS. 109
2.6 CONCLUSIONS. 112
APPENDICES 114
A BACK PRESSURE TURBINE PERFORMANCE CALCULATIONS 114 B PASS OUT TURBINE PERFORMANCE CALCULATIONS
C GAS TURBINE PERFORMANCE CALCULATIONS D CHP SYSTEM ANALYSIS SPREADSHEET SAMPLE E STEAM TO HOT WATER CONVERSION CALCULATIONS REFERENCES
FIGURE NO 1.1 1.2 1.3 1.4 1.5 1.6 1.7 2.1 2.2 2.3 2.4 2.5 2.6 2.7 2.8 2.9 2.10
LIST OF FIGURES
TITLE
11kV distribution mains
Coincident Demand Tariff ND6 Daily Electrical Demand Profiles Annual Electrical Consumption Steam Distribution Mains
Daily Steam Demand Profiles Annual Coal consumption
Cheng Cycle CHP Operating Range
Back Pressure Turbine Steam Consumption Pass out Turbine Steam Consumption
Direct
&
Indirect Evaporative CoolingPAGE 3 5 13 15 19 24 25 47 51 58 77 Evaporative Cooling Temperature Constraints 79 Evaporative Chilling with Thermal Storage 81 Multiple Tank Chilled Water Storage System
89
Ice Storage Systems 93
TABLE NO TITLE PAGE
Effy Eisen EUF GJ h hex hex(s) hf hg hin hout hout (s) hpo hpo(s) kg kJ kW kWh kV kVA LPHW NOMENCLATURE Efficiency
Isentropic Efficiency (of a turbine) Energy Utilisation Factor
EUF = Total Energy in / Total Energy out
Giga Joule
Specific Enthalpy
Spec. Enthalpy at turbine exhaust
Spec. Enthalpy at exhaust pressure with same spec. Entropy as inlet condition Spec. Enthalpy of liquid state
Spec. Enthalpy of gaseous state Spec. Enthalpy at inlet
Spec. Enthalpy at output
Spec. Enthalpy at entropy
=
entropy at Spec. Enthalpy at pass out conditioninlet
Spec. Enthalpy at pass out condition with same spec. Entropy as
kilogram kilojoule kilowatt
kilowatt hour kilovolt
kilovoltamp
Low Pressure Hot Water
inlet condition.
MW MWh
'Q
Qbal Qin Qout
W
Wbal Wout
$M
Megawatt
Megawatt hour Heat
Heat balance (of a CHP plant) Heat input (of a CHP plant) Heat output (of a CHP plant)
MW MW MW MW Power (Electrical load or output of CHP plant) MW Power (electrical) balance of CHP plant MW
Power output (of CHP plant) MW
1
INTRODUCTION
50% of the nett energy used in the UK economy is consumed in buildings, with industry using 29% and institutions and domestic dwellings the remaining 21%. [DUNSTAN I.]
While the UK climate, social and industrial situation is to an extent quite different to that of New Zealand's, the above values give an indication of the extent of energy use in the variety of buildings in most developed countries.
Commonly used energy conservation techniques popular since the 1970's oil crisis, based on loss reduction and load control, are generally applied throughout society and industry, giving significant energy and economic returns for little capital investment. However a stage is reached with conservative techniques where the performance limits of the (usually old) installed building plant fall well below the performance of more energy efficient state of the art building energy systems.
Industry and large institutions are of concern as the
-density of energy loads within these buildings are generally higher than those of dwellings.
In most cases i t is difficult to remove existing building energy systems and install new state of the art systems, however existing plant can be modified, and new energy efficient systems can be installed in new buildings.
1 EXISTING SYSTEMS. 1.1 ELECTRICAL SYSTEM.
1.1.1 CAMPUS ELECTRICAL SUPPLY AND DISTRIBUTION.
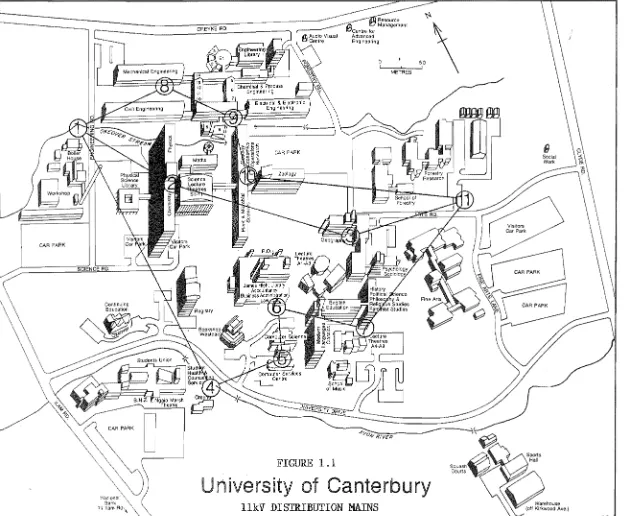
The University of Canterbury currently purchases its electrical supply from Southpower, the local electrical supply authority. Electrical supply is at 11kV, fed from both Fendalton Rd, and Ilam Rd sUbstations,to an 11kV distribution ring main supplying eleven campus substations with 11kV/415V transformers, Figure 1.1 shows the campus high voltage electrical distribution system.
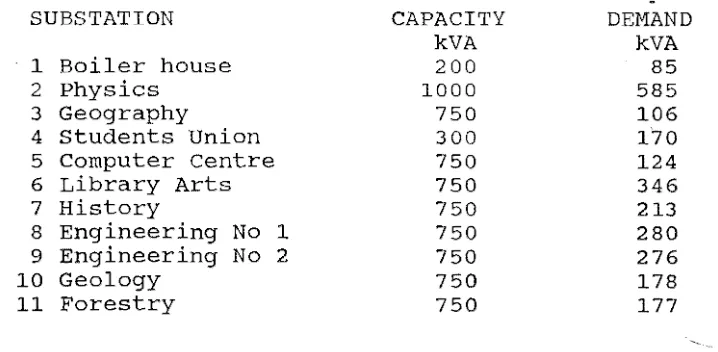
A 1987 report "Review of HT (11kV) Distribution" prepared for the university by the Ministry of Works and Development surveyed the installed electrical distribution system, its current performance, and capacity for future increase in demand. Table 1.1 below gives the installed capacity and present actual demand for the campus sUbstation transformers.
TABLE 1.1. CAPACITY AND DEMAND OF CAMPUS SUBSTATIONS.
SUBSTATION CAPACITY DEMAND
kVA kVA
1 Boiler house 200 85
2 Physics 1000 585
3 Geography 750 106
4 Students Union 300 170
5 Computer Centre 750 124
6 Library Arts 750 346
7 History 750 213
8 Engineering No 1 750 280
9 Engineering No 2 750 276
10 Geology 750 178
[image:12.595.144.503.521.697.2]'lA
.\
CAR PARK
FIGURE 1.1
iversity of Canterbury
[image:13.841.118.743.38.554.2]It should be noted that while under the current state of reduced governmental support for the universities, little of the planned building program is likely to proceed in the near future. However all parts of the campus electrical distribution system are generously sized and in good order, and will easily accomodate significant development if required.
1.1.2 ELECTRICITY PRICING STRUCTURE.
Towards the end of this study the electrical supply tariffs offered by Southpower were altered with .a greater emphasis put on supply capacity delivered to a consumer. Although this is still a function of peak demand, the emphasis on demand peak charges has been reduced. The following discussion covers the earlier supply tariff, with comparisons being made to the new tariff in section 1.1.4. New Tariff structures.
The university purchased its electrical supply from Southpower under the ND6 coincident demand tariff, which was applicable to large non domestic users. Billing was on a monthly basis, and took into account factors such as, winter or summer rates, an energy charge, and charges based on electrical demand peaks, and demand peaks coincident with Southpower and Electricorp peaks, during the year up to the current month.
PAI::T D -.!.!C!~~~=--=='-'-""-'--"=
PAreT A - SUpol Y CHARe::: (VARIABLE pop-nON)
...u-KU!
~
--rl--'4--
---'''YTlM(. N CD""11?ACr p(R-mo
PART iI . ':>YS,EM CEJvlAND CHARCe:
J-I).Lf HOUI:Z
CE:J...1A).J0',)
WITH UED
P€.Alo:. D£,;.;\ANQ5
- --
-~-11
p,T' MAY" ,:;0 ... 5E.PTE\.1~
P'~T C • ~:t:.!5:~~--'===...:.~~
H .... , HOU2
DEUAN:lS
w€l?ACE OF SX .... 1C.H(51
O'F"
AVE!Z)I(.E
____ -_ .. __ +"" ""--CF' ACTUAL
DAVS BETWE€.N
aDO - 1030 HOURS
1'",: JL.J".Je.: 3'''1' Al"I'::,U'ST
CO'-JCIOE>J r D<MAIJOS ( .. "", b )
/..'lAY 12.
8
7
/)
C£IJTS 5\
0
0
0
PER 4
'Wh
V / / / 1/1 1 _ _ _ _ _
<XXlO lZOO 18OC)
TIU( - waX[}A.YS
II
s
o ,.!'>Q ~ ~ , . ~Q.,,",,
co-m; S
~ER 4
kWh
18
=0
1200 1000TIME - WEEkDAYS .;
j.JQTE::· Ci':OSS C't'i""~ES ($I(,J()TED
---_.-FIGmm 1.2 ND6 TARIFF
e
7
~
N
,4CO ocoo
SJMMER
1'~1 OCToaER -;:J;J<f.,. AP~n. ..
§
~
SI
N
o.2Q
'1
L,
"
5 C:DJTS
PE~ <I
kWh
2<00 coco
WI)0TER
, .. r UAV - 30"101 S£PT'EM~
000 12C>C.'l i&:X)
TM€. - WCO«"-OS
~
. ' Je!,CO ,200 leeo
1M,- -w~f.kOJOS
The ND6 tariff consisted of .the following components; A. Supply Charge.
1) Fixed portion - $6.90 per day per metering position. 2) Variable portion (llkV supply) - $28.80 per kVA of the average of the six highest half hour consumers demand peaks occuring anytime in the financial year to date. Only one demand peak per day will be charged. Any supply charge paid to date in the current financial year is subtracted from this charge, the remaining amount is di v ided by the number of billing periods remaining in the current financial year. This amount is the amount charged for that billing period
B. System Demand Charge;
$66.84 per kVA of the average of the six half hour consumers demand levels coinciding with the six highest demand peaks of the Southpower supply system in the five month winter billing period, (1st May to 31st September), with no more than one demand peak charged in anyone day. Any system demand charge paid to date in the current financial year is subtracted from this charge, the remaining amount is divided by the number of billing periods remaining in the current financial year. This amount is the amount charged for that billing period
C. Coincident Demand charge;
7 August inclusive. There will be a minimum of six and a maximum of twelve notifiable days in this period.
(Southpower was charged by the Electricity Corporation on the average of the six highest half hour demands incurred with the restriction of no more than one per day or two per working week.)
Any coincident demand charges paid to date in the current financial year were subtracted from this charge, the remaining amount was divided by the number of billing periods remaining in the current financial year. This amount was the amount charged for that billing period.
D. Fixed Energy Charge
1) Summer energy (1st October to 30th April)
7.00am to 11.00pm Monday to Friday. 4.45c/kWh 7.00am to 11.00pm All other days 3.78c/kWh 11.00pm to 7.00am Night rate power 3.27c/kWh 2) winter energy (1st May to 30th September)
7.00am to 11.00am Monday to Friday 7.59c/kWh 11.00am to 3.00pm.Monday to Friday 6.29c/kWh 3.00pm to 9.00pm Monday to Friday 7. 59c/kWh 9.00pm to 11.00pm Monday to Friday 6.29c/kWh 7.00pm to 11.00am All other days 5. 38c/kWh 11.00pm to 7.00am Night rate power 3.27c/kWh The bulk supply tariff contract that Southpower had with Electricorp terminated on the 30th of September 1989. Changes
in tariffs occured after that time.
A Total Load Indicator System (TLIS) was introduced by Southpower, to indicate to consumers, via a VHF signal the total load on the Southpower system. The Southpower peak load is about 450 MW
Currently the half hour coincident peak demand periods are determined retrospectively by Electricorp, and charged on to the supply authorities.
other Applicable Tariffs.
The only other suitable tariff for a large consumer such as the University was the ND4 Non Domestic Bulk Supply tariff. This tariff comprises the following components;
A. Energy charge;
6.27c/kWh at any time B. Demand Charge;
$9.40 per kVA per month. Measured by a Maximum Demand Indicator which is reset each monthly billing period.
C. Supply Charge;
55c per day for each metered installation
A discount of up to 2.5% is available to consumers with their own transformers and 11kV metering.
In the Ministry of Works and Development report; "University of Canterbury Ilam Energy Investigations" the total charges for the University, using either ND4 or ND6 tariffs were compared for the following periods;
22 Nov 1985 to 31 May 1986 (Summer) 1 Apr 1986 to 23 Sept 1987 (Winter)
9
consumer faces flat energy and demand rates, which reflect the costs of an expected consumer demand profile, plus a cost associated with the risk of the consumer drawing heavy demands at times when the supply authority faces large demands.
For a consumer with an unavoidable constant demand at peak times, and little or no demand at off peak times, ND4 may be a more appropriate tariff than ND6, as that consumer will likely be unable to make use of significant amounts of cheaper off peak power. However if a consumer is able to maximise power consumption during off peak periods, then ND6 is likely to be a better tariff structure to operate within.
An important aspect of any comparison of the two tariffs is that in ND4 the consumers demand peak recorded for that month determines the demand charge for that month only, while under the ND6 tariff the consumers demand peak for any particular day may contribute to the demand charge for the next twelve months. Because the demand charge is based on the average of the six highest consumers demands in the financial year to date, an extraordinary demand peak (although i t is averaged out with the five next highest demands) will increase demand charges by up to $183.24 per kVA of the increase in average demand.
Implications of ND6 Tariff.
The methods of charging employed in ND6 are of two types, energy charges,(Part A of the tariff ), and demand charges, (Parts B,C, and D of the tariff ).
Both energy charges and demand charges vary considerably for different periods, as the supply authority reflects in its charges the increasing marginal costs of extra generating capacity required at times of high power consumption. Southpower are simply charging a premium for power when the demand for that power is at a premium.
Energy charges may be reduced by the consumer by the following methods;
1. Minimise electrical consumption by using established energy saving techniques, such as automatic lighting control, solar shading, inSUlation standard improvement etc.
2. Maximising consumption during off peak periods, when lower charges are incurred. As' little thought appears to have gone into off peak power usage during the development of the campus this will probably require some alteration to existing methods of energy utilisation on campus. Essentially any electrical load that doesn I t require instantaneous consumption
of electrical power, at the time of demand, has potential for off peak usage when combined with suitable storage facilities to make up the time lag between consumption and usage of the electrical energy.
Demand charges may be reduced by the consumer by, the following methods;
-11 southpower system peaks and coincident demand periods. The reduction of a single kVA in coincident demand will save up to $183.00 per annum, (sum of the three demand charge components). This may be achieved by either, load shedding of any non essential electrical loads, and by rescheduling times of operation of some facilities and electrical equipment to avoid peaks in demand.
2. Peak shaving. Here demand over a certain level is satisfied by electricity generated by stand-by or base-load, alternater sets, within the consumers complex.
Generally peak shaving involves running the generating sets only during the period in which system and coincident peaks occur. without the notifiable days option which was withdrawn in May 1989, consumers have no way of knowing in advance of coincident demand days. This makes peak shaving an uncertain option as in order to be sure of reducing a coincident demand peak the consumer will have to guess the likely times these will occur, and run peak shaving generating plant for longer than necessary.
1.1.3 CAMPUS ELECTRICITY CONSUMPTION CHARACTERISTICS. Daily Demand.
Typical daily power consumption is fairly steady, and daily demand profiles are similar to those of any other comparable day.
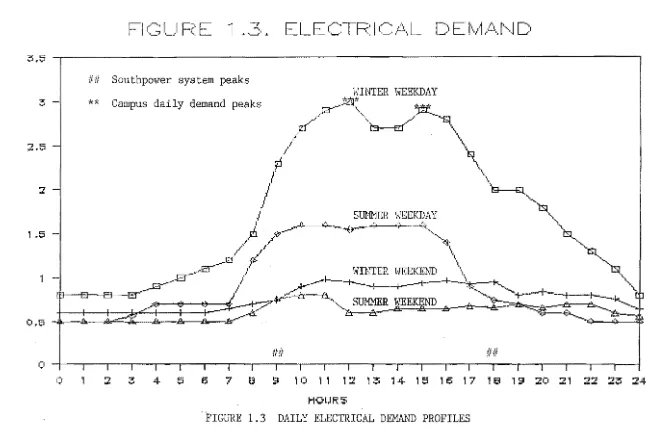
The campus daily electrical demand reaches maximum levels regularly at two distinct times;
11.30 to 11.45am, and 3.15 to 3.30pm.
Figure 1.3 shows a typical winter's weekday and weekend demand profiles, and a typical summer weekday and weekend demand profiles.
southpower system and coincident peaks, have occured consistantly at two distinct times;
9.00 to9.30am, and 5.45 to 6.15pm.
These are highlighted on the daily demand profiles of Figure 1.3. Up to 1989 the university's demand at coincident and demand peaks were up to 30% lower than the campus daily demand peaks. A typical example is the southpower supply demand peak drawn on the 16th of June 1988;
:3= ::e 0" z ...;( ::E La.! I::J ..J f~ D::
ti
I.IIJ _J I.I!JFI
(~~1.-,1
F;:~E
-1
~ ~ELE /'''TF-' I
... 1.,-,1 ~~ 1.1-'" /~,/_J, ..
/,
D Et'v'1
CI
;:i .. ~
Southpower system peaks
WINTER I.JEEKDAY
0.1';5 -.llir.
~r~
:2
**
Campus daily demand peaks . .I2t ... 3~~:" ~er:.._".., t... ..~. ~
171'/ '1s-E!'/ \
,....
"I \
I
'~
( .
P
.
.l \..,
I \
l
'S---t:t.
I ' ...
I ~
/
,S~!ER IfEEK~AY
.. , ...,I .... _...(:' ' ... --..",:;.-._ ... " .... '<"<"'"
'lsl
...J.. ' .:.:.0-.. . . . • ...
.IL.I .". ...~. ...
I I ~ _
/ /
\
,
....El'-....E /". WINTER WEEKEND '\ 'tSl.\
.-' / I- ~L +. '.
. .8' / .L.--_ .... --+---., I I - - - + - .
~
'"'-...-+-
....
~
/ ... - / ' .~-...
'01---t-I--~
'8 D D E r " . ..::;,~.
~'
-?'~..:.':.-~"'....
SUMMER WEEqj"ND ..!: --6:~-==b--."._ :a-~
... ,, __ ..
, / ... ." "-_---A r .... ~"-..
=_,
;I. ."., I I I-~"'.:::r--z::~ _.~~
I .' ...
. It J9r--~;( A A A----./s ...
3
-1 .~
-fill
,:;)-~ I I I I [ I I I I I I
I:'
,
:2 3 4- 0 S 7 6 5J 11:1
1 1 1:2 1:!i 1 4 1 ~ , 6 1 7 1 6 1 9 20:Z,
22 :2~ 24 HOtJR~FIGURE 1.3 DAILY ELECTRICAL DEMAND PROFILES
l-'
[image:23.842.103.749.77.505.2]campus, and required to be in operation during the day.
Many parts of the university function through the evening t i l l 11.00 pm. The libraries are in use until this time, as well as various post graduate studies, and cleaning staff are working at this time also.
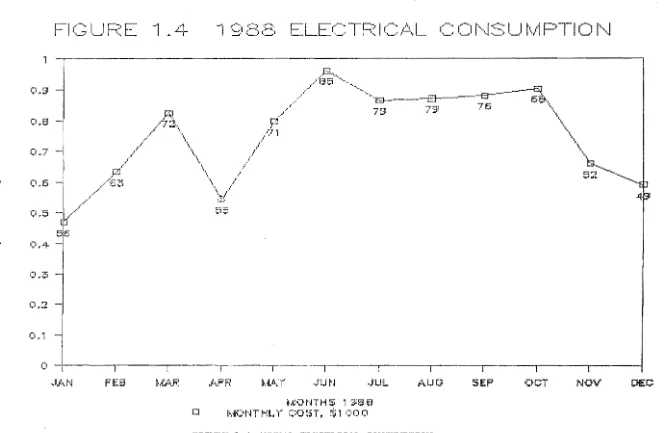
Annual Electrical Consumption.
Figure 1.4 shows the monthly consumption of electricity by the university in 1988. Both power consumption in MWh, and total monthly charges are shown for each month. The graphs show electrical consumption increasing over the university term, despite the fact that heating is provided by the steam heating system, and air conditioning plant is not heavily loaded during this time of the year. Increased use of the university facilities during term time, (which coincides with the winter electricity charging period), and reduced daylight hours, would be expected to increase electrical consumption during term time.
The total amount of electricity consumed in 1988 was 9.010 GWh, at a total charge of $838,465. This gives an average cost per unit of 9.31c/kWh over the year. ~
.r:
~
... E
."""
~,
z -0
I:] C .__ 1:1 f- ~1
Il... ::J ::E 0 ::l"c
rll t-:i~ .. _ ..
'~l
o
~t .SI
0.6 0.7 0,6 C'.5
t;) .4-0.;;5
Q,:Z
(L 1
t:;:t
FI (-'"
',_? F~:E-1 .. 4
-1
r-~ ~ (.-:' c·LE
(~'TF:I ',_J I...I
c'"
'-"'... 6 'tL
-.-.~
C-l
l._, ' - J
:S~
I
.
.J
t'·/1 PT I () f"J
.E...
.•.. ,.·~I ~ "'-'-"'_
(."'... ...,. .. ~ ....
-~ / ~
Lr
~
./ '"E3---_ _-e---=---e.I
.,
..
, ' "
~
,/ '
~"
\2l 79 7:lI7
6 6Ji.l.,
, , '
",/
'\
1'1
\
.
\ .'\
1 \ /
/ \ I '
..,{ \ / \
,...
\ ' ''"
"
\/
..,~
\ /'
,/ \ I '
/ ' \ I S
.
~
-" e o
9~----• 66 _.-
-;JAN ff~8
1
.A!.tlt..R
---, ---r---r--
I IJ\PR •. tAY .JU r~ .JUL AU C7
~.~ONTti 5 1 51166
o
l/o,401'.ITHLY COST, $1001:-1FIGURE 1.4 ANNUAL ELECTRICAL CONSUMPTION
~
SEF' 'OCT NOV !)£C
[image:25.841.101.765.69.502.2]1.1.4 New Tariff structures.
southpower introduced new tariff structures for all consumers in 1990.
The new tariff NM2, has a significantly reduced peak demand charge, however a new fixed capacity charge is
included. NM2 includes the following charges; A. Supply Charge
$7.06 per day per metering position B. capacity Charge
$13.32 per kVA capacity per day (for 11kV supply)
This is a fixed charge based on historical "registered demand" RD, and anticipated maximum demand "installed capacity" IC.
capacity
=
RD + {0.5(IC - RD)]The registered demand is based on the average of the six highest half hour demands of the previous twelve month billing period.
C. Demand Charge
17 D. Energy Charge
1) Summer energy (1st October to 30th April)
7.00am to 11.00pm Monday to Friday. 4. 61c/kWh 7.00am to 11.00pm All other days 3.94c/kWh 11.00pm to 7.00am Night rate power 3.38c/kWh 2) Winter energy (1st May to 30th September)
7.00am to 11.00am Monday to Friday 7. 88c/kWh 11.00am to 3.00pm.Monday to Friday 6. 53c/kWh 3.00pm to 9.00pm Monday to Friday 7.88c/kWh 9.00pm to 11.00pm Monday to Friday 6. 53c/kWh 7.00pm to 11.00am All other days 5. 63c/kWh 11.00pm to 7.00am Night rate power 3.38c/kWh
The capacity charge which is based on the consumers system demand still penalises .consumers with a high peak demand to base load consumption, although the demand charge is not as extreme as in the previous tariff.
The capacity charge will always be greater than the registered demand as the installed capacity is always greater than actual peak demand. For the University the installed capacity is about 7.5 MW and demand peak about 2.9 MW, so the capacity charge will be about 5.2 MW. This reflects the supply authorities need to charge for its obligation to supply the maximum demand a consumers installation is rated· for, rather than the peak demand the consumer is likely to draw. The consumer is required to pay for having oversized supply mains capacity f and because of this i t would obviously benefit
1.2. CAMPUS STEAM HEATING SYSTEM.
1.2.1 STEAM HEATING SYSTEM DESCRIPTION
The existing campus steam heating comprises of a central boilerhouse delivering dry saturated steam at 100 psi (6.89 bar) over the campus via a steam main distribution network in underground walk through ducts. Figure 1.5 shows the steam distribution network. Steam mains throughout the site are 150mm diameter, and run full diameter throughout the length of the underground ducts. The steam mains serving the School of Engineering are 100mm diameter.
Heat exchangers in each building provide low temperature hot water for building heating, and domestic hot water services. Condensate is returned to the boiler feed pumps by steam traps and condensate return pumps.
Steam is also supplied to the Department of Scientific and Industrial Research's, Ilam Research Centre in Creyke Road, and the Ministry of Forestry's, Forest Research Centre. Both these facilities are charged for steam consumed.
The University of Canterbury Student Union Recreation Centre, and the University Halls of Residence in Maidstone Road, are both suplied with medium temperature hot water by inground "Insapipe" pre insulated heating mains, via heat exchangers on the main steam heating system.
CAR PARK
---- ---- ---- Lpm~
~
[image:29.842.91.737.28.552.2]RIVER
FIGURE
1.]
University of Canterbury
STEAM DISTRIBUTION MAINS
\
...
boiler. This is still in service alongside the two larger Andersons boilers.
Coal feed to the main boilers is by John Thompson chain grate stokers, and the main boiler feed pumps are Wier steam driven boiler feed pumps.
Heating System Performance.
All the main boiler plant is in excellent order, regularly well maintained, and has given reliable service. It is reasonable to assume that this reliability can be maintained for a considerable time.
While steam traps are notoriously problematic, and require continual maintenance attention, they are generally located in easily accesible locations, and are promptly attended to when requiring attention. The use of medium or high temperature hot water, for heating reticulation throughout campus would be desirable from maintenance, and energy control and conservation criteria, however the current record of reliable service of the steam distribution system would make the economics of converting the existing system from a maintenance point of view alone questionable.
While the steam distribution system appears to function satisfactorily, there are problems with the heating system performance within individual buildings. In some cases the heating system is unable to achieve the heating levels required in offices around the campus.
This is confirmed by the high level of electrical demand experienced on cold winter days I particularly in the mornings.
"'-A recent cold spell"'-Aset a new record peak electrical demand
21 of 3.400 MW. Previously peak demands had always been at about 3. 000 MW, suggesting that there could be anything in the order of about 500 kW of personal electric resistance heaters scattered around campus.
The main reasons for the heating system problems appear to be due to changes in building usage over the almost thirty years of occupancy ( eg Office space modifications occurring without complementary modification of the heating system ). A common alteration appears to have been the conversion of large open plan offices into individual offices, with little consideration given to changes required to the control of the heating system. Anomalies in building shell construction and insulation play an important part in the current performance shortfalls of the system. Examples of this are ;
until recently the top floor roof of the main library building was uninsulated.
The Botany
I
Geology building has a high mass building construction, but with a poor level of insulation, requiring a heating system start up time in the morning of about 3. aDam, six hours before occupancy of the building.The Engineering school laboratory wi:qgs are partly heated by uninsulated steam pipes running the length of the laboratories down the north and south walls, with virtually no control.
While the above examples are extreme, the experience of
. "-.
maintenance staff is that similar problems exist to a degree in most buildings on campus.
were constructed, standards of building services control equipment were quite low. Current standards of quality of control are much higher, and upgrading of control equipment within buildings is being carried out by the maintenance department. Overall control of the heating system, and building services on campus is by a central computerised energy management and control system, (EMCS). The boilers are currently manually controlled by boiler attendants, but an automatic boiler control system is being installed, which will be supervised by the EMCS.
The increase in the level of comfort that is expected in buildings now, compared to the levels expected when the heating system was designed, only serves to make the above problems more conspicuous to the occupants.
It seems that the heating system components themself are adequately sized for the loads served, and that the boilers are providing sufficient steam to the heating system. Improvements to heating controls, building insulation, and the overall management of heating services by the energy management system, should be able to 'improve the performance of the heating system to a satisfactory standard, as well as reducing energy consumption.
23
1.2.2. STEAM PRODUCTION AND COAL CONSUMPTION.
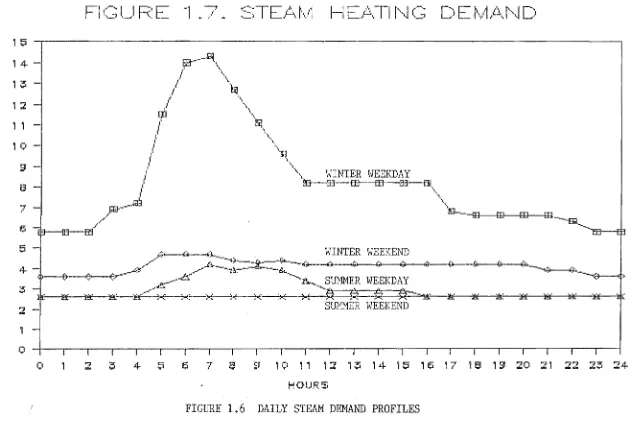
Figure 1.6 shows the steam demand profiles for the following typical days.
Winter weekdays and Winter weekends Summer weekdays and Summer weekends
The demands were developed from boiler steam flow recorders known to be inaccurate and as such give as good an indication of actual demands as possible. The winter weekday demand profile shows the maximum campus heating demand experienced on cold mid winter mornings.
The other demand profiles give an indication of the year round heating base load produced by 'domestic hot water demand and other miscellaneous heat loads.
~
L 0 z~
~ ~ z 1-~ :x:D
15
-r-'4--1
'I""" rn----.!d\ '." '\
I '.
1
:z
, 1
1 Q
9
e
7 e;;
l \.
I'
~I;ll \
~
\
..•.I•
lIq., '\I •
II \
,I 'KJ
I 'c
I ~
/ \... WINTER WEEKDAY
I ~j--ffi--EEJ--'flj-fil
I
\
~ \
~~---~ .~
./ ~---m
EI:I---fB--m/ ""-.."l93---ffi
13
-5
4-3
:2
:;."~'---";~ _ _ ';;I..._ , WINTER WEEKEND , . ".
r' . . '. -~:""::....--""""---,,;;..._~ .-:-. (jI--,,-4,l--.(:.----I;t---I;!_~~._
. " .. ~ .... ~--...~--~~--dc... "'_~ -(T--';;I-~T"'-...A!!' ___ ..e.s~",.
• .
. ...
:a...
SUMMER WEEKDAY.. .er
...
~-;O;- ~~_._.. . ... _r'--=-. ':'" _~"'=----:..,.: • 7-'~~"'~
ll!L~:'-:t!l:--- ,.~. - 7'. " . , - , - - SUMMER WEEKEND
,
0 I~--I
o
:;:
3 4- 5 ~ 7e
9 1 '~I l ' 1:2 13 14· 15 1 liS 17 1e ,
9 :ZC:1 :2' 22 2~ :24HOlJR5
FIGURE 1.6 DAlLY STEAM DEMAND PROFILES
N [image:34.841.118.750.86.531.2]L
f----(l)
(() o o IDo
o to. o o I.I.l I I-o
o .q-1VO~ E3NNGl Cto
>
f-0 Z I-r-.Oo
[L -Lil lfji (;} r:l-..;( ..! r- ::J-'"} Z I- ::J-'"} I-;~~
rt:r-~
I-~
ID I-Lil I.iI.. 25 Z 0 H~
ID fQ ID 0 t:I't U Ii)~
I Ul-I
z
1.3 CAMPUS AIR CONDITIONING. Cooling Load Distribution.
The university campus comprises many buildings spread over an area of 20 hectares. While there is a centralised heating system, the cooling requirements of the campus have always been met by the installation of individual "current state of the art" air conditioning plants when the buildings where constru<;:!ted. The anticipation of a maj or building program in 1986 provided the initiative for an assesment of the state of the campus cooling systems. The Ministry of Works and Development (now Works Corporation of New Zealand) prepared a report titled "University of Canterbury Chilled Water Investigations."
The following section is a summary of the campus cooling systems based on the MOWD Chilled Water Investigations Cooling load Distribution
A breakdown of cooling requirements on campus is as follows;
Comfort Air Conditioning (Lecture theatres etc) 66% Library Air Conditioning (Hight, Science, and Eng'g) 14%
Computer 8%
Specialist 12%
The largest users are the library and lecture theatres with a combined load of 80% of the total load. Computer cooling load is due to the computer centre. Remaining cooling loads are of small capacity and are spread out over many buildings.
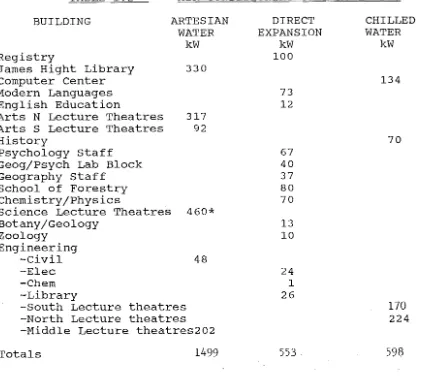
27 TABLE 1. 2 AIR CONDITIONING COOLING LOADS. BUILDING
Registry
ARTESIAN WATER
kW James Hight Library 330 Computer Center
Modern Languages English Education
Arts N Lecture Theatres 317 Arts S Lecture Theatres 92 History
Psychology Staff Geog/Psych Lab Block Geography Staff
School of Forestry Chemistry/Physics
Science Lecture Theatres 460* Botany/Geology
Zoology Engineering
-Civil 48
-Elec -Chem -Library
-South Lecture theatres -North Lecture theatres -Middle Lecture theatres202
Totals 1499
DIRECT EXPANSION kW 100 73 12 67 40 37 80 70 13 10 24 1 26 553 CHILLED WATER kW 134 70 170 224 598
The Science lecture theatres were cooled by an absorption chiller operating off the steam heating system, however operating problems present since its installation have meant that i t has not been used in recent years. A lack of suitably skilled maintenance personnel in New Zealand for absorption machines is an important factor in this.
Direct expansion air conditioning plant are the most commmon type on campus. These are typically small units I less
[image:37.595.85.520.107.484.2]installed in increasing numbers as the number of computers increase on campus.
66% of the total cooling load is due to occupancy, most of this from the lecture theatres, where cooling will be required all year round because of the occupancy density. An important problem in an analysis of the university's cooling requirements is the lack of information about actual cooling demand patterns. without a reasonable amount of basic data on the demands placed on the existing systems no accurate economic analysis of the benefits of various technical schemes is possible.
1.4 ENERGY MANAGEMENT AND CONTROL SYSTEM
An energy management system (EMS), is required to control building services plant operations in order to achieve a required level of environmental quality, while simUltaneously minimising energy consumption and operating costs.
29
and are shut down before occupancy ceases.
The Phoenix EMCS system allows the use of Direct Digital Control (DDC) of systems with DDC remote multiplexing capability
System Architecture and Main Features.
Phoenix is a multi level distributed processing system. Each programmer supervises specific activities and performs specific functions. Each programmer typically reports to one higher level processor and supervises multiple lower level processors Each processing level is designed to report failures detected in lower levels and to continue operating without interruption in the event of a failure of a higher level.
The main features of the EMCS are; 1. Electrical Demand Limiting.
A power demand monitor gathers electrical demand data from the university and from the supply authorities system demand signals (Southpower provides a UHF signal for notifiable demand peaks) and produces a demand forecast. 2. optimum start and stop Time Determination.
heating systems before occupancy finishes so that the minimum amount of fuel is consumed.
3. Derivation of Data Values.
Important energy values that cannot be determined by a single sensor can be derived from data from several single sensors. An example may be the derivation of the value of enthalpy of fresh air, where the enthalpy may be determined from a dry bulb temperature sensor and a humidistat. Any number of sensors may be combined to give averages, maximum or minimum values, efficiencies, etc.
4. Centralised Time Clock.
The EMCS authorises all time clock functions on the campus from a central location. This allows out of hours scheduling of lecture theatres and start up
I
shut down of services plant to be easily controlled.5. Energy Monitoring and Plant Monitoring.
Perhaps the most useful function of the EMCS is its ability to report and signal an alarm condition on plant operating status and system energy demand and consumption. This frees maintenance staff from time consuming plant checking duties, and enables instant feedback on any operational or system changes.
Specialised operational programs can be developed using the EMCS systems "Free Programming Language"
Several software features not associated with energy
"
31 systems schematics. However as these are not essential energy management functions and are significant loads on both the computers memory and operating speed these are not used.
SECTION 2. ENERGY TECHNOLOGIES FOR CAMPUS 2.1 ELECTRICITY USE REDUCTION OPTIONS. 2.1.1 ELECTRICAL PEAK SHAVING.
A significant part of the electricity supply cost was due to demand components of the ND6 tariff. A breakdown of annual electricity cost based on data for the 1988 year is as follows;
Supply Charge (Fixed Portion) Supply Charge (variable Portion) System Demand
Coincident Demand
Day Energy (various rates) Night Energy
0.3% 6.6% 22.8% 14.3% 47.7% 8.6%
The combined effect of the demand charges amounted to 43.7% of the annual electricity account, while for the new NM2 tariff controllable demand charges amount to about 18% of annual charges. These charges are based on the electrical demand levels at specific times of the day. By generating electricity on site during coincident, and supply authority demand charge periods, the consumer may reduce the generally expensive demand component of its electrical account.' This is achieved without using the large amounts of. fuel required to generate the bulk of the daily electrical load.
An analysis of the possible savings due to peak shaving demand charges follows in this section. The main aims of this section are;
1. To determine if peak shaving is a viable option. 2. To establish an optimum level of peak shav4.ng generating capacity, (if i t exists).
33 For this analysis the recoverable heat output of the generating plant is neglected, as this heat is of significantly lower thermodynamic and economic value than the electricity generated. section 2.2, Combined Heat and Power Generation, examines further the heat and power requirements of the campus, and shows that extra heat production will be required in any case as the low grade reject heat from the generators will be insignificant when compared to the total campus heating load when the generation plant output matches the campus electrical load.
The following table shows the actual reductions in electrical charges resulting from peak shaving. Charges are based on the consumption data from electricity accounts for the period 21 July 1988 t i l l 18 August 1988 and as such reflect the effects of the older ND6 tariff.
TABLE 2.1 ELECTRICAL PEAK SHAVING SAVINGS Amount of peak shaved OMW IMW 2MW 3MW Supply Charge 28 days $193 $193 $193 $193 Supply Charge Demand $7200 $7200 $7200 $7200 System Demand Charge $12532 $8355 $4175 $0 coincident Demand Charge $16425 $10950 $5475 $0 winter Energy.
7.00 - 11 00 Weekday $11150 $11150 $11150 $11150 11 00 - 15.00 Weekday $11716 $11716 $11716 $11716 15.00 - 21.00 WeeJs.day $16665 $16665 $16665 $16665 21.00 -.23.00 Weekday $2704 $2704 $2704 $2704 Weekend Day $5884 $5884 $5884 $5884 Night Rate ~5442 ~5442 ~5442 ~5442
chargeing periods. An indication of the operating costs for a half hour period are given later in this section. These range from $50 for a 500kVA generator to $290 for a 2900 kVA generator set. Generating periods are expected to be of about half hour duration, but where there is any uncertainty about the actual start and stop times of these, extended generation may be required in order to intercept the actual coincident or supply demand peak.
Where the coincident and system demand peaks do not coincide, (as occurs on campus ) more frequent operation of the generating equipment will be required, resulting in a reduction of possible savings.
The low peak demand to average day time electrical load ratio of the university makes energy and supply charges a more significant part of the total electrical account, thereby reducing the suitability of the system for peak shaving. Peak shaving is ideally sui ted to consumers that have a short duration, high, demand peak that is coincident with the supply authority's peak demand charging periods.
35 times would soon eliminate the savings achieved.
Peak Shaving System Costs.
Because of the uncertainty of the frequency and duration of operation of a peak shaving plant, accurate assessment of operating costs becomes difficult. However a basic summary of the capital and operating costs of a range of peak shaving plants is given in the following table;
PEAK SHAVING PLANT COSTS.
Generator Generator Unit cost,
Capacity Installed Half Hour
Capital cost operation
500kW $195,000 $50
800kW $255,000 $80
1300kW $420,000 $130
1600kW $465,000 $160
2900kW $885,000 $290
The above costs are based on the following;
1- Capital costs are for Diesel generator sets, Dual fuel or Gas engines are approximately twice as expensive.
2. unit cost for half hour operation based on Diesel cost of $0.67 per litre giving a electricity production cost of $0.20 per kWh.
j . Installed cost of the generator set is taken as 1.5 times
2.l.2 ELECTRICAL LOAD REDUCTION.
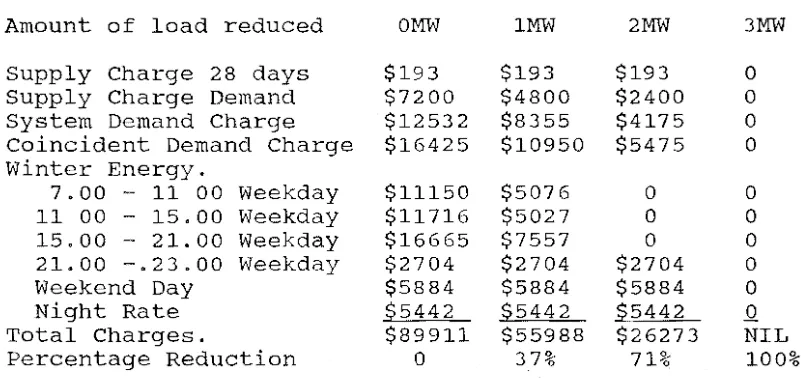
The following table shows the actual reductions in electrical charges resulting from load reductions, achieved by either shedding or eliminating non essential loads, or generating on campus. Charges are based on the consumption data from electricity accounts for the period 21 July 1988 t i l l 18 August 1988.
TABLE 2.2 ELECTRICAL LOAD REDUCTION SAVINGS Amount of load reduced OMW IMW 2MW 3MW Supply Charge 28 days $193 $193 $193 0 Supply Charge Demand $7200 $4800 $2400 0 System Demand Charge $12532 $8355 $4175 0 Coincident Demand Charge $16425 $10950 $5475 0 winter Energy_
7.00 - 11 00 Weekday $11150 $5076 0 0 11 00 - 15.00 Weekday $11716 $5027 0 0 15.00 - 21. 00 Weekday $16665 $7557 0 0 21.00 -.23.00 Weekday $2704 $2704 $2704 0
Weekend Day $5884 $5884 $5884 0
Night Rate ~5442 ~5442 ~5442 Q
Total Charges. $89911 $55988 $26273 NIL Percentage Reduction 0 37% 71% 100%
[image:46.595.79.484.284.473.2]37
savings could be expected from reductions in electrical load from improved electrical usage management. This is shown clearly by the reduction in the potential for peak shaving associated with the introduction of the NM2 tariff and its lower demand component.
2.2. COMBINED HEAT AND POWER GENERATION.
Combined Heat and Power (CHP) production is widely recognised as an efficient method of simultaneously satisfying electrical and heating requirements for a variety of industries, public institutions, and residential schemes. While many different types of CHP scheme exist, the thermodynamic principle of minimising irreversible losses by utilising high grade heat for generating work, and low grade "reject" heat for useful heating, from a single heat source, is a common feature.
From an energy conservation point of view CHP provides a means of supplying energy services to society with a considerably lower drain on fossil fuel stocks. A 1989 report The Potential For Cogeneration in New Zealand [Ministry of Energy] concludes:
"There is considerable potential for further cogeneration in New Zealand; as much as 300 GWh/year at a cost of 12c/kWh (the current Electricorp long run marginal cost 0 f
production) or less. The fuel efficiency for this level of cogenerated energy is expected to range from 65% to ~
ie between two and three times the fuel efficiency 0 f
Electricorp (thermal) generating plant."
sizes and configurations with good records of reliability. Factors influencing CHP feasibility.
39
1. Energy costs. Both the relative price differences between different fuel sources and uncertainty over the future trends in fuel prices, affect the feasibility of various CHP schemes, and make reliable assesment of benefits difficult.
In New Zealand with a large supply of cheap hydro based electricity, the ability of any other generating system to produce electricity competitively is limited.
2. High capital costs of CHP plants make reasonable rates of return on investment hard to attain, and increase the level of financial risk to a CHP user, making other less expensive energy strategies more attractive.
3. Both heat and power load densities need to be quite high in order to keep energy distribution costs to a minimum. Proximity of the heat load to the power generating source is also important.
4. The ability to purchase standby electricity in the event of break down, without excessive financial penalty, and the ability to sell excess power at reasonable price, improve the feasibility of a CHP plant dealing with unmatched or varying loads.
5. Variable heat and power loads, especially where these occur independantly, make both design and operation of CHP plant uncertain.
This is the most common CHP plant in New Zealand, capable of being fired on coal, gas, wood, or waste fuels, high pressure steam (typically at 20 to 60 bar) passes through a turbine to a lower pressure steam process load.
The amount of energy required to raise
steam does not vary much with steam pressure. The following table gives the energy required to raise one kg of steam from 1 kg of water at 20 deg C.
TABLE 2.3 ENERGY REQUIRED TO RAISE lkg OF STEAM. BOILER
PRESSURE. ( BAR )
1 10 20 30 40
SAT TEMP.
( C ) 100 180 212 234 250
ENERGY REQUIRED.
( kJ ) 2592 2695 2716 2720 2718
To raise steam at 40 bar requires very little extra energy input than that required to raise steam at 20 bar.
Boiler design limitations-provide two main cost steps. Firetube shell boilers are inexpensive but limited to pressures of about 15 bar. At pressures above this more expensive water tube boilers are required until pressures of 45 bar and 450 deg C steam temperature require the use of special alloy steels, with disproportionatly high costs for small installations.
For high turbine efficiency a large pressure ratio across the turbine is esssential, (necessitating as high as practicable inlet pressures) with some degree of superheat in order to limit blade erosion due to wet steam in the final turbine stages.
41 important consideration. Unlike large power generating condensing turbines with turbine outlet conditions close to atmospheric temperature the heat or process load temperature requirements can considerably raise turbine outlet conditons. As a drop in exhaust pressure can give an increase in turbine output greater than that from an equal increase in turbine inlet pressure this is particularly important.
The following table gives turbine work output, and work to heat ratio as a function of exhaust pressure.
TABLE 2.4
EFFECT OF INPUT/EXHAUST PRESSURES ON TURBINE OUTPUT
TURBINE TURBINE WORK WORK /
INLET EXHAUST OUTPUT HEAT
PRESSURE PRESSURE RATIO
( BAR ) ( BAR ) (kJ/kg) ( Q/W
40 10 315 0.13
40 7 378 0.16
40 2 588 0.20
40 1 684 0.32
See also Appendix A
The campus steam heating system operates with a boiler pressure of 100 psi (6.9 bar), which would form a severe limitation on turbine performance.
Turbine internal efficiency is also an important factor. "Although i t is impossible to generalise due to the large number of permutations of steam pressures,
temperatures and flows possible through a given
turbine, a high speed geared machine is usually more efficient than a direct coupled machine for the smaller powers and exhaust volume flows. The gain in power more than offsets the gearing losses." [Valentine]
Most small turbines operate at about 7000 to 12000 rpm and require gearboxes.
Back Pressure and Pass Out Turbines.
heat to work ratio for turbines operating with different exhaust pressures. The operating efficiency of a back pressure turbine can be optimised by selecting a back pressure such that the heat/work demand characteristic of the load is matched to the turbine. In order to use a back pressure turbine on the existing campus steam system a 7 bar exhaust pressure limit will be placed on the turbine as this is the pressure at which steam is currently produced for the campus heating system. This will produce a work/heat output ratio of 0.16 which is likely to be too low, as the typical work/heat ratio during daytime for the campus varies from 0.2 in summer weekends, to about 0.3 in winter. This means that at 7 bar exhaust pressure, supplementary boiler heating will be required throughout the year if the electrical load is matched. However if the campus heat load is matched by the CHP plant excess electricity will be available for sale. The work/heat load ratio of the campus varies considerably throughout the day as well as throughout the year, and at certain times of the year a better match between loads and turbine outputs will occur.
43 optimise the turbine for any work/heat ratio other than the design one of 0.2. As the campus heat and electricity loads both vary considerably and independantly the efficiency of a back pressure turbine would be compromised frequently.
At this stage the desirability of using of a pass out or extraction turbine becomes apparent. Here steam is first passed through a high pressure (HP) turbine stage, to the heat or process load operating pressure, where i t is either bled off to the heating load or further expanded through a low pressure (LP) condensing turbine stage. This significantly improves the turbine performance as the LP stage allows expansion of the non bled steam into the wet steam region down to pressures limited by the condensing medium's temperature. A pass out turbine for the campus would bleed steam at 7 bar to the heating system, however converting the heating system to MTHW operation would improve the turbine performance even further as the HP turbine stage would expand the full steam mass flow to a lower bleed pressure. The pass out turbine also allows much greater flexibility in matching the turbine heat and work outputs to the work/heat ratio of the load. Fig 2.3 shows the range of work/heat ratios that can be covered without importing or exporting heat or power for the campus.
While the need to match turbine characteristics to load is important, attempting to neither import or export heat or power may not be the overall most efficient use of the plant or fuel. As the electrical output is the most valuable, maximising this output (rather than losing potential work in
more efficient than operating at a lower efficiency for the sake of achieving a close match of loads to turbine output.
For the university this would mean sizing the turbine to match peak heating loads and selling any extra electricity resulting. This shows that the ability to sell excess power without penalty is an important factor in the decision to
install a CHP plant.
GAS TURBINES.
While steam turbines have traditionally been the main prime mover for thermal electricity generation, the rapid start up ability of gas turbines has made the gas turbine popular as a low capital cost peak load demand generator. In New Zealand, Electricorp has several gas turbine based peak load plants, ie Otahuhu, Stratford, and Whirinaki.
For CHP schemes the gas turbine is particularly sui table as the heat input not converted to shaft power is available as a high temperature exhaust gas (cf the low pressure low temperature exhaust steam from a steam turbine) which can readily produce a high grade process output. Compared to a diesel or dual fuel oil/gas engine where about 30% of the fuel input is rejected as low grade cooling water, this is quite significant. Both gas turbines and oil/gas engines produce an oxygen rich exhaust which can be further burnt with fuel to produce steam, this will however reduce the overall fuel
~
utilisation factor as the extra fuel burnt in the boiler produces no work output.
45 efficiency falls between that of a condensing steam turbine and back pressure turbine.
TABLE 2.5 CHP PLANT TYPES AND THEIR EFFICIENCIES. GENERATOR
TYPE Gas Turbine Condensing ST Back Press ST Pass Out ST Gas/oil Engine
WORK OUTPUT 0.3 0.4 0.25 0.38 0.36 USEFUL HEAT OUTPUT 0.55 0.0 0.6 0.1 0.3 ENERGY UTILISATION FACTOR 0.85 0.4 0.85 0.48 0.66
[after Horlock] However in CHP schemes thermal efficiency alone is not the most important factor in determining the suitability of a prime mover.
The ability of a CHP plant to maintain a high efficiency when following a wide range of varying electrical and heat loads is perhaps more important. This is especially important in the case of the university campus where heat requirements vary from 14.5 MW to virtually'nothing and electrical loads vary from 2.9 MW to 0.5 MW.
"The part load performance is also affected-by the cycle chosen and by the method by which the (gas turbine) shafts are controlled. For instance a single shaft machine controlled to operate at constant speed for power generation tends to have poor part load performance, as at low speeds the compressor is forced to operate at full speed at part of its characteristic where i t is not too efficient " [Craig]
tower.
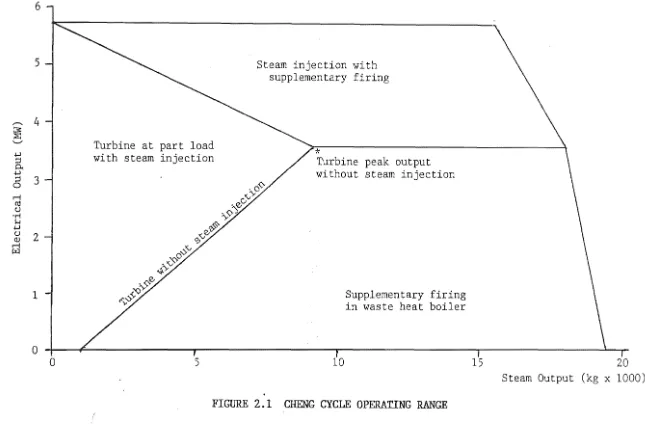
Injection of high pressure steam from the gas turbines waste heat boiler into the turbine stage inlet, is a method which gives considerable flexibility to a gas turbine CHP plant. The Cheng cycle is an example of this, where steam injection mass is varied to enable a wide range of heat and electrical loads to be matched.
Koloseus and Sheperd describe the main advantages of the Cheng cycle as;
"The added mass flow due to the steam produces an increase in work output from the turbine. For the Alison 501 the power output increases by 75% and the thermal efficiency by 40%. The price paid is 19% increase in fuel consumption."
Fig 2.1 shows the extensive operating range of a Cheng cycle series seven gas turbine.
[image:56.595.63.517.425.823.2]6
5
,.-.. 4
~
'-" +-l5.
+-l (5 r-I Ci:! U • .-1 ~ +-l U OJ r-I r:il 3 2 1o
o
Turbine at part
Stearn injection with supplementary firing
*
with stearn injection Turbine peak output without stearn injection
~'" o .-<$' 4Y • '0-tO ~'\)Y «"-$> .0'0-",y • eF.I . '0-) !$>Y ",to'?f <0
5 10
Supplementary firing in waste heat boiler
FIGURE 2.1 CHENG CYCLE OPERATING RANGE
15
Steam Output (kg x 1000)
>t>.
[image:57.843.57.702.77.508.2]2.2.2. Assessment of feasibility of CHP for Campus. Design Heat and Power Loads.
An accurate estimate of the heat and electrical loads under which a CHP scheme will operate is essential to the sound analysis of the thermodynamic and economic performance of the CHP system.
Most industrial plants and institutions have complex, varying, heat and power load profiles, determined by the operating and environmental conditions. Methods for measuring the heat and power loads vary in complexity and accuracy, with more frequent measurements being required for continuously varying complex loads.
The simplest analysis involves taking a yearly average of heat and power loads and energy consumption, however this crude approximation is only suitable for the simplest initial feasibility study. Taking monthly averages of daily loads gives a more accurate assessment, reflecting diurnal and yearly load variations, resulting in 12 monthly average load profiles. If the actual hourly loads are determined from historical records the most accurate analysis of operating conditions can be built up, and a accurate ass.essment of actual operating costs and savings can be made. However the disadvantage of this is the large number of calculations required to produce this highly accurate result.
Bonham in a discussion of Ruston Gas Turbines TESOS (Total Energy Simulation Optimisation Study) computer based CHP plant simulator states:
49 be made by considering only four typical operating days, namely
A typical winter production day, A typical summer production day, A typical winter non-production day, A typical summer non-production day,"
[P BONHAM]
In the case of the university campus the above method of analysing the CHP loads is particularly appropriate, as the winter heating season almost coincides with the university term from March to October, and the typical daily loads are reasonably constant throughout the summer and winter periods. This method should give a sufficiently accurate assessment of the annual operation of the CHP plant, without requiring an excessive number of calculations.
A spreadsheet based load analysis program has been developed to enable a reasonably accurate estimate of the costs and benefits likely from the installation of a CHP plant on the campus. The following features are included:
1) The effects of variations in simUltaneous daily heat and electrical loads are taken into account.
2) Required amounts of heat and/or electricity to be imported or exported resulting from imbalances between CHP outputs and load requirements are given.
3) Plant operation in two modes:
a. CHP plant satisfies electrical demand, heat may need balancing.
b. CHP plant satisfies heat demand, electrical l<Jad may need balancing.
5) operating costs, including fuel and maintenance costs, and final heat and electricity output unit charges produced.
The CHP plant is assumed to operate continuously throughout the year, in order to maximise savings and return on capital cost, although in practice, operation in summer may not be economical.
Electrical tariff energy and demand charges are not included in the analysis for simplicity.
2.2.3. CHP SCHEME ANALYSIS RESULTS.
The following pages include summary sheets from the CHP analysis spreadsheets as well as details of the thermodynamic characteristics and economic factors used in the analysis. A complete example of one of the spreadsheets with explanatary notes is included in appendix D.
1. BACK PRESSURE TURBINE, 7BAR EXHAUST PRESSURE.
As no performance data relating to a specific production back pressure turbine was available, a performance model was developed based on an analysis of steam consumption of back pressure turbines by Kearton. See KEARTON 1964. The relationship between shaft power output, and total steam consumption is given based on the following design conditions:
Turbine steam inlet condition Turbine back pressure <
![---FIGURE 1.] University of Canterbury](https://thumb-us.123doks.com/thumbv2/123dok_us/27670.502692/29.842.91.737.28.552/figure-university-of-canterbury.webp)