TECHNICAL NOTE
Delay Correction for the Assessment of
Blood-Brain Barrier Permeability Using First-Pass
Dynamic Perfusion CT
T. Schneider J. Hom J. Bredno J.W. Dankbaar S.-C. Cheng M. Wintermark
SUMMARY:Hemorrhagic transformation is a serious potential complication of ischemic stroke with damage to the BBB as one of the contributing mechanisms. BBB permeability measurements extracted from PCT by using the Patlak model can provide a valuable assessment of the extent of BBB damage. Unfortunately, Patlak assumptions require extended PCT acquisition, increasing the risk of motion artifacts. A necessary correction is presented for obtaining accurate BBB permeability mea-surements from first-pass PCT.
ABBREVIATIONS:ACA⫽anterior cerebral artery; AIF⫽arterial input function; BBB⫽blood-brain barrier; BBBP⫽blood-brain barrier permeability; CBF⫽cerebral blood flow; CBV⫽cerebral blood volume; CI⫽ confidence interval; CTA⫽ CT angiography; FLAIR⫽ fluid-attenuated inversion recovery; GEE⫽generalized estimating equations; MCA⫽middle cerebral artery;√MSE⫽root mean squared errors; MSE⫽mean squared error; MTT⫽mean transit time; NCCT⫽noncontrast CT; PCA⫽posterior cerebral artery; PCT⫽perfusion CT; PET⫽positron-emission tomography; RIF⫽region input function; rtPA⫽recombinant tissue plasminogen activator; TTP⫽time to peak
H
emorrhagic transformation is a serious and potentially
fatal complication of ischemic stroke.
1The risk of this
complication has been and is a hindrance to the
administra-tion of rtPA for the treatment of this condiadministra-tion.
2,3Disruption
of the BBB is believed to be one of the factors involved in the
pathophysiology of hemorrhagic transformation.
4It is
hy-pothesized that the identification of a disrupted BBB in
pa-tients with stroke before rtPA administration would be a
valu-able tool in assessing the risks/benefits of this treatment.
5PCT has been used for some time to assess cerebral
hemo-dynamics.
6Recently, measurements of BBBP have also been
extracted from PCT data,
7with the Patlak model
8one of the
methods used. Earlier studies with this model used PCT data
collected from the first-pass of contrast injection.
7,9However,
the original Patlak description clearly states that a steady-state
of contrast levels must be obtained before BBBP can be
prop-erly assessed.
8A recent study
10demonstrated that acquiring a
delayed PCT acquisition was required to accurately assess
BBBP according to the Patlak model. This delayed acquisition
needs to be at least 210 seconds.
11This relatively long scanning
duration raises issues of motion artifacts and radiation dose.
Additional approaches to solve these problems are warranted.
In this report, we present a further correction to the current
Patlak model and test its validity on a sample of PCT images of
patients with ischemic stroke.
Technique
Theory
Patlak et al8and Patlak and Blasberg8,12described a theoretic model of blood-brain exchange. It assumes the unidirectional transfer of a tracer from a reversible (arterial) compartment to an irreversible ex-travascular space (in this case the brain parenchyma) for a certain period of time. Transfer of tracer is assumed to be unidirectional when a steady-state phase is reached between intravascular and ex-travascular compartments. Simulated brain PCT studies13were used to help validate 2 major assumptions, no backflow and leakage of BBB as early as the first pass.
The graphic representation of the Patlak model is called the Patlak plot. When the Patlak plot is linear, unidirectional transfer is said to be present. The slope of the plot indicates the rate of transfer between the 2 compartments. When applied to PCT, the Patlak model uses iodinated contrast as the tracer and takes advantage of the Hounsfield attenuation being directly proportional to the iodinated contrast concentration.
The derivation of the Patlak plot comes from the idea that the total attenuated contrast of a current voxel or region of interest can be represented as a sum of the tracer in the intravascular and extravas-cular compartments at a specified timet:
1A) RIF共t兲⫽CBV䡠civ共t兲⫹K1
冕
0 t
civ共兲d,
1B) Intravascular⫽CBV䡠civ共t兲,
1C) Extravascular⫽K1
冕
0 t
civ共兲d,
Received December 26, 2009; accepted after revision March 23, 2010.
From the Department of Radiology, Neuroradiology Section (T.S., J.H., J.W.D., M.W.), and Department of Epidemiology and Biostatistics (S.-C.C.), University of California, San Francisco, San Francisco, California; Clinical Sites Research Program (J.B.), CT Clinical Science Group and Philips Research North America, Philips Healthcare, Briarcliff Manor, New York; and Department of Radiology (J.W.D.), University Medical Center, Utrecht, the Netherlands.
Max Wintermark receives funding from the National Center for Research Resources, grant KL2 RR024130, Philips Healthcare, and GE Healthcare. Joerg Bredno is an employee of Philips Healthcare.
The content of the article is solely the responsibility of the authors and does not necessarily represent the official views of the National Institute of Neurologic Disorders and Stroke, the National Center for Research Resources, the National Institutes of Health, or the other sponsors.
Please address correspondence to Max Wintermark, MD, MAS, Department of Radiology, Division of Neuroradiology, University of Virginia Health System, P.O. Box 800170, Char-lottesville, VA, 22908-0170; e-mail: [email protected]
Indicates open access to non-subscribers at www.ajnr.org
where RIF(t) is the region input function or contrast at timet, and civ(t) is the intravascular concentration of the voxel at timet. Multi-plying the 2 would yield the total contrast residing in the intravascular
component.兰 0
tc
iv共兲drepresents the total amount of contrast that
perfused the intravascular component from time 0 up until timet, andK1is the permeability constant, which is the result of the Patlak analysis. Because the amount of contrast that leaks from the intravas-cular to the extravasintravas-cular component is directly related to the
perme-ability,K1is multiplied by兰 0
tc iv共兲d.
Of course, the intravascular and extravascular components of each CT voxel are imaged together, which results in an unknown true intravascular concentration. TheAIForAIF(t) is used instead because the voxel in that region contains only an intravascular component. The equation now becomes
2) RIF共t兲⫽CBV䡠AIF共t兲⫹K1
冕
0 t
AIF共兲d,
The Patlak model takes this equation, divides it byAIF(t), which yields an easily plotable line in which the slope isK1:
3) RIF共t兲
AIF共t兲⫽CBV⫹K1
冕
0 t
AIF共兲d
AIF共t兲
settingY⫽RIF共t兲
AIF共t兲andX⫽
冕
0 t
AIF共兲d
AIF共t兲 yields
Y⫽CBV⫹K1䡠X.
The end result of the Patlak model is shown in equation 3, which is a linear regression from the PCT datasets. The slopeK1is used as an indicator of BBBP. The extravascular component is simplified by the fact that it does not take into account the backflow of contrast. A major reason for its removal is that backflow heavily complicates the analysis in which only nonlinear regression techniques may be used. This simplicity of the Patlak model allows efficient creation of visual linear graph plots and functional maps ofK1. Furthermore, simula-tion studies13have shown that backflow is a negligible component of permeability in cases of stroke, even in the delayed-acquisition stages.
Again, the Patlak model requires a steady-state phase to be reached between compartments so that the transfer of tracer can be assumed to be unidirectional. A steady-state phase can only occur after the initial rapid changes in tracer concentration have subsided so that the arterial concentration has stabilized, allowing a constant rate of transfer of contrast. The replacement of civ(t) withAIF(t) can be-come a significant problem if the arterial function curve is ahead of the current voxel. This is because the voxel with a delayed arrival of contrast will have an incorrectly lower RIF(t) at the beginning of the first pass for the artery (not the region of interest) because contrast has yet to arrive in the region of interest and there is an incorrectly higher RIF(t) at the end of the first pass for the artery because contrast has yet to leave the region of interest. This will lead to an increase of the slope, which is ultimately the reason why BBBP measurements extracted from first-pass PCT data by using the Patlak model tend to
be overestimated.10This phenomenon is most important in ischemic regions because there the flow is significantly delayed compared with other regions.10
In the method we propose for obtaining accurate BBBP measure-ments from first-pass PCT, we correct time-enhancement curves for delay. More specifically, the time-enhancement curve in each paren-chymal voxel is shifted so that the arrival of contrast occurs at the same time as the arterial input curve:
4) civ(t)⫽AIF(t⫺[TTP(RIF)⫺TTP(AIF)]).
TTPis the time till the peak of a curve. From previous simulation studies,TTPwas shown to be the best estimator of the true delay of contrast.13The new estimate c
iv(t) is then put back into equation 3 in place of the AIF(t) for all delay-corrected calculations.
Validation Study Design
Imaging data obtained as part of standard clinical stroke care at our institution were retrospectively reviewed with the approval of the in-stitutional review board. At our institution, patients with suspicion of acute stroke and no history of significant renal insufficiency or con-trast allergy routinely undergo a stroke CT survey including NCCT of the brain, PCT at 2 cross-sectional positions, CTA of the cervical and intracranial vessels, and postcontrast cerebral CT, obtained in this chronologic sequence.
We retrospectively identified a consecutive series of 23 patients admitted from July 2007 to August 2008 who met the following in-clusion criteria: 1) admission to the emergency department with signs and symptoms suggesting hemispheric stroke within 12 hours after symptom onset, 2) documentation of acute ischemic hemispheric stroke by both admission stroke protocol and clinical examination, 3) no evidence of intracerebral hemorrhage on the admission NCCT, and 4) no significant motion artifacts following application of the registration algorithm. Patients’ demographic and clinical data were recorded.
Imaging Protocol
PCT studies were obtained on 64-section CT scanners. Each PCT study involved successive gantry rotations performed in cine mode during in-travenous administration of iodinated contrast material. Images were acquired and reconstructed at a temporal sampling rate of 1 image per second for the first 37 seconds and 1 image every 2 seconds for the next 33 seconds. Additional gantry rotations were obtained at 90, 120, 150, 180, 210, and 240 seconds. Acquisition parameters were 80 kV(peak) and 100 mAs. Two successive PCT series at 2 different levels were performed following the NCCT and before the CTA. At each PCT level, eight 5-mm-thick sections were assessed. The first PCT series was obtained at the level of the third ventricle and the basal ganglia, and the second PCT series, above the lateral ventricles. For each PCT series, a 40-mL bolus of iohexol (Omnipaque; Amersham Health, Princeton, New Jersey; 300 mg/mL of iodine) was administered into an antecubital vein by using a power in-jector at an injection rate of 5 mL per second for all patients. CT scanning was initiated 7 seconds after the start of the injection of the contrast bolus. Data from both boluses were used because prior work has demonstrated that there is no significant parenchymal saturation effect from the first bolus that leads to underestimation of BBBP from data from the second bolus.14
Image Postprocessing
PCT data were analyzed using PCT software developed by Philips Med-ical Systems (Cleveland, Ohio). This software relies on the
BRAIN
TECHNICAL
central-volume principle, which is the most accurate for low-injection rates of iodinated contrast material.15The software ob-tains mathematic descriptions of the time-attenuation curves for each pixel, by applying curve fitting by least mean squares, after correcting for motion and noise reduction through an anisotropic edge-preserving spatial filter. A closed-form (noniterative) decon-volution is then applied to calculate the MTT map.16The decon-volution operation requires a reference AIF (most often within the ACA), automatically selected by the PCT software within a region of interest drawn by the user. The CBV map is calculated from the area under the time-attenuation curves,17 not from the Patlak model8used to calculate BBBP, because the CBV deconvolution method can use all gantry rotations for its calculation, be less susceptible to noise, and provide the BBBP calculations with greater stability. The PCT infarct core and salvageable brain tissue regions of interest are automatically calculated by the software by using CBV thresholds and MTT thresholds reported in the litera-ture as the most accurate (PCT salvageable brain tissue: MTT⬎ 145% of the contralateral side values plus CBVⱖ2.0 mL⫻100 g⫺1; PCT infarct core: MTT⬎145% of the contralateral side val-ues plus CBV⬍2.0 mL⫻100 g⫺1).18Regions of interest for each patient were thus divided into regions of interest of tissue at risk, infarct, and normal parenchyma according to these thresholds.
BBBP measurements were extracted from PCT data by using a sec-ond prototype software developed by Philips Medical Systems. This soft-ware is based on the Patlak model.8For this study, 2 types of BBBP values were calculated: one used delay correction, and the other did not.
Data Analysis
Using the prototype software, we calculated BBBP values from the reference standard delayed-acquisition dataset, which incorporated all time points from 90 to 240 seconds. Additionally, we calculated BBBP values by using the delay-corrected Patlak model by using the
first-pass 0- to 90-second PCT data and also by using the first-pass 30-to 90-second PCT data. To quantify the effect of the delay correction, we also calculated BBBP values by using no delay correction from the first-pass 0- to 90-second PCT data. BBBP values were recorded in the infarct and tissue at risk, as automatically delineated by the software, as well as in mirrored regions of interest in the contralateral nonisch-emic tissue (also automatically delineated by the software).
We quantified the quality of the linear fit to see how well the assump-tions of the Patlak model were met by data extracted from the reference standard 90- to 240-second acquisition (no delay correction needed), the 0- to 90-second first-pass acquisition with delay correction, the 30- to second first-pass acquisition with delay correction, and the 0- to 90-second first-pass acquisition without delay correction. To do this, we used the公MSE, which is a measure of variability of data points around a straight line: A value close to 0 indicates a smaller spread of data points around the line, corresponding to a better fit.
Statistical Analysis
The 4 sets of calculated BBBP values (reference standard, 90- to 240-second acquisition, 0- to 90-240-second first-pass acquisition with delay correction, 30- to 90-second first-pass acquisition with delay tion, and 0- to 90-second first-pass acquisition without delay correc-tion) as well as the corresponding公MSE values for the ischemic and nonischemic regions of interest were compared by using GEE models with a robust variance estimation, with fixed effects for patients and type of regions of interest. Because the distribution of the parameters was not normal but skewed, rather than reporting simple means, we described estimated mean values (obtained by log transformation of the data). For all values, 95% CIs were also calculated.
Results
Patients and Imaging Studies
Twenty-three patients who matched our inclusion criteria
were retrospectively identified. Patient characteristics are
summarized in Table 1. The median time from symptom
on-set to PCT was 2.25 hours (range, 1–11.75 hours). The Patlak
analyses were performed in a total number of 230 ischemic
regions of interest and 230 nonischemic regions of interest.
BBBP Measurements for Delayed PCT Acquisition
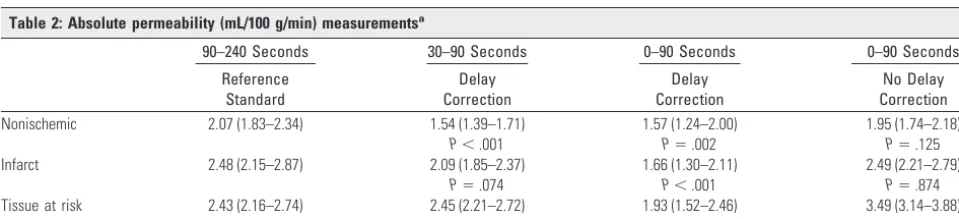
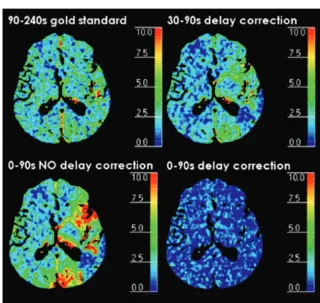
[image:3.594.53.282.54.204.2]BBBP values calculated from the delay-corrected 30- to
90-second first-pass acquisition overlapped with the ones
calcu-lated from the reference standard 90- to 240-second delayed
acquisition in the ischemic parenchymal tissue and were
slightly underestimated in the nonischemic parenchymal
tis-sue (Table 2, Figs 1 and 2). The delay-corrected first pass did
not show the overestimation of BBBP values in the tissue at
Table 1: Study patient characteristicsPatients with Stroke
No. of patients 23
No. of men (%) 8 (35%)
Age (yr) Median⫽74
Interquartile range⫽59.5–82.5
Range⫽26–92
Time from stroke to PCT (hr) Median⫽2.25
Interquartile range⫽1.5–5
Range⫽1–11.75
Stroke location:
ACA and MCA territories 3
MCA territory 20
ACA territory 0
PCA territory 0
Table 2: Absolute permeability (mL/100 g/min) measurementsa
90–240 Seconds 30–90 Seconds 0–90 Seconds 0–90 Seconds
Reference Standard
Delay Correction
Delay Correction
No Delay Correction
Nonischemic 2.07 (1.83–2.34) 1.54 (1.39–1.71) 1.57 (1.24–2.00) 1.95 (1.74–2.18)
P⬍.001 P⫽.002 P⫽.125
Infarct 2.48 (2.15–2.87) 2.09 (1.85–2.37) 1.66 (1.30–2.11) 2.49 (2.21–2.79)
P⫽.074 P⬍.001 P⫽.874
Tissue at risk 2.43 (2.16–2.74) 2.45 (2.21–2.72) 1.93 (1.52–2.46) 3.49 (3.14–3.88)
P⫽.921 P⫽.066 P⬍.001
[image:3.594.53.533.612.721.2]risk that was seen with the first-pass acquisition without delay
correction (Table 2).
Quality of the Linear Regression According to the Patlak
Model
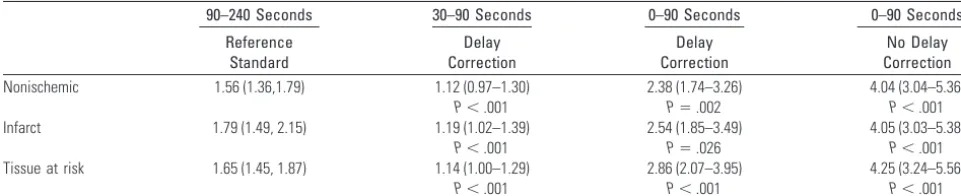
公
MSE measurements (Table 3) were low for the reference
standard 90- to 240-second delayed acquisition and for the
delay-corrected 30- to 90-second first-pass acquisition,
show-ing that the linearity assumption underlyshow-ing the Patlak model
is well-respected. For the first-pass acquisition without delay
correction,
公
MSE measurements were higher, indicating a
poorer linear fitting.
Radiation Dose and Motion Artifacts
The effective radiation dose associated with the reference
stan-dard 240-second acquisition was calculated (3.2 mSv). The
decrease in radiation dose associated with a transition to a
90-second first-pass-only acquisition was 8.3%.
Motion artifacts significant enough to interfere with
per-meability processing even after application of the registration
algorithm were seen in 3 patients. In each of these cases,
suit-able permeability processing was not possible with the full
90-to 240-second acquisition. However, in 2 of these patients,
BBBP values could be calculated from the 90-second first-pass
acquisition because the motion artifacts affected exclusively
the delayed acquisition (but spared the first-pass).
Fig 2.Absolute permeability (milliliters per 100 g per minute) maps for the reference standard 90- to 240-second delayed acquisition and for the 0- to 90-second first-pass acquisition with delay correction, the 30- to 90-second first-pass acquisition with delay correction, and the 0- to 90-second first-pass acquisition without delay correction. BBBP values calculated from the delay-corrected 30- to 90-second first-pass acquisition overlapped with the ones calculated from the reference standard 90- to 240-second delayed acquisition in the ischemic parenchymal tissue and were slightly underestimated in the nonischemic parenchymal tissue. The delay-corrected first-pass did not show the overestimation of BBBP values in the penumbra that were seen with the first-pass acquisition without delay correction.
[image:4.594.52.286.42.309.2] [image:4.594.133.453.375.678.2]Discussion
The original description of the Patlak model, published in 1983,
contains a very stringent assumption that steady-state has been
achieved.
8This assumption requires a delayed acquisition. There
would be advantages to applying the Patlak model to first-pass
PCT data because this is usually what is obtained as part of
stan-dard PCT protocols. However, recent results show that this
re-sults in overestimation of permeability values, mainly in the tissue
at risk because of the delayed contrast arrival.
10To overcome this
pitfall, we have developed an additional modification of the
de-lay-corrected Patlak model for the first-pass PCT data.
Our results are promising and show that BBBP values
cal-culated from the delay-corrected, 30- to 90-second first-pass
acquisition overlapped with the ones calculated from the
ref-erence standard 90- to 240-second delayed acquisition in the
ischemic parenchymal tissue and were slightly underestimated
in the nonischemic parenchymal tissue. The delay-corrected
first-pass did not show the significant overestimation of BBBP
values in the tissue at risk that was seen with the first-pass
acquisition without delay correction. Also, the linearity
as-sumption underlying the Patlak model is well-respected by the
delay-corrected first-pass. Looking at the absolute
permeabil-ity values (Table 2), we did not see very large differences
be-tween the reference standard, delay correction, and no delay
correction. However, the
公
MSEs (Table 3) were significantly
higher for no delay correction compared with the reference
standard and delay correction. This finding indicates that
de-lay correction leads to more stable and consistent results for
shorter acquisitions. The small differences in terms of absolute
permeability values between delay-corrected short acquisition
and reference standard
⫺
delayed acquisition need to be tested
in terms of clinical relevance in future studies.
Despite our effort to correct for the delayed arrival time of
contrast, the time interval 30 –90 seconds still worked better than
the 0 –90-second time interval. The simplest explanation for this
is that even with the correction, the time points 0 –30 seconds are
still not steady enough to be used in the Patlak model. It is only
near the end of the first pass that the values can level out enough
to create an environment suitable for this model.
In terms of limitations of our study, we focused on the Patlak
model, and we did not assess other non-Patlak models that can be
applied to PCT data to calculate BBBP, such as the distributed
parameter models.
19,20Future studies are needed to determine
whether our conclusions hold true for alternative models.
Conclusions
In conclusion, we developed a modified version of the Patlak
model with delay correction that allowed obtaining
nonover-estimated BBBP values from a standard first-pass PCT
acqui-sition, minimizing the risk of motion artifacts associated with
a prolonged acquisition.
References
1. Alexandrov AV, Black SE, Ehrlich LE, et al.Predictors of hemorrhagic trans-formation occurring spontaneously and on anticoagulants in patients with acute ischemic stroke.Stroke1997;28:1198 –202
2. Jaillard A, Cornu C, Durieux A, et al.Hemorrhagic transformation in acute ischemic stroke: The MAST-E study—MAST-E Group. Stroke 1999; 30:1326 –32
3. Su EJ, Fredriksson L, Geyer M, et al.Activation of PDGF-CC by tissue plasmin-ogen activator impairs blood-brain barrier integrity during ischemic stroke.
Nat Med2008;14:731–37. Epub 2008 Jun 22
4. Wang X, Lo EH.Triggers and mediators of hemorrhagic transformation in cerebral ischemia.Mol Neurobiol2003;28:229 – 44
5. Bisdas S, Hartel M, Cheong LH, et al.Prediction of subsequent hemorrhage in acute ischemic stroke using permeability CT imaging and a distributed pa-rameter tracer kinetic model.J Neuroradiol2007;34:101– 08
6. Lee T-Y. Functional CT: physiological models. Trends in Biotechnology
2002;20:S3–S10
7. Cianfoni A, Cha S, Bradley WG, et al.Quantitative measurement of blood-brain-barrier permeability using perfusion-CT in extra-axial brain tumors.
J Neuroradiol2006;33:164 – 68
8. Patlak CS, Blasberg RG, Fenstermacher JD.Graphical evaluation of blood-to-brain transfer constants from multiple-time uptake data.J CerebBlood Flow Metab1983;3:1–7
9. Lin K, Kazmi KS, Law M, et al.Measuring elevated microvascular permeability and predicting hemorrhagic transformation in acute ischemic stroke using first-pass dynamic perfusion CT imaging. AJNR Am J Neuroradiol
2007;28:1292–98
10. Dankbaar JW, Hom J, Schneider T, et al.Dynamic perfusion CT assessment of the blood-brain barrier permeability: first pass versus delayed acquisition.
AJNR Am J Neuroradiol2008;29:1671–76
11. Hom J, Dankbaar JW, Schneider T, et al.Optimal duration of acquisition for dynamic perfusion CT assessment of blood-brain barrier permeability using the Patlak model.AJNR Am J Neuroradiol2009;30:1366 –70. Epub 2009 Apr 15 12. Patlak CS, Blasberg RG.Graphical evaluation of blood-to-brain transfer con-stants from multiple-time uptake data: generalizations.J Cereb Blood Flow Metab1985;5:584 –90
13. Bredno J, Hom J, Schneider T, et al.Simulation-based validation and arrival-time correction for Patlak analyses of perfusion-CT scans.Proc Soc Photo Opt Instrum Eng2009;72620G
14. Dankbaar JW, Hom J, Schneider T, et al.Accuracy and anatomical coverage of perfusion CT assessment of the blood-brain barrier permeability: one bolus versus two boluses.Cerebrovasc Dis2008;26:600 – 05
15. Wintermark M, Maeder P, Thiran JP, et al.Quantitative assessment of regional cerebral blood flows by perfusion CT studies at low injection rates: a critical review of the underlying theoretical models.Eur Radiol2001;11:1220 –30 16. Axel L.Tissue mean transit time from dynamic computed tomography by a
simple deconvolution technique.Invest Radiol1983;18:94 –99
17. Ladurner G, Zilkha E, Iliff D, et al.Measurement of regional cerebral blood volume by computerized axial tomography.J Neurol Neurosurg Psychiatry
1976;39:152–58
18. Wintermark M, Flanders AE, Velthuis B, et al.Perfusion-CT assessment of infarct core and penumbra: receiver operating characteristic curve analysis in 130 patients suspected of acute hemispheric stroke.Stroke2006;37:979 – 85 19. Bisdas S, Hartel M, Cheong LH, et al.Detection of early vessel leakiness in acute
ischemic stroke using computed tomography perfusion may indicate hemor-rhagic transformation.Acta Radiol2007;48:341– 44
[image:5.594.52.533.59.157.2]20. Johnson JA, Wilson TA.A model for capillary exchange.Am J Physiol1966;210: 1299 –303
Table 3:公MSE calculated for the fitting of the Patlak linea
90–240 Seconds 30–90 Seconds 0–90 Seconds 0–90 Seconds
Reference Standard
Delay Correction
Delay Correction
No Delay Correction
Nonischemic 1.56 (1.36,1.79) 1.12 (0.97–1.30) 2.38 (1.74–3.26) 4.04 (3.04–5.36)
P⬍.001 P⫽.002 P⬍.001
Infarct 1.79 (1.49, 2.15) 1.19 (1.02–1.39) 2.54 (1.85–3.49) 4.05 (3.03–5.38)
P⬍.001 P⫽.026 P⬍.001
Tissue at risk 1.65 (1.45, 1.87) 1.14 (1.00–1.29) 2.86 (2.07–3.95) 4.25 (3.24–5.56)
P⬍.001 P⬍.001 P⬍.001