ORIGINAL RESEARCH
PATIENT SAFETY
Gadolinium Deposition in Deep Brain Structures: Relationship
with Dose and Ionization of Linear Gadolinium-Based
Contrast Agents
XH. Kang,XM. Hii,XM. Le,XR. Tam,XA. Riddehough,XA. Traboulsee,XS. Kolind,XM.S. Freedman, andX D.K.B. Li
ABSTRACT
BACKGROUND AND PURPOSE: Dose-dependent association between hyperintensity in deep brain structures on unenhanced T1WIs and gadolinium-based contrast agent administrations has been demonstrated with subsequent histopathological confirmation of gadolinium deposition. Our aim was to determine whether greater exposure to linear gadolinium-based contrast agent administration is associated with higher signal intensity in deep brain structures on unenhanced T1-weighted MR imaging. Secondary objective was to compare signal intensity differences between ionic and nonionic linear gadolinium-based contrast agents.
MATERIALS AND METHODS: Subjects with secondary-progressive MS originally enrolled in a multicenter clinical trial were studied retrospectively. Eighty subjects (high-exposure cohort) received 9 linear gadolinium-based contrast agent administrations (30 nonionic/50 ionic) between week⫺4 and year 1 and a tenth administration by year 2. One hundred fifteen subjects (low-exposure cohort) received 2 administrations (40 nonionic/75 ionic) between week⫺4 and year 1 and a third administration by year 2. Signal intensities were measured on unenhanced T1WIs by placing sample-points on the dentate nucleus, globus pallidus, caudate, thalamus, pons, and white matter, and they were normalized using the following ratios: dentate/pons, globus pallidus/white matter, caudate/white matter, and thalamus/white matter.
RESULTS:Between week⫺4 and year 1, subjects in the high-exposure cohort showed increased signal intensity ratios in all regions (P⬍ .01), while the low-exposure cohort showed only an increase in the dentate nucleus (P⫽.003). Between years 1 and 2, when both cohorts received only 1 additional gadolinium-based contrast agent, no significant changes were observed. In the high-exposure cohort, signifi-cantly higher changes in signal intensity ratios were observed in subjects receiving linear nonionic than in those receiving linear ionic gadolinium-based contrast agents.
CONCLUSIONS: Hyperintensity in deep brain structures from gadolinium deposition is related to the number of doses and the type of linear gadolinium-based contrast agent (nonionic greater than ionic) administration.
ABBREVIATIONS:CD⫽caudate; DN⫽dentate nucleus; GBCA⫽gadolinium-based contrast agent; GP⫽globus pallidus; SI⫽signal intensity; TH⫽thalamus
G
adolinium-based contrast agents (GBCAs) are frequently used in clinical MR imaging for their paramagnetic proper-ties to shorten the T1 relaxation time of adjacent water protonsand increase the visibility of abnormal tissues, hence improving diagnostic value.1However, free gadolinium is a toxic heavy metal in vivoand necessitates chelation to polyaminocarboxylic acid ligands to be excreted safely, primarily through the kidneys. Based on the chemical structures, there are 4 categories of chelating agents: macrocyclic ionic and nonionic, and linear ionic and non-ionic. Stability and the ability to prevent free gadolinium from dissociating with the ligand differs for each type, with the macro-cyclic being the most stable, followed by linear ionic, and linear nonionic being the least stable.2,3
In 2014, Kanda et al4first reported that increased signal inten-sity (SI) in the dentate nucleus (DN) and globus pallidus (GP) on unenhanced T1WI was associated with repeat GBCA exposure. Subsequent cadaveric histopathologic studies showed that the T1 hyperintensity represented deposition of gadolinium in neuronal tissues.5,6Since then, numerous studies have shown multiple ad-Received April 14, 2018; accepted after revision June 20.
From the Department of Radiology (H.K., M.L., R.T., S.K., D.K.B.L.), University of Brit-ish Columbia MS/MRI Research Group (M.H., R.T., A.R., A.T., S.K., D.K.B.L.), Depart-ment of Medicine and Division of Neurology (A.T., S.K., D.K.B.L.), DepartDepart-ment of Physics and Astronomy (S.K.), University of British Columbia, Vancouver, British Columbia, Canada; and Department of Medicine and Division of Neurology (M.S.F.), University of Ottawa and the Ottawa Hospital Research Institute, Ottawa, Canada.
Paper previously presented at: Annual Meeting of the American Society of Neuro-radiology and the Foundation of the ASNR Symposium, June 2–7, 2018; Vancouver, British Columbia, Canada.
Please address correspondence to Heejun Kang, MD, Department of Radiology, UBC Hospital, 2211 Wesbrook Mall, Vancouver, BC V6T 2B5; e-mail:
tkang@alumni.ubc.ca; @tkang90
Indicates article with supplemental on-line photos.
ministrations of linear GBCAs to be associated with T1 hyperin-tensity in the deep brain structures.4,6-13However, many of these studies did not have a control group and had a relatively small and heterogeneous sample population.
Furthermore, there is a paucity of literature comparing linear ionic with linear nonionic GBCAs. Ramalho et al14was the only group at the time that directly compared the two and showed an increase in T1 hyperintensity with linear nonionic GBCA (gado-diamide) but not with linear ionic GBCA (gadobenate dimeglu-mine). Although other studies did demonstrate an increase in T1 hyperintensity with linear ionic GBCAs, direct comparison with linear nonionic GBCAs was not made.4,7,10
Our study used a cohort of 195 subjects with secondary-pro-gressive MS who participated in a clinical trial and underwent 2 different contrast-enhanced MR imaging follow-up schedules (10 versus 3 GBCA administrations) over 2 years. Our goal was to determine whether multiple GBCA administrations were associ-ated with increased T1 hyperintensity in deep brain structures on unenhanced T1WI and whether there was a dose relationship to these changes. Our secondary objective was to compare linear ionic with linear nonionic GBCAs to determine whether a differ-ence could be observed in the degree of T1 SI change.
MATERIALS AND METHODS
SubjectsMR imaging data were obtained from subjects with secondary-progressive MS who were initially enrolled in a 2-year, random-ized, double-blind, placebo-controlled trial assessing the efficacy of dirucotide (MBP8298) (clinicaltrials.gov NCT00869726 and ISRCTN98373474).15Six hundred twelve subjects were recruited from 47 centers in 10 countries.
Of the 612 subjects, 553 completed the trial and had usable MR imaging datasets. Ethics committees at each site approved the study, and all subjects signed written informed consents before protocol-required procedures. The details of the design, inclu-sion, and exclusion criteria and results of the 2-year study were previously reported.15There were no significant differences re-garding clinical or MR imaging outcomes between the treatment and placebo cohorts, except the cumulative number of new and enlarging T2 lesions that favored the placebo cohort (P⫽.03).15 Therefore, the subjects in both treatment and placebo arms were pooled together to be analyzed in the current study. MR imaging
data were centrally analyzed by our re-search institution (UBC MS/MRI Re-search Group).
Exclusion criteria for the MR imag-ing data of this retrospective study were the absence of unenhanced T1WI, un-satisfactory image quality due to arti-facts, and the presence of visible lesions in both the left and right DN, thalamus (TH), GP, caudate (CD), and/or frontal white matter in any of the time points. If the MR imaging data met the exclusion criteria, then all imaging studies for the same subject at other time points were re-moved from the study analysis. In addi-tion, subjects who were administered macrocyclic GBCAs (the use of these agents was uncommon during the study period) and/or were scanned on a different MR imaging scanner for any of their follow-up studies were excluded.
GBCA Administration and Type
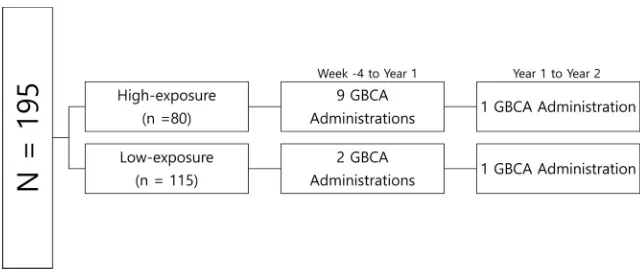
The original study population followed 2 distinct contrast-en-hanced MR imaging follow-up schedules: In the first 100 subjects (high-exposure cohort), 2 MRIs (week⫺4, week 0) were per-formed before the first dose of study medication, followed by further MRIs at weeks 4, 8, and 12. Another MR imaging was then performed immediately before the next dose (week 26), followed by 3 further MRIs at weeks 30, 34, and 38. Annual MRIs were then performed at years 1 and 2 (weeks 52 and 104). Overall, for the year 1 pre-GBCA assessment, 9 GBCA injections were given be-tween week⫺4 and year 1, and for the year 2 pre-GBCA assess-ment, an additional GBCA was administered (from the year 1 MR imaging). The next 453 subjects (low-exposure cohort) had 2 MRIs performed before the first dose of medication (weeks⫺4 and 0) with annual MRIs at years 1 and 2 (weeks 52 and 104). Therefore, for the year 1 pre-GBCA assessment, 2 GBCA injec-tions had been given, and similarly, for the year 2 pre-GBCA as-sessment, an additional GBCA injection was administered (from the year 1 MR imaging) (Fig 1). A random sample of the subjects in the low-exposure cohort was selected proportionately from each high-exposure cohort center. Subjects for this study received a standard single dose of either a linear nonionic agent (gadodi-amide, Omniscan; GE Healthcare, Piscataway, New Jersey) or a linear ionic agent (gadopentetate dimeglumine, Magnevist; Bayer HealthCare Pharmaceuticals, Wayne, New Jersey), depending on the center preference. The same GBCA was used throughout the duration of the study.
MR Imaging Protocol, Processing, and Analysis
Studies were performed with either 1T, 1.5T, or 3T MR imaging scanners (Table 1) using a standardized imaging protocol with whole-brain coverage, 3-mm contiguous axial proton density, T2WI, and pre- and postcontrast (0.1 mmol/kg gadolinium with a 5-minute delay) fast/turbo spin-echo T1WI (TE, 9 –20 ms; TR, 600 – 800 ms; and slice gap, 0 mm). Changes to the MR imaging protocol were not permitted during the trial period.
Group-wise registration was performed using the T2WIs for FIG 1. Gadolinium-based contrast agent administration schedule for high- and low-exposure
[image:2.594.54.376.44.182.2]all subjects across 3 time points (week⫺4, year 1, and year 2) to ensure that the exact same location was measured across all time points. The sample-points (1⫻1 pixel; 1 pixel⫽0.937 mm) were manually placed on the T2WIs by a single reader (M.L.) blinded to cohort assignment at our research institution. T2WIs were chosen instead of T1WIs to blind the reader from any visibly obvious T1 hyperintensity that may bias sample-point placement. In addi-tion, T2WIs enabled the reader to identify the deep brain struc-tures more easily. Sample-points were placed at the center of the
[image:3.594.57.531.54.264.2]left DN, left GP, left TH, left CD head, central pons, and left frontal WM (Fig 2). Normal-appearing WM that was free of any visible lesions was used. If the left side could not be assessed due to the presence of artifacts or visible lesions, then the right side was used. If the deep brain structures were unclear on T2WIs, the same section position of proton density images was used to guide placement. The final sample-point position was confirmed by a second reader (H.K.), and the sample-point measurement was conducted once. The sample-points were then mapped onto the Table 1: Demographics
Characteristic High-Exposure Group (n= 80) Low-Exposure Group (n= 115) PValue
Age (yr)a 51⫾8 (34–64) 52⫾8 (27–82) NS
Sex
Female 52 (65%) 78 (68%)
Male 28 (35%) 37 (32%)
Weight (kg)a 72⫾16 (48–120) 71⫾15 (48–117)
Gadolinium type
Gadodiamide 30 (37.5%) 40 (34.8%)
Gadopentetate dimeglumine 50 (62.5%) 75 (65.2%)
Treatment assignment
MBP8298 41 (51%) 57 (50%)
Placebo 39 (49%) 58 (50%)
EDSS at week⫺4a 5.57⫾1.03 (3–6.5) 5.34⫾1.13 (3–6.5) NS
EDSS at year 2a 5.61⫾1.00 (3.5–6.5) 5.66⫾1.19 (2–7.5) NS
Disease duration (yr)a 13.6⫾5.5 (4–25) 11.7⫾5.1 (2–27) NS
(n⫽65) (n⫽84)
Magnet strength
1T 0 (0%) 4 (3%)
1.5T 58 (73%) 93 (81%)
3T 22 (27%) 18 (16%)
Note:—EDSS indicates Expanded Disability Status Scale; NS, not significant.
a
Data are means⫾SD (range).
[image:3.594.54.531.287.581.2]original precontrast (ie, unenhanced) T1WIs, and mean T1 SIs were obtained. Normalization of the mean T1 SI was performed by calculating the following ratios: DN/pons, GP/WM, CD/WM, and TH/WM.
Statistical Analysis
Statistical analysis was performed with a commercially available medical statistical package (GraphPad Prism software; GraphPad Software, San Diego, California). The two-sample pairedttest was used to evaluate the SI changes in the DN/pons, GP/WM, TH/WM, and CD/WM between week⫺4 and year 1, years 1 and 2, and week⫺4 and year 2 for the high-exposure and low-expo-sure cohorts. The two-sample unpairedttest was used to compare the SI changes in the DN/pons, GP/WM, TH/WM, and CD/WM between the subjects receiving linear nonionic versus the subjects receiving linear ionic GBCAs in the high-exposure cohort from week⫺4 to year 2. For all statistical tests, the level of significance was set atPⱕ.05.
RESULTS
Of the 100 subjects in the high-exposure cohort, 19 had missing MR imaging data at different time points and 1 subject had a major scanner change during follow-up, hence they were ex-cluded. Overall, 80 subjects had complete MR imaging scan sets that also met the acceptance criteria for T1 SI analysis. Of the 453 subjects in the low-exposure cohort, 120 were randomly selected for analysis in which each high-exposure cohort center was pro-portionally represented (Fig 3). Five subjects from the low-expo-sure cohort were administered a macrocyclic agent and were ex-cluded from the analysis. The high- and low-exposure cohorts had similar baseline characteristics (Table 1).
In the high-exposure cohort, 30 subjects received a linear non-ionic agent (gadodiamide, Omniscan), while 50 subjects received a linear ionic agent (gadopentetate dimeglumine, Magnevist). For the low-exposure cohort, 40 subjects received a linear nonionic agent (gadodiamide, Omniscan) and 75 subjects received a linear ionic agent (gadopentetate dimeglumine, Magnevist). In the high-exposure cohort, the left DN or the left WM for 2 subjects was replaced with the right side for all 3 time points due to the presence of a visible lesion. In the low-exposure group, 1 subject’s left WM showed a visible lesion and the right side was used instead for all 3 time points.
Between week⫺4 and year 1, there were significant absolute increases in all measured SI ratios (mean ⫾SD) in the high-exposure group (DN/pons: 0.04 ⫾ 0.09 [relative increase of
⫹4%]; GP/WM: 0.05⫾ 0.09 [relative increase of⫹5%]; CD/ WM: 0.03 ⫾ 0.08 [relative increase of ⫹3%]; and TH/WM: 0.03⫾0.09 [relative increase of⫹3%]) (Table 2andFig 4), while only the DN/pons ratio showed a significant increase in the low-exposure group of 0.05⫾0.17 (relative increase of⫹5%) (Table 3). Between years 1 and 2, when both cohorts received only 1 additional GBCA injection, no significant difference was observed in all SI ratios (Tables 2and3). Overall, from week⫺4 to year 2, significant SI increases were seen in all deep brain structures in the high-exposure cohort, but only the DN/pons ratio continued to show a significant increase in the low-exposure group (Tables 2 and3). In the high-exposure group, 1 outlier was identified in the GP/WM and CD/WM SI measurements (On-Line Fig 1); and in the low-exposure group, 6 outliers in the DN/pons and 1 outlier in the GP/WM, CD/WM, and TH/WM SI measurements were demonstrated (On-Line Fig 2). The overall results and statistical significance remained consistent when the analysis was repeated with the outliers excluded.
Subgroup analysis of the subjects in the high-exposure cohort who received linear nonionic GBCA showed a significant increase in all SI ratios from week⫺4 to year 2 (Table 4). In comparison, for subjects who received a linear ionic GBCA, a significant in-crease was detected for only the DN/pons and CD/WM ratios (Table 4). There was more than a 2-fold difference in the DN/pons ratios, where the linear nonionic GBCA group demonstrated an average of 0.08⫾0.09 (7.8%) increase, compared with 0.03⫾ 0.09 (3.3%) in the linear ionic group (P⫽.02).
DISCUSSION
[image:4.594.63.273.46.326.2]injections.4,6,7,9-14,16-20However, both the low- and the high-ex-posure cohorts had a significant-but-similar increase in the DN within the first year, and a clear dose effect was not seen for this structure. The DN is known to be more sensitive to gadolinium accumulation, and we could be seeing a dose-saturation effect in this structure, though the exact nature is not elucidated by our methodology. The importance of the number of GBCA adminis-trations and its relationship with the T1 hyperintensities is further supported from the results between years 1 and 2, when no SI ratio changes were seen when the same high- and low-exposure co-horts received only 1 GBCA administration during the same period. We suspect that the increases in SI ratios were too minute and our measurement technique was not sensitive in detecting the changes.
[image:5.594.56.530.56.112.2]The subgroup analysis in the high-exposure cohort comparing the linear ionic GBCA (gadopentetate dimeglu-mine) and the linear nonionic GBCA (gadodiamide) showed that the linear nonionic GBCA had the greatest in-crease in T1 hyperintensity in the deep brain structures. In particular, SI in-creases were demonstrated in all deep brain structures with the linear nonionic GBCA, whereas only the DN and CD demonstrated SI increase for the linear ionic GBCA. The DN demonstrated more than a 2-fold difference between the 2 classes of GBCAs, with an 8% increase in the linear nonionic GBCA compared with a 3% increase in the linear ionic GBCA (P⫽.02). These findings demonstratein vivothein vitroresults by Frenzel et al,2who showed that the linear nonionic GBCAs was less stable than the linear ionic GBCAs. In their study, approximately 20% of the gadolinium of the linear nonionic GBCAs was released after 15 days of incubation in human serum, compared with 1%–2% of the gadolinium of the linear ionic GBCAs.2No gadolinium was re-leased with the macrocyclic GBCAs.2Overall, these findings are in support of the hypothesis that the propensity of a GBCA to cause hyperintensity depends on the specific stability of the GBCA.21 Table 4: Absolute and relative increase in signal intensity ratios in subjects who received
linear nonionic and linear ionic GBCA in the high-exposure cohorta ⌬Week –4 to Year 2
Linear Nonionic PValue Linear Ionic PValue
L. DN 0.08⫾0.09 (8%) ⬍.001 0.03⫾0.09 (3%) .01
L. GP 0.06⫾0.06 (6%) ⬍.001 0.02⫾0.11 (2%) NS
L. CD 0.03⫾0.06 (3%) .03 0.03⫾0.10 (3%) .04
L. TH 0.04⫾0.06 (4%) .001 0.02⫾0.10 (2%) NS
Note:—L. indicates left; NS, not significant.
a
Data are absolute (mean⫾SD) and relative (%) increases.
Table 2: Absolute and relative increase in signal intensity ratios for the high-exposure cohorta
⌬Week –4 to Year 1 PValue ⌬Year 1 to Year 2 PValue ⌬Week –4 to Year 2 PValue
L. DN 0.04⫾0.09 (4%) ⬍.001 0.01⫾0.09 (1%) NS 0.05⫾0.09 (5%) ⬍.001
L. GP 0.05⫾0.09 (5%) ⬍.001 ⫺0.02⫾0.11 (⫺1%) NS 0.03⫾0.10 (3%) .005
L. CD 0.03⫾0.08 (3%) ⬍.001 0⫾0.11 (0%) NS 0.03⫾0.09 (3%) .005
L. TH 0.03⫾0.09 (3%) .01 0⫾0.11 (0%) NS 0.03⫾0.09 (3%) .01
Note:—L. indicates left; NS, not significant.
a
Data are absolute (mean⫾SD) and relative (%) increases.
[image:5.594.53.530.140.301.2]FIG 4. Unenhanced axial fast spin-echo T1-weighted MR images of a 48-year-old man in the high-exposure cohort who received linear nonionic GBCA. Images were obtained at week⫺4 (A), year 1 (B), and year 2 (C). A significant increase in T1 signal intensity is visualized in the dentate by year 1 (arrow), which persisted to year 2 (arrow).
Table 3: Absolute and relative increase in signal intensity ratios for the low-exposure cohorta
⌬Week –4 to Year 1 PValue ⌬Year 1 to Year 2 PValue ⌬Week –4 to Year 2 PValue
L. DN 0.05⫾0.17 (5%) .003 0⫾0.20 (0%) NS 0.04⫾0.15 (4%) .003
L. GP 0.01⫾0.09 (1%) NS 0⫾0.17 (0%) NS 0⫾0.18 (0%) NS
L. CD 0.01⫾0.09 (1%) NS 0⫾0.22 (0%) NS 0⫾0.21 (0%) NS
L. TH 0⫾0.09 (0%) NS 0.01⫾0.18 (1%) NS 0.01⫾0.19 (1%) NS
Note:—L. indicates left; NS, not significant.
a
[image:5.594.56.532.357.414.2] [image:5.594.52.376.463.531.2]Recent studies in rats propose that the penetration of GBCAs into the brain may occur through the blood-CSF barrier.22,23 Once inside the brain tissue, the chemical stability and tendency of different GBCAs to dechelate may play an important role in the deposition of gadolinium in brain tissues. A new study by Frenzel et al24showed that after administration of linear ionic and linear nonionic GBCAs, a large portion of the gadolinium was detected in rat brain tissues as insoluble fractions or bound to soluble mac-romolecules, both presumed responsible for increased T1 SI due to their high relaxivity. These molecules were not found for mac-rocyclic GBCAs, which were exclusively detected in the soluble fraction, likely in their intact form, and demonstrated ongoing excretion.24However, more research is required to determine the clinical consequences of gadolinium deposition in either the che-lated or decheche-lated form.
As demonstrated on a histopathologic study, the DN appears to be the most sensitive structure for detecting the T1 SI increase.6 In our study, even after only 2 GBCA administrations, an increase in T1 hyperintensity was detected in the DN. One possible expla-nation is that the DN, along with other deep brain structures, is more susceptible to transmetalation, which allows dechelated gadolinium to form high-relaxivity macromolecules, as described above.25
Our study has several limitations. First, because the number of subjects receiving macrocyclic GBCA was small, this study could not examine the difference between the use of linear and macro-cyclic GBCAs. Second, as with most studies on GBCA administra-tion, the history of prior GBCA administrations and use of other agents could not be determined. Our study shows that there was at least a further increase in the SI during our observation window. Third, due to the multicenter nature of the study, several different MR imaging scanners were used, which may have introduced variations among scans, subjects, and scanners. Effort was made to minimize this issue by proportionately representing each cen-ter in both the high- and low-exposure cohorts. In addition, each follow-up MR imaging study was performed using the same MR imaging machine in the same center for each subject, and the SI was normalized with the reference standard extracted from the same image slice (pons and WM). The DN/pons ratio was chosen because McDonald et al6demonstrated in postmortem tissue 23-fold less gadolinium in the pons than in the DN. The WM tract was chosen for the CD, GP, and TH because it was hypothesized that the WM would accumulate less gadolinium than the gray matter structures, such as the TH. Fourth, the sample-point size used for the study measured 1⫻1 pixel, which likely introduced noise and fluctuations in the SI measurements. However, the small size was chosen to improve the accuracy of the sample-point placement on small structures such as the DN and CD, which was important when the sample-points were mapped from T2WI to T1WI. Furthermore, the degree of SI changes between the high-and low-exposure cohorts was large enough to overcome this lim-itation and demonstrated significant and relatively consistent re-sults. Fifth, the study population had a pre-existing neurologic disease (MS), which may have confounded the results. However, the degree of interference is thought to be minimal because both cohorts had the same diagnosis with similar disease duration and Expanded Disability Status Scale scores without other
po-tential confounding disease processes. Last, the physical, cog-nitive, and behavioral outcomes were not analyzed in this study; however, these are the subject of a current investigation.
CONCLUSIONS
As little as 2 doses of GBCAs can result in an increased T1 SI in the DN that persists for at least 1 year after administration. T1 hyper-intensity in the GP, CD, and TH is evident with greater cumula-tive doses. The degree of increase is related to the location (the DN being the most sensitive), the number of GBCA administrations, and the class of GBCA, with linear nonionic having the greater deposition.
Disclosures: Roger Tam—RELATED: Other: Jefferson Mooney, Comments: Mr Mooney donated $10,000 to support trainees in multiple sclerosis research at the University of British Columbia. This donation had no other restrictions on its use, and we used it to support Megan He, an undergraduate intern who worked on the technical aspects of the project*;UNRELATED:Grants/Grants Pending: Natural Sci-ences and Engineering Research Council of Canada,Comments: grant support from Natural Sciences and Engineering Research Council*;Other: Roche, Genzyme, Com-ments: Our group participates in sponsored clinical studies and clinical trials, which are unrelated to the submitted work.* Anthony Traboulsee—UNRELATED:Other: Consortium of Multiple Sclerosis Centers,Comments: honoraria to develop and disseminate MRI guidelines for diagnosing and monitoring patients with MS, includ-ing the role of gadolinium. Shannon Kolind—UNRELATED:Consultancy: Acorda Therapeutics; Grants/Grants Pending: Sanofi, Roche. Mark S. Freedman—
UNRELATED: Consultancy: Actelion Pharmaceutical, Bayer Healthcare, Biogen, Chugai Pharmaceutical, Clene, EMD Serono Canada, Genzyme, Merck Serono, Med-Day, Novartis, Roche, Sanofi, Teva Pharmaceutical Industries,Comments: consultant, ad board, steering committee;Grants/Grants Pending: Genzyme,Comments: Inves-tigator Sponsored Studies (ISS)*;Payment for Lectures Including Service on Speak-ers Bureaus: Genzyme, Sanofi, Merck, Actelion, Biogen, EMD, Teva Pharmaceutical Industries;Payment for Development of Educational Presentations: Roche. David K.B. Li—UNRELATED:Consultancy: Vertex Pharmaceuticals, Opexa Therapeutics, Adelphi Group,Comments: I have been a consultant for Vertex Pharmaceuticals and served on the Data and Safety Advisory Board for Opexa Therapeutics and the Scientific Advisory Board for the Adelphi Group;Grants/Grants Pending: Genzyme, Hoffmann-la Roche, Merck Serono. Perceptive/Novartis, Sanofi-Aventis, Com-ments: I am the Emeritus Director of the University of British Columbia MS/MRI Research Group, which has received contracts to provide the central MRI analysis for MS clinical trials*;Payment for Lectures Including Service on Speakers Bureaus: Academy of Health Care Learning, Biogen Idec, Consortium of Multiple Sclerosis Centers, Novartis, Sanofi Genzyme, and Teva Pharmaceutical Industries;Payment for Development of Educational Presentations: Academy of Health Care Learning,
Comments: Webinar. *Money paid to the institution in Canadian dollars.
REFERENCES
1. Hao D, Ai T, Goerner F, et al.MRI contrast agents: basic chemistry and safety.J Magn Reson Imaging2012;36:1060 –71CrossRef Medline
2. Frenzel T, Lengsfeld P, Schirmer H, et al.Stability of gadolinium-based magnetic resonance imaging contrast agents in human se-rum at 37°C.Invest Radiol2008;43:817–28CrossRef Medline
3. Tweedle MF, Wedeking P, Kumar K.Biodistribution of radiola-beled, formulated gadopentetate, gadoteridol, gadoterate, and gadodiamide in mice and rats. Invest Radiol1995;30:372– 80
CrossRef Medline
4. Kanda T, Ishii K, Kawaguchi H, et al.High signal intensity in the dentate nucleus and globus pallidus on unenhanced T1-weighted MR images: relationship with increasing cumulative dose of a gadolinium-based contrast material.Radiology2014; 270:834 – 41CrossRef Medline
5. Murata N, Gonzalez-Cuyar LF, Murata K, et al.Macrocyclic and other non– group 1 gadolinium contrast agents deposit low levels of gadolinium in brain and bone tissue: preliminary results from 9 patients with normal renal function.Invest Radiol2016;51:447–53
CrossRef Medline
gadolin-ium deposition after contrast-enhanced MR imaging.Radiology
2015;275:772– 82CrossRef Medline
7. Kanda T, Osawa M, Oba H, et al.High signal intensity in dentate nucleus on unenhanced T1-weighted MR images: association with linear versus macrocyclic gadolinium chelate administration. Ra-diology2015;275:803– 09CrossRef Medline
8. Quattrocchi CC, Mallio CA, Errante Y, et al.Gadodiamide and den-tate nucleus T1 hyperintensity in patients with meningioma evalu-ated by multiple follow-up contrast-enhanced magnetic resonance examinations with no systemic interval therapy.Invest Radiol2015; 50:470 –72CrossRef Medline
9. Errante Y, Cirimele V, Mallio CA, et al.Progressive increase of T1 signal intensity of the dentate nucleus on unenhanced magnetic resonance images is associated with cumulative doses of intra-venously administered gadodiamide in patients with normal renal function, suggesting dechelation.Invest Radiol 2014;49: 685–90CrossRef Medline
10. Radbruch A, Weberling LD, Kieslich PJ, et al.Gadolinium retention in the dentate nucleus and globus pallidus is dependent on the class of contrast agent.Radiology2015;275:783–91CrossRef Medline
11. Cao Y, Huang DQ, Shih G, et al.Signal change in the dentate nucleus on T1-weighted MR images after multiple administrations of gado-pentetate dimeglumine versus gadobutrol.AJR Am J Roentgenol
2016;206:414 –19CrossRef Medline
12. Weberling LD, Kieslich PJ, Kickingereder P, et al.Increased signal intensity in the dentate nucleus on unenhanced T1-weighted im-ages after gadobenate dimeglumine administration.Invest Radiol
2015;50:743– 48CrossRef Medline
13. Radbruch A, Weberling LD, Kieslich PJ, et al.Intraindividual analy-sis of signal intensity changes in the dentate nucleus after consecu-tive serial applications of linear and macrocyclic gadolinium-based contrast agents.Invest Radiol2016;51:683–90CrossRef Medline
14. Ramalho J, Castillo M, AlObaidy M, et al.High signal intensity in globus pallidus and dentate nucleus on unenhanced T1-weighted MR images: evaluation of two linear gadolinium-based contrast agents.Radiology2015;276:836 – 44CrossRef Medline
15. Freedman MS, Bar-Or A, Oger J, et al; MAESTRO-01 Investigators.A phase III study evaluating the efficacy and safety of MBP8298 in
secondary progressive MS. Neurology2011;77:1551– 60 CrossRef Medline
16. Adin ME, Kleinberg L, Vaidya D, et al.Hyperintense dentate nuclei on T1-weighted MRI: relation to repeat gadolinium administra-tion.AJNR Am J Neuroradiol2015;36:1859 – 65CrossRef Medline
17. Flood TF, Stence NV, Maloney JA, et al.Pediatric brain: repeated exposure to linear gadolinium-based contrast material is associ-ated with increased signal intensity at unenhanced T1-weighted MR imaging.Radiology2017;282:222–28CrossRef Medline
18. Hu HH, Pokorney A, Towbin RB, et al.Increased signal intensities in the dentate nucleus and globus pallidus on unenhanced T1-weighted images: evidence in children undergoing multiple gadolinium MRI ex-ams.Pediatr Radiol2016;46:1590 –98CrossRef Medline
19. Ramalho J, Semelka RC, Ramalho M, et al.Gadolinium-based con-trast agent accumulation and toxicity: an update.AJNR Am J Neu-roradiol2016;37:1192–98CrossRef Medline
20. Zhang Y, Cao Y, Shih GL, et al.Extent of signal hyperintensity on unenhanced T1-weighted brain MR images after more than 35 ad-ministrations of linear gadolinium-based contrast agents. Radiol-ogy2017;282:516 –25CrossRef Medline
21. Radbruch A.Are some agents less likely to deposit gadolinium in the brain?Magn Reson Imaging2016;34:1351–54CrossRef Medline
22. Jost G, Frenzel T, Lohrke J, et al.Penetration and distribution of gadolinium-based contrast agents into the cerebrospinal fluid in healthy rats: a potential pathway of entry into the brain tissue.Eur Radiol2017;27:2877– 85CrossRef Medline
23. O¨ ner AY, Barutcu B, Aykol S¸, et al.Intrathecal contrast-enhanced mag-netic resonance imaging-related brain signal changes: residual gado-linium deposition?Invest Radiol2017;52:195–97CrossRef Medline
24. Frenzel T, Apte C, Jost G, et al.Quantification and assessment of the chemical form of residual gadolinium in the brain after re-peated administration of gadolinium-based contrast agents: comparative study in rats. Invest Radiol 2017;52:396 – 404
CrossRef Medline