ORIGINAL RESEARCH
ADULT BRAIN
Shape Features of the Lesion Habitat to Differentiate Brain
Tumor Progression from Pseudoprogression on Routine
Multiparametric MRI: A Multisite Study
XM. Ismail,XV. Hill,XV. Statsevych,XR. Huang,XP. Prasanna,XR. Correa,XG. Singh,X K. Bera,XN. Beig,XR. Thawani, XA. Madabhushi,X M. Aahluwalia, andXP. Tiwari
ABSTRACT
BACKGROUND AND PURPOSE: Differentiating pseudoprogression, a radiation-induced treatment effect, from tumor progression on imaging is a substantial challenge in glioblastoma management. Unfortunately, guidelines set by the Response Assessment in Neuro-Oncology criteria are based solely on bidirectional diametric measurements of enhancement observed on T1WI and T2WI/FLAIR scans. We hypothesized that quantitative 3D shape features of the enhancing lesion on T1WI, and T2WI/FLAIR hyperintensities (together called the lesion habitat) can more comprehensively capture pathophysiologic differences across pseudoprogression and tumor recurrence, not appreciable on diametric measurements alone.
MATERIALS AND METHODS: A total of 105 glioblastoma studies from 2 institutions were analyzed, consisting of a training (n⫽59) and an independent test (n⫽46) cohort. For every study, expert delineation of the lesion habitat (T1WI enhancing lesion and T2WI/FLAIR hyperintense perilesional region) was obtained, followed by extraction of 30 shape features capturing 14 “global” contour characteristics and 16 “local” curvature measures for every habitat region. Feature selection was used to identify most discriminative features on the training cohort, which were evaluated on the test cohort using a support vector machine classifier.
RESULTS:The top 2 most discriminative features were identified as local features capturing total curvature of the enhancing lesion and curvedness of the T2WI/FLAIR hyperintense perilesional region. Using top features from the training cohort (training accuracy⫽91.5%), we obtained an accuracy of 90.2% on the test set in distinguishing pseudoprogression from tumor progression.
CONCLUSIONS: Our preliminary results suggest that 3D shape attributes from the lesion habitat can differentially express across pseudoprogression and tumor progression and could be used to distinguish these radiographically similar pathologies.
ABBREVIATIONS:C⫽curvedness; Gd⫽gadolinium;KT⫽measure of the total curvature; PsP⫽pseudoprogression; RANO⫽Response Assessment in Neuro-Oncology; S⫽sharpness; SI⫽shape index; SVM⫽support vector machine; TP⫽tumor progression
T
he treatment of malignant brain tumors relies heavily on sur-gical resection and chemoradiation therapy, followed by at least 6 months of adjuvant temozolomide.1This treatmentregi-men has been shown to improve overall prognosis in patients with brain tumors. However, a significant challenge postchemoradia-tion is the presence of radiapostchemoradia-tion-induced side effects, such as pseu-doprogression (PsP), which mimic the appearance of tumor pro-gression on posttreatment MR imaging. PsP is an early-delayed benign treatment effect that occurs in approximately one-third of all malignant brain tumors and often stabilizes without further treatment.2In the absence of reliable imaging tools to distinguish PsP from tumor progression,3patients are typically kept on a “wait-and-watch” protocol, causing increased patient anxiety re-garding their disease outcome and, in some cases, leading to un-Received June 11, 2018; accepted after revision September 6.
From the Department of Biomedical Engineering (M.I., P.P., R.C., G.S., K.B., N.B., R.T., A.M., P.T.), Case Western Reserve University, Cleveland, Ohio; Department of Neu-roradiology (V.H., V.S.), Imaging Institute, and Brain Tumor and Neuro-Oncology Center (M.A.), Cleveland Clinic, Cleveland, Ohio; and Department of Radiology (R.H.), Brigham and Women’s Hospital, Dana-Farber/Harvard Cancer Center, Bos-ton, Massachusetts.
Research reported in this publication was supported by the National Cancer Insti-tute of the National InstiInsti-tutes of Health under award Nos. 1U24CA199374-01, R01CA202752-01A1, R01CA208236-01A1, R01 CA216579-01A1, R01 CA220581-01A1; the National Center for Research Resources under award No. 1 C06 RR12463-01; the Department of Defense Prostate Cancer Idea Development Award; the Depart-ment of Defense Lung Cancer Idea DevelopDepart-ment Award; the Dana Foundation David Mahoney Neuroimaging Program; the Ohio Third Frontier Technology Vali-dation Fund; the Wallace H. Coulter FounVali-dation Program in the Department of Biomedical Engineering; and the Clinical and Translational Science Award Program at Case Western Reserve University.
The content of this article is solely the responsibility of the authors and does not necessarily represent the official views of the National Institutes of Health.
Please address correspondence to Marwa Ismail, Ph.D. Case Western Reserve Uni-versity, Department of Biomedical Engineering, 10900 Euclid Ave, Cleveland, OH 44106; e-mail: [email protected]; @Pallavi_Tiwari
Indicates open access to non-subscribers at www.ajnr.org
Indicates article with supplemental on-line appendix and table. Indicates article with supplemental on-line photo.
necessary surgical interventions in patients with PsP with risks of morbidity. There is hence a significant clinical need to accurately differentiate PsP from true progression to improve patients’ treat-ment managetreat-ment.
The Response Assessment in Neuro-Oncology (RANO) crite-ria4are the currently established criteria for posttreatment re-sponse assessment in malignant glioblastomas. The most recent RANO criteria uses semiquantitative bidirectional diametric measurements of enhancing tumor on gadolinium contrast-en-hanced T1WI and T2/FLAIR changes to stratify posttreatment lesions as PsP or tumor progression. However, these semiquanti-tative measurements result in interreader variability5and overes-timation of lesion volume,6confusticating reliable differentiation of PsP from tumor progression. Advanced imaging modalities such as perfusion imaging,7 MR spectroscopy,8and diffusion-weighted imaging9have shown some promise in distinguishing tumor progression from posttreatment radiation effects. They, however, are limited in clinical applicability because they are not universally available and are often difficult to reproduce.10
Recently, “radiomics” (computational feature extraction ap-proaches) have been used in conjunction with routinely available MR imaging sequences for survival prediction and response as-sessment in brain tumors.11,12These radiomic approaches cap-ture higher order quantitative measurements (eg, co-occurrence matrix homogeneity, neighboring gray-level dependence matrix) for modeling macro- and microscale textural and morphologic attributes within the lesion area and drawing associations of these features with clinical outcomes. While a few studies13,14have ex-plored distinguishing radiation necrosis (a delayed radiation-in-duced effect) from tumor recurrence using radiomic texture anal-ysis, relatively little work has focused on distinguishing PsP from brain tumor recurrence, potentially on account of the poorly un-derstood pathophysiology of PsP.3,15
Histopathologically, tumor progression is characterized by the presence of tumor cells, increased cellularity, and vascular prolif-eration and is known to morphologically alter white matter structure in complex ways due to infiltration, displacement, and blood-brain barrier disruption.16Furthermore, some studies have linked the presence of tumor progression with corpus callo-sum involvement and subependymal spread on MR imaging.17 Evidence also suggests that a pronounced local inflammatory tis-sue response may develop in patients with PsP due to inherent and radiation therapy–induced capillary permeability, leading to more pronounced peritumoral brain edema.18These changes in the pathophysiology of tumor progression and PsP are likely seen as morphometric changes in the lesion enhancement on T1-weighted MR imaging as well as perilesional T2WI/FLAIR hyper-intensities but may not be appreciable using bidirectional mea-surements obtained from the RANO criteria alone.
In this work, we attempted to evaluate the role of 3D shape features in enhancing lesion and perilesional regions on T1WI and T2WI/FLAIR hyperintensities to improve the differentiation of PsP from tumor progression on routine MR imaging. We hy-pothesized that uneven tumor growth due to irregular and aggres-sive tumor infiltration will likely induce shape and surface differ-ences in both the enhancing lesion and the T2WI/FLAIR hyperintense perilesional components18-20 (together called the
“lesion habitat”); and the radiomic shape differences in the lesion habitat will likely be different between tumor progression and PsP on routine gadolinium-enhanced T1WI (Gd-T1WI), T2WI, and FLAIR. To our knowledge, this is the first attempt at distinguish-ing PsP from tumor progression through jointly interrogatdistinguish-ing shape features of intratumoral and peritumoral regions from posttreatment MR imaging. We first define a tumor habitat21by delineating 2 compartments for every posttreatment lesion: a perintense enhancing lesion on Gd-T1WI, and T2WI/FLAIR hy-perintense perilesional components constituting both edema and the nonenhancing lesion. We then compute changes in “local” surface and “global” shape radiomic features individually from each of these delineated enhancing lesion and T2WI/FLAIR hy-perintense perilesional regions to capture morphometric differ-ences between tumor progression and PsP. We then identify the most differentiating features from each compartment obtained on the training cohort and evaluate their efficacy on the test co-hort. Additionally, we also consider features combined across both compartments of the lesion habitat to distinguish PsP and tumor progression.
MATERIALS AND METHODS
Study PopulationThis institutional review board–approved and Health Insurance Portability and Accountability Act– compliant study comprised independent training and test cohorts of patients with glioblas-toma from 2 different institutions: Cleveland Clinic and Dana-Farber/Brigham and Women’s Cancer Center. The 2 cohorts were identified by performing a retrospective review of all patients with brain tumors who underwent chemoradiation treatment using the Stupp protocol at the respective institutions and had an en-hancing lesion within 3 months of treatment. Patients who were prescribed bevacizumab or any other treatment after receiving the standard-of-care treatment were excluded from the study. The training cohort consisted of 59 MR images obtained from the Cleveland Clinic, where 38 tumor-progression cases and 21 PsP cases were confirmed for disease presence using the criteria pro-vided below. All 59 cases in the training cohort wereIDH wild-type and were acquired from a 1.5T scanner. The testing cohort was obtained from Dana-Farber/Brigham and Women’s Cancer Center and included 46 cases in which 33 tumor progression cases and 13 PsP cases were confirmed for disease presence using crite-ria similar to that used for the training cohort. Informed consent was obtained for all patients involved in the study. Forty-two cases in the test cohort wereIDHwild-type, whereas the remaining 4 wereIDHmutant. For T2WI and FLAIR scans, slice thickness was 4 mm; slice gap, 0.8 mm; and FOV, 210 mm, whereas for MPRAGE, the volumetric acquisition had a voxel size of 1⫻1⫻ 1 mm. The acquisition matrices for T2, FLAIR, and MPRAGE scans were 224⫻320, 168⫻256, and 256⫻256, respectively.
Table 1summarizes the demographics for this study population.
Confirmation for Disease Presence
diag-nostic image quality as determined by collaborating radiologists; and 4) patients with posttreatment enhancing lesions with⬎5 mm of rim enhancement and the availability of diagnostic reads of the lesion as belonging to PsP or tumor progression following disease confirmation. Confirmation for progression or pseudo-progression was obtained by either histologic analysis in some cases or follow-up imaging. Continued enhancing tumor size in-crease on follow-up MR imaging within the subsequent 6-month period was considered progression, while reduction in tumor size or growth within the subsequent 6-month period was considered pseudoprogression.
Preprocessing
For every patient study, the 3 MR imaging sequences, Gd-T1WI, T2WI, and FLAIR, were coregistered to a T1-weighted brain atlas (Montreal Neurological Institute 152) using 3D Slicer (http:// www.slicer.org). Registering every study to an average standard brain atlas allowed us to perform reliable cross-patient shape analyses across the 2 sites. Bias field correction was then con-ducted using a nonparametric nonuniform intensity normaliza-tion technique.22Skull stripping was finally performed via the skull-stripping module in 3D Slicer.23
Segmentation of Lesion Habitat
Segments were conducted for every MR imaging slice with⬎5 mm of rim enhancement as recognized by an expert radiologist (V.S.). Every lesion was annotated into 2 regions: an enhancing lesion and a T2WI/FLAIR hyperintense perilesional component. T1WI scans were used to delineate the enhancing lesion, while both T2WI and FLAIR scans were used to annotate the T2WI/ FLAIR hyperintense perilesional compartment. Scans were man-ually annotated across contiguous slices by 2 experienced board-certified neuroradiologists with ⬎10 years of experience, V.H. and V.S. (1 for each site), via a hand-annotation tool in 3D Slicer. All segmentations of MR images were conducted on a standard desktop computer, with 24 GB RAM, and GT 730 GPU (NVIDIA, Santa Clara, California), with a Cintiq 22HD touchscreen moni-tor (Wacom, Saitama, Japan).
Feature Extraction
Global Features. Fourteen global shape features were extracted from the enhancing lesion and T2WI/FLAIR hyperintense perile-sional compartments for each subject. These features aim to char-acterize the global contour of the ROI, such as volume (number of voxels in the ROI), major and minor axes (longest and shortest diameters of the shape), and elongation (ratio between major and minor axes of the ROI). Extracted features are based on an Insight Segmentation and Registration Toolkit (ITK) implementation
(www.itk.org). Descriptions of the 14 global shape features are provided in the On-line Table and Appendix.
Local Features. The local features were mainly derived from cur-vature measures computed for the surface of every 3D segmented compartment (enhancing lesion or T2WI/FLAIR hyperintense perilesional regions) on a voxel basis. An isosurface is first con-structed from each 3D compartment, followed by computing the first and second fundamental forms of the surface. Gaussian and mean curvatures are computed from these fundamental forms for each voxel.24 Four measures that capture the local curvature changes are then derived from Gaussian and mean curvatures; curvedness (C), sharpness (S), shape index (SI), and total curva-ture (KT).
For each segmented compartment, the mean, median, kurto-sis, and SD of curvedness, shape index, sharpness, and total cur-vature were extracted (ie, a total of 16 local features were extracted per compartment per subject). Computations were implemented using in-house software implemented in Matlab R2016a platform (MathWorks, Natick, Massachusetts). A detailed description of the local features is provided in the On-line Table and the Appendix.
Feature Selection and Classification
A sequential feed-forward feature-selection algorithm25was used so that only a subset of the top discriminative features is automat-ically selected for classification, and at each iteration, an addi-tional feature is sequentially included in the feature set. The scheme starts from an empty feature vector and then gradually adds features that are most discriminative between the 2 groups until there is no improvement in the prediction. The selection algorithm was used along with a support vector machine (SVM) classifier,26a robust machine-learning classifier that is commonly used for classification of biomedical data. In this work, we used a nonlinear radial basis function kernel within the SVM. To avoid training bias, we used a 4-fold cross-validation scheme within the training set, in which 3 folds were used for training and the fourth fold was held out for testing. The experiment was run 100 times, and the features that appeared most frequently across all runs were identified as the top discriminative features within the train-ing cohort. Top performtrain-ing features were then used within the independent test cohort for distinguishing PsP from tumor pro-gression. Specifically, we used the following experiments:
Experiment 1: Distinguishing PsP from Tumor Progression Using the Shape Features of the Enhancing Lesion Alone. Local and global features extracted from the lesion compartment (30 in to-tal) were used to train an SVM classifier. The top 5 features chosen by the classifier across the 100 runs were identified as the most discriminative subset from a total of 30 features for the enhancing lesion regions and used within the independent test set to distin-guish PsP from tumor progression.
Experiment 2: Distinguishing PsP from Tumor Progression Using T2WI/FLAIR Hyperintense Perilesional Shape Features Alone.
[image:3.594.51.286.63.130.2]Local and global features extracted from the T2WI/FLAIR hyper-intense perilesional compartment (30 in total) were used to train an SVM classifier. The top 5 features selected by the classifier across the 100 runs were identified as the most discriminative Table 1: Summary of study population across the training and
test cohorts
Characteristic Training Testing
No. of patients 59 46
Women 20 16
Men 39 30
Mean age (yr) 60.6 55.6
subset from a total of 30 features extracted from T2WI/FLAIR hyperintense perilesional regions and used within the indepen-dent test set for distinguishing PsP from tumor progression.
Experiment 3: Distinguishing PsP from Tumor Progression Using Integrated Tumor Habitat Shape Features. All 60 features ex-tracted from both the enhancing lesion and T2WI/FLAIR hyper-intense perilesional compartments were used in conjunction to train an SVM classifier. The top 5 features selected by the classifier from both enhancing lesion and T2WI/FLAIR hyperintense peri-lesional features across 100 runs of cross-validation were identi-fied as the most discriminative from the 60 features extracted across the lesion habitat and used within the independent test set to distinguish PsP from tumor progression.
Statistical Analysis
Statistical analysis was performed using a nonparametric Wil-coxon signed ranked test to further evaluate whether there are significant differences in PsP and tumor progression, across the top performing features that were selected by the classifier.
Evaluating Variability of Top Shape Radiomic Features across the 2 Sites
To test the variability of the top features selected by the classifier across the 2 sites, we computed their correlation coefficients be-tween the training and testing sets across true progression and PsP. The correlation coefficients were computed for every feature, separately for every class (PsP or tumor progression) across the 2 sites, with high correlation values reflecting less variability across fea-tures across the 2 sites and low values reflecting more variability.
RESULTS
Experiment 1: Distinguishing PsP from Tumor Progression Using Enhancing Lesion Shape Features Alone
Classification in the Training Cohort. Following SVM classifica-tion using shape features of the enhancing lesion alone, the fol-lowing 5 features were identified as the top discriminative features between tumor progression (TP) and PsP cases: 3 global features constituting roundness (0.5⫾0.16 TP, 0.33⫾0.15 PsP), eccen-tricity (0.8⫾0.1 TP, 0.912⫾0.08 PsP), and compactness (0.3⫾ 0.2 TP, 0.1⫾0.24 PsP) and 2 local features including the mean of
KT(0.11⫾0.01 TP, 0.09⫾0.01 PsP), and the SD of S (4⫾2 TP,
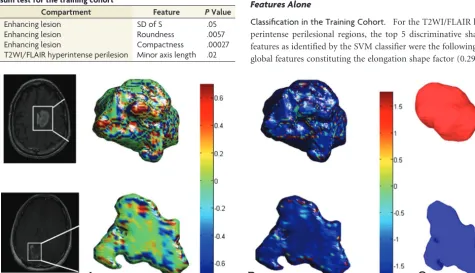
1⫾0.9 PsP). Adding additional features to this subset did not improve the classification accuracy. Three of the top 5 features, compactness, roundness, and the SD of S, also were statistically significantly different between PsP and tumor progression (Table 2). Figure 1demonstrates color maps of the enhancing lesion subcompartment of a tumor progression case and a PsP case, reflecting 3 of the top discriminative local and global features. Using the shape features of the enhancing lesion within the SVM classifier, we correctly classified 50 of 59 subjects (accuracy⫽ 84.75%). Five of the misclassified cases were tumor progression, while the other 4 were PsP.
Classification in the Test Cohort. When we applied the top 5 discriminative features obtained on the training set for enhancing lesions to the test set (n⫽41, 29 tumor progression cases and 12 PsP cases), the classifier missed 3 tumor progression cases and 4 PsP cases (accuracy⫽83%).
Experiment 2: Distinguishing PsP from Tumor Progression Using the T2WI/FLAIR Hyperintense Perilesional Shape Features Alone
Classification in the Training Cohort. For the T2WI/FLAIR hy-perintense perilesional regions, the top 5 discriminative shape features as identified by the SVM classifier were the following: 2 global features constituting the elongation shape factor (0.29⫾
FIG 1. Color maps visualizing the significant local features on an enhancing lesion region for a TP case (upper row) and a PsP case (lower row). The KTmeasure is shown inA, whereas the S measure is shown inB. C,Surface-rendering for the 2 cases shows the compactness global feature that
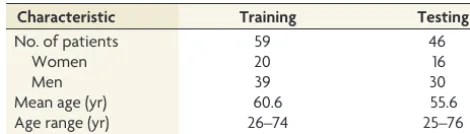
[image:4.594.54.530.424.697.2]was discriminative by the classifier. The PsP mass is more elliptic, whereas the tumor appears to be more compact. Table 2: Statistically significant features using the Wilcoxon rank
sum test for the training cohort
Compartment Feature PValue
Enhancing lesion SD of S .05
Enhancing lesion Roundness .0057
Enhancing lesion Compactness .00027
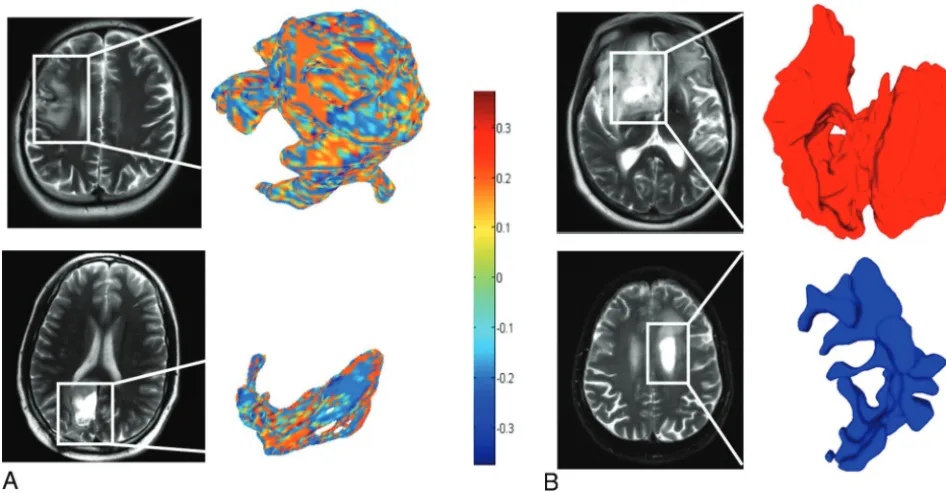
0.2 TP, 0.6⫾0.43 PsP) and minor axis length (0.5⫾0.23 TP, 0.4⫾0.24 PsP) and 3 local features including a median of S (0.1⫾0.03 TP, 0.09⫾0.01 PsP), a median of C (0.05⫾0.03 TP, 0.03⫾0.03 PsP), and a median of SI (0.05⫾0.01 TP, 0.03⫾0.01 PsP). These features correctly classified 52 of 59 patients (accu-racy⫽88.14%), with 4 PsP cases and 3 tumor progression cases misclassified. Minor axis length was statistically significant as well (Table 2).Figure 2demonstrates the SI and the elongation shape factor features for T2WI/FLAIR hyperintense perilesional areas of both a TP and a PsP case.
Classification in the Test Cohort. Of the 46 test studies that in-cluded the T2WI/FLAIR hyperintense perilesional compartment, the top 5 features obtained by the classifier from the T2WI/FLAIR hyperintense perilesional areas as identified on the training set correctly classified 27 of the 33 subjects with tumor progression, as well as 11 of the 13 PsP cases (accuracy⫽82.6%).
Experiment 3: Distinguishing PsP from Tumor Progression Using Integrated Lesion Habitat Features
Classification in the Training Cohort. When integrating shape and surface features from the enhancing lesion as well as the T2WI/FLAIR hyperintense perilesional regions within an SVM classifier, we selected a set of top 5 features from the training set. The top 5 features included the T2WI/FLAIR elongation shape
factor of the perilesion, and the median of C as well as the mean of
KT, roundness, and eccentricity of the enhancing lesion. These top
features correctly identified 54 of 59 subjects (accuracy⫽91.5%), with 2 tumor progression and 3 PsP cases misclassified. A sum-mary of the top discriminative features for all the 3 experiments is provided inTable 3.
Classification in the Test Cohort. Using integrated top features from both enhancing lesion and T2WI/FLAIR hyperintense peri-lesional areas (5 in total across both compartments) on the test cases resulted in 37 of the 41 cases being correctly classified (ac-curacy⫽90.2%). All 29 tumor-progression cases were correctly classified, and 8 of 12 PsP cases were correctly classified, suggest-ing that includsuggest-ing T2WI/FLAIR hyperintense perilesional shape features along with the enhancing lesion shape features improved the performance of the classifier.
Evaluating Variability of Top Shape Radiomic Features across the 2 Sites
[image:5.594.54.527.47.293.2]The On-line Figure shows boxplots for the top 3 features (SD of S of the enhancing lesion and T2WI/FLAIR median of C and me-dian of S of the hyperintense perilesion) for both true progression and PsP classes across the 2 cohorts. The correlation coefficients for the lesion SD of S for both true progression and PsP across the 2 sites were 0.88 and 0.77, respectively, whereas they were 0.75 and FIG 2. A, Color maps visualizing a significant local feature (shape index) on a peritumoral region for a tumor progression case (upper row) and a PsP case (lower row).B, Surface-rendering for 2 other cases that visualize the elongation shape factor feature as a discriminative feature between tumor progression and PsP. The higher elongation shown in thelower rowfor the PsP case is aligned with the previous findings reporting a rather elongated and elliptic shape of benign masses.31
Table 3: Experiments conducted on the training and testing cohorts and the corresponding classifier performance
Compartment Features Training Testing
Enhancing lesion Mean ofKT, SD of S, roundness, eccentricity,
compactness
38 TP, 21 PsP: Accuracy⫽84.75% 29 TP, 12 PsP: Accuracy⫽83%
T2WI/FLAIR hyperintense perilesion
Median of C, median of S, median of SI, minor axis length, elongation shape factor
38 TP, 21 PsP: Accuracy⫽88.14% 33 TP, 13 PsP: Accuracy⫽82.6%
Lesion habitat Lesion: Mean ofKTroundness, eccentricity
T2WI/FLAIR hyperintense
Perilesion: median of C, elongation shape factor
[image:5.594.53.533.350.424.2]0.81 for T2WI/FLAIR median of C of the hyperintense perilesion and 0.9 and 0.775 for T2WI/FLAIR median of S of the hyperin-tense perilesion. These relatively high values of correlation coef-ficients between the 2 sites for both groups seem to suggest low variability across the 2 sites (Cleveland Clinic and Dana-Farber/ Brigham and Women’s Cancer Center) for the best performing features.
DISCUSSION
Distinguishing tumor progression from PsP is currently one of the greatest clinical challenges in neuro-oncology.2We present the first approach at assessing the effectiveness of 3D shape and surface radiomic features extracted from the tumor habitat (en-hancing lesion and T2WI/FLAIR hyperintense perilesional re-gions) to differentiate tumor progression from PsP on conven-tional MR images (Gd-T1WI, T2WI, FLAIR). Our work was based on the rationale that there are observable 3D shape and surface irregularities encountered on the enhancing lesion as well as the perilesional boundaries in patients with tumor recurrence (potentially due to aggressive tumor infiltration and disruption) compared with those with benign pseudoprogression, which will likely have more regular boundaries.16,19,20
Multiple experiments were conducted, including using shape features from the enhancing lesion alone and from T2WI/FLAIR hyperintense perilesional areas alone and finally using the feature set of both compartments for distinguishing tumor progression from PsP. Results summarized inTable 3suggest that using the integrated set of features from the lesion habitat provided the best classification accuracies in distinguishing PsP from tumor pro-gression. When we used integrated shape features from the lesion habitat, classification accuracies were improved for both training and testing cohorts, with significant improvement in the test co-hort (90.2% accuracy versus 83% for the lesion alone and 82.6% for T2WI/FLAIR hyperintense perilesion). One hundred percent sensitivity was obtained for identifying tumor progression cases for the test cohort, and only 2 cases of 38 in the training cohort were misclassified. A study has previously suggested the presence of more defined peritumoral edema in patients with PsP due to local inflammatory tissue response caused by inherent and radia-tion therapy-induced capillary permeability.18These changes are likely seen as changes in shape features in the perilesional com-partment contributing to improved distinction of PsP from tu-mor progression.
For the global radiomic features, minor axis length and the elongation shape factor of T2WI/FLAIR hyperintense perilesional areas were the most discriminative between tumor progression and PsP. The elongation shape factor had higher values in PsP, which agree with previous findings that benign masses tend to be more elongated and elliptic than tumor-progression cases.20,27 The discriminative features of the enhancing lesion compartment (eccentricity, roundness, and compactness) also agree with pre-vious findings that emphasized the anisotropic, irregular struc-ture of lesion regions in tumor progression compared with a rather elliptic shape of benign brain masses.20This finding was supported by the higher eccentricity values of PsP cases (ie, more elliptic and elongated) than tumor progression cases shown in our results. Our reported findings in global shape differences between
tumor progression and PsP are also supported by findings in breast tumors that aimed at quantifying tumor boundaries using various shape descriptors (eg, compactness, moments) for tumor classification.27,28Other studies showed that measures of circu-larity (ie, roundness), size, and irregucircu-larity could distinguish pri-mary glioblastomas and metastases.16,29
Surface features measuring local curvatures showed higher dominance in the enhancing lesion and in T2WI/FLAIR hyperin-tense perilesional regions of tumor progression cases (Fig 1). This could be attributed to tumors tending to alter the structure of white matter through infiltration and disruption, which eventu-ally causes many shape irregularities leading to notable tumor surface changes.16A study on local curvature analysis for classify-ing breast tumors similarly demonstrated that malignant tumor masses had more variations in their local curvature measures than benign masses.30
The stability analysis of the top features showed relatively high values of correlation coefficients of the top features across the 2 sites for tumor progression and PsP. This finding suggests that the most discriminative shape features of PsP versus tumor progres-sion are also likely stable across the 2 sites.
This study, however, has its limitations. The results reported are preliminary because our training and testing cohorts were limited to a relatively small sample size. A large independent mul-tisite validation should be performed to further validate our find-ings. While the training and test data within the respective sites were largely consistent, the potential variability introduced due to differences in imaging sequence parameters (ie, slice thickness, scanner) across the training and test sets was not explicitly studied in this work and will be a part of a future study. Additionally, the cohorts included in this study did not have information regarding the administration of steroids posttreatment; hence, this could not be studied. The ground truth for most of the studies was obtained from follow-up imaging scans and lacked histologic confirmation.
While this study is preliminary, the top features identified in the training cohort (an overall accuracy of 91.5%) seemed to per-form well in the independent cohort, with an accuracy of 90.2%. Future studies will involve a large-scale validation of these find-ings to create a “lockdown” classifier by identifying the most dis-criminative and stable features using data cohorts from multiple institutions.
Future work will also focus on integrating the most discrimi-native shape features with radiomic texture features13as well as other clinical parameters (age, sex, Karnofsky performance score) and investigating their performance in distinguishing PsP from tumor progression.
CONCLUSIONS
Disclosures: Virginia Hill—UNRELATED:Consultancy: Google,Comments: Google asked me radiology questions for 30 minutes, and I will be paid $75;OTHER RELA-TIONSHIPS: Some of my coworkers and I are in discussions with Enlitic to embark on a joint research project automating detection of head CT emergencies. This has nothing to do with this article. Manmeet Aahluwalia—UNRELATED:Consultancy: Monteris Medical, AstraZeneca, Bristol-Myers Squibb, Abbvie, Varian Medical Sys-tems, Flatiron, CBT Pharmaceuticals, Incyte;Grants/Grants Pending: Novartis, Bris-tol-Myers Squibb, AstraZeneca, NovoCure, Pharmacyclics, Incyte, Abbvie, Merck;
Stock/Stock Options: MimiVax, Doctible.
REFERENCES
1. Wick W, Chinot OL, Bendszus M, et al.Evaluation of pseudoprogres-sion rates and tumor progrespseudoprogres-sion patterns in a phase III trial of bevaci-zumab plus radiotherapy/temozolomide for newly diagnosed glio-blastoma.Neuro Oncol2016;18:1434 – 41CrossRef Medline
2. Clarke JL, Chang S.Pseudoprogression and pseudoresponse: chal-lenges in brain tumor imaging.Curr Neurol Neurosci Rep2009;9: 241– 46CrossRef Medline
3. Parvez K, Parvez A, Zadeh G.The diagnosis and treatment of pseu-doprogression, radiation necrosis and brain tumor recurrence.Int J Mol Sci2014;15:11832– 46CrossRef Medline
4. Wen PY, Macdonald DR, Reardon DA, et al.Updated response as-sessment criteria for high-grade gliomas: Response Asas-sessment in Neuro-Oncology working group. J Clin Oncol 2010;28:1963–72
CrossRef Medline
5. Provenzale JM, Ison C, DeLong D.Bidimensional measurements in brain tumors: assessment of interobserver variability.AJR Am J Roentgenol2009;193:W515–22CrossRef Medline
6. Dempsey MF, Condon BR, Hadley DM.Measurement of tumor “size” in recurrent malignant glioma: 1D, 2D, or 3D?AJNR Am J Neuroradiol2005;26:770 –76Medline
7. Mitsuya K, Nakasu Y, Horiguchi S, et al.Perfusion weighted mag-netic resonance imaging to distinguish the recurrence of metastatic brain tumors from radiation necrosis after stereotactic radiosur-gery.J Neurooncol2010;99:81– 88CrossRef Medline
8. Elias AE, Carlos RC, Smith EA, et al.MR spectroscopy using normal-ized and non-normalnormal-ized metabolite ratios for differentiating re-current brain tumor from radiation injury.Acad Radiol2011;18: 1101– 08CrossRef Medline
9. Asao C, Korogi Y, Kitajima M, et al.Diffusion-weighted imaging of radiation-induced brain injury for differentiation from tumor re-currence.AJNR Am J Neuroradiol2005;26:1455– 60Medline
10. Brandsma D, Stalpers L, Taal W, et al.Clinical features, mechanisms, and management of pseudoprogression in malignant gliomas. Lan-cet Oncol2008;9:453– 61CrossRef Medline
11. Kickingereder P, Burth S, Wick A, et al.Radiomic profiling of glioblastoma: identifying an imaging predictor of patient survival with improved performance over established clinical and radio-logic risk models.Radiology2016;280:880 – 89CrossRef Medline
12. Yang D, Rao G, Martinez J, et al.Evaluation of tumor-derived MRI-texture features for discrimination of molecular subtypes and pre-diction of 12-month survival status in glioblastoma.Med Phys2015; 42:6725–35CrossRef Medline
13. Tiwari P, Prasanna P, Wolansky L, et al.Computer-extracted texture features to distinguish cerebral radionecrosis from recurrent brain tumors on multiparametric MRI: a feasibility study.AJNR Am J Neuroradiol2016;37:2231–36CrossRef Medline
14. Zhang Z, Yang J, Ho A, et al.A predictive model for distinguishing radiation necrosis from tumor progression after gamma knife
ra-diosurgery based on radiomic features from MR images.Eur Radiol
2018;28:2255– 63CrossRef Medline
15. Ellingson BM, Chung C, Pope WB, et al.Pseudoprogression, radio-necrosis, inflammation or true tumor progression? Challenges as-sociated with glioblastoma response assessment in an evolving therapeutic landscape. J Neurooncol 2017;134:495–504 CrossRef Medline
16. Goldberg-Zimring D, Talos IF, Bhagwat JG, et al.Statistical valida-tion of brain tumor shape approximavalida-tion via spherical harmon-ics for image-guided neurosurgery.Acad Radiol2005;12:459 – 66
CrossRef Medline
17. Kumar AJ, Leeds NE, Fuller GN, et al.Malignant gliomas: MR imag-ing spectrum of radiation therapy-and chemotherapy-induced ne-crosis of the brain after treatment. Radiology 2000;217:377– 84
CrossRef Medline
18. Brandes AA, Tosoni A, Spagnolli F, et al.Disease progression or pseu-doprogression after concomitant radiochemotherapy treatment: pit-falls in neurooncology.Neuro Oncol2008;10:361– 67CrossRef Medline
19. Bharath K, Kurtek S, Rao A, et al.Radiologic image-based statistical shape analysis of brain tumors.Journal of the Royal Statistical Society: Series C (Applied Statistics).Accessed January 29, 2018
20. Wu P, Xie K, Zheng Y, et al.Brain tumors classification based on 3D shape.In: Jin D, Lin S, eds.Advances in Future Computer and Control Systems. Berlin: Springer; 2012;160:277– 83
21. Gatenby RA, Grove O, Gillies RJ.Quantitative imaging in cancer evolution and ecology.Radiology2013;269:8 –15CrossRef Medline
22. Tustison NJ, Avants BB, Cook PA, et al.N4ITK: improved N3 bias correction. IEEE Trans Med Imaging 2010;29:1310 –20 CrossRef Medline
23. Tao X, Chang MC.A skull stripping method using deformable surface and tissue classification.In:Medical Imaging: Image Processing.Ohio: International Society for Optics and Photonics; 2010;7623:76233L 24. Pienaar R, Fischl B, Caviness V, et al.A methodology for analyzing
curvature in the developing brain from preterm to adult.Int J Im-aging Syst Technol2008;18:42– 68CrossRef Medline
25. Marcano-Cedeno A, Quintanilla-Domínguez J, Cortina-Januchs MG, et al.Feature selection using sequential forward selection and classifi-cation applying artificial metaplasticity neural network.In:Proceedings of the Annual Conference of the Institute of Electrical and Electronics Engi-neers Industrial Electronics Society.Glendale, Arizona; November 7–10, 2010;2845–50
26. Guyon I, Weston J, Barnhill S, et al.Gene selection for cancer classi-fication using support vector machines.Machine Learning2002;46: 389 – 422CrossRef
27. Chen Y, Gunawan E, Low KS, et al.Effect of lesion morphology on microwave signature in 2-D ultra-wideband breast imaging.IEEE Trans Biomed Eng2008;55:2011–21CrossRef Medline
28. Tsui PH, Liao YY, Chang CC, et al.Classification of benign and malignant breast tumors by 2-D analysis based on contour descrip-tion and scatterer characterizadescrip-tion.IEEE Trans Med Imaging2010; 29:513–22CrossRef Medline
29. Zacharaki EI, Wang S, Chawla S, et al.Classification of brain tumor type and grade using MRI texture and shape in a machine learning scheme.Magn Reson Med2009;62:1609 –18CrossRef Medline
![3 [2 (9 Ethyl 9H carbazol 3 yl) 6 methyl 3 quinolyl]propan 1 ol](data:image/gif;base64,R0lGODlhAQABAIAAAP///wAAACH5BAEAAAAALAAAAAABAAEAAAICRAEAOw==)