Lesley A. Cal
a
1Gary W. Thickbroom
2
John L. Black2
David W. K
. Collins2
Frank
L.Mastaglia
3Received March 20. 1980; accepted after re-vision August 13. 1980.
This work was supported in part by a grant
from the National Health and Medical Research
Council of Australia and by the Special Purposes Fundc Radiology, Sir Charles Gairdner Hospital.
'Department of Diagnostic Radiology, Sir
Charles Gairdner Hospital, Queen Elizabeth II
Medical Centre, Nedlands, Western Australia
6009. Address reprint requests to l. A. Cala.
2Department of Biophysics, Sir Charles Ga
ird-ner Hospital, Queen Elizabeth II Medical Centre, Nedlands, Western Australia 6009.
JDepartment of Medicine, University of Western Australia, and Queen Elizabeth II Medical Centre, Nedlands, Western Australia 6009.
AJNR 2:41-47, January/February 1981 0195-6108/81/0021-0041 $00.00 © American Roentgen Ray Society
Brain Density and
Cerebrospinal Fluid Space
Size:
CT of Normal Volunteers
41
This study attempted to establish normal values for cerebral white and deep gray matter density and total brain density, and to discover how much dilatation of the cerebrospinal fluid-containing spaces occurs with advancing age up to 40 years. The
53 female and 62 male healthy volunteers, 15-40 years old, had been screened to
exclude individuals with neurologic disease, previous head trauma, congenital or acquired heart disease, chronic pulmonary disease and other systemic illness, and those who consumed mo-re than small amounts of alcoholic beverages. The computed
tomography scan data for the 115 subjects were scored subjectively for the severity of
atrophy. It was found that in both genders there was an increasing frequency with advancing age of sulcal widening of the frontal lobes and cerebellar vermis starting in the teens. A ventriculo-internal cranial ratio was calculated for 93 subjects who had been examined on the EMI CT 1010, the mean value being 0.31 ± 0.08 for females and 0.33 ± 0.06 for males. The ratio did not change significantly with age up to 40 years.
On the same 93 subjects, mean values and standard deviations were obtained for normal white matter (30.1 ± 3.5 Hounsfield units (H) for females and 29.8 ± 3.3 H for
males) and for normal deep gray matter (33.0 ± 3.3 H for females; 33.2 ± 2.6 H for
males) and for total brain density (33.9 ± 2.7 H for females; 33.6 ± 2.6 H for males).
Normal data for brain density and for the dimensions of the ventricular system
and subarachnoid spaces are required for interpretation of the computed tomog -raphy (CT) scan in patients under investigation for neurologic diseases. A number of previous studies of these parameters have been based on the analysis of
selected normal CT scans performed for diagnostic purposes [1 -6]. There have been few studies of normal volunteers [1, 7-9] and few systematic studies of
changes associated with aging [1, 2, 7]. Moreover, previous studies of brain density were performed with the older water-bag scanning models and there are
no normal volunteer data from the newer EMI CT 1010 scanners. We report the results of a 4 year study of the normal CT scan which began to provide control data for a study of patients with demyelinating disease [10]. Data are presented on brain density in 93 normal volunteers and lateral ventricular size and sulcal widening in a group of 115 normal volunteers 15-40 years old.
Subjects and Methods
Volunteers were from various backgrounds, but there was a preponderance of medical and nonmedical professional people, some of whom were still students at secondary or
tertiary schools. The subjects knew they were participating in a research study; they were
not paid and they signed an informed consent form approved by the Human Rights
Committee of the University of Western Australia. Radiation exposure conformed to the regulations of the National Health and Medical Research Council of Australia. Parents gave
written permission for minors.
42
CALA ET AL AJNR:2, January/February 1981'1''11 veNl,., cv"." ~"I I: IIIAf1 ..
~ 100 ,HU'I'
A
IHTI 'O"M
NU~~
U
.
-HOO pi".I.)TIt~~'iiU' II 0 ft~ul.,
r;...'Werw~
~~~~ ~~41
~~-~
~~
41~41
r-=~h-CAUDATE
NUCLEUS
B
D
~mrm'ffi>~
Ifl<j;IJQ/~ ~Me
Ii'li 7!
H
ro
~~ ~5;
~~ 11~
~ 5;
({)J ~
~'I ~ ~~t/t ~~ ~ ~~, ~ nl!ll<liI~ ~ 1fi@j!lJ~
~1jjj.II1WIIi/,t~rs lOIJiilmn il!lll~~ 0Jf ~~ 1tIr4l!ll!l'lll1rill.,1i1iI~rmJl i~ce iir1J ~~ 0Jf ~j)X @~ 0Jf I~r 1M I~RIIlIi~11lIilit IjliM ~ " 1M ~tt fi!iliiW~m~lifS~~~~~
li1fl1er~lt%fJr~~$W.I!~~~I(1t({)J~~~1i4l1i11ll1lll~~j~
CQJrl1itl111e ~I 111iffi4II1 'Mi~~ II~ ~ ~ ~11 ~jQJ ~4I:sJ
IjfJilil~~~~~~~~<M1lttlrrrelEt4llltC;lI"1i({)J1i({)JI~~ilIIl$t
1W€r~ ~~Ijjj ~r ~ 0if ~!i!Jlzr~mmlltiwilfj~. ~II
~im 1W€r~ IiD'0'rWiIilitIlfQj IP->'M~'~I ~ ttlrrre ~lr~l1rit~llj~.
li1rt~~\!I!ti~~~Ii1~<M1lttlrrre~nilwrilllililtlitl\ltl!Jttlllf~~~
~, ~i1;JrdI~ ~j)X ~~ 1i~ rmlI\ll $:/j~. li11~ ~~ <M1l ttllrre JjI~r illlililt 1W€r~ ~ilfj ~ filfil.~ ~r twiTilro@f~Jtj~ @!lit:>; ~~@jtt/t ~® ~ ~ j' , ~I~~W 11 rmlI\ll ~Jtji1;J '. ltilt limit, ~1Wl!I ~11flWlji:Mtf$
1/lmiJe $:/i~ ttlttmt 1l!flIe $:/il0'e 1l!Jtj~ i~ ~W ~ ~ lJitIiIilI. 1l1~
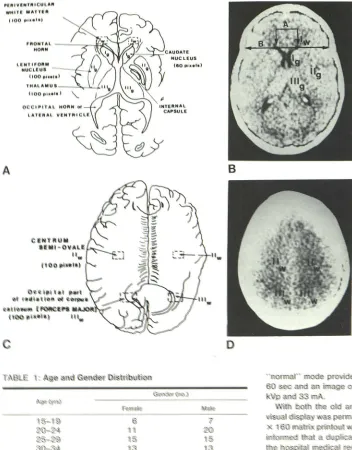
Fig. 1.- A and B, 3A level. Gray matter sites, I, (caudate nucleus), 110 (lentiform nu-cleus), and Ilig (thalamus), frontal periventric -ular white matter (I •.. ). Evans ratio = bifrontal ventricular span (A):internal cranial diameter at level of frontal horns (B). C and D, 4A level. White matter sites II", (centrum oval e) and 111." (forceps major).
"II1IIl1Jmll<!ill"" IiOOIdIe proWdiedi I0OI the l11IIadliioo witIt1 a S'ICafll1l01ilg -I «lJ 00 !Sa<!;: 00IIdI M ii 00 iii! 00 X ~ 00 ma triil)'( ~was lISllNi1. Wlil1l!n 2«))
\rJ!)J~3311il _
~.Itn I!w>tihI WtlI ilWfIIr!lI OOWl iIrn • Iline callOOxdIe my
woo
lO1isJoo11 r!lIi' W I()h<ilS ~1!lIw ~ 00 IPoIlamir!ll iliil I i'llJlMi a 11 00
x 1100 IIlI1iiIi!W JIllIriirrn~Wh<ilS~l1IedIlOlff <111111 ~1I.ii<OOI:S.. I!lllIUJlI1l~ ~ iimlfll/1Jlflll)lY!ifdl ItMt a IZilIUJ . Jtre: seft IOlff tPi~~UJlres Wh<ilS :aikerrn aI1Ir!li ~ iilll 1tIhte ~~II IfilIIli) ml ITeOOIftdIs ~lrllJ11lllWl1ltt aI1Ir!li tltnatt 'dJhese w~11:rlI ~ ~ b ~iS1lzmJ iift <ll SIUJ~lOOI1Itt r!lIii:!!@1OOISIIiir;; Sl'tl!W Wh<ilS ~ $;lll1lW·
1m ~~ ciNf ttoo si;g,miiffi~lI1It lJ1I*@iirrn ciNf error i~~ iill1l !time
IIiliS1!\SJUJITte-I!Iil$fIlt 0Jf ttHt/!!) lOOi!!Il!Itn I11.iff ttloo 00f1!i~1 SlUJI~i <lllIl1I1l! ~ SJliIll1BIIi ~inmIIl tliuiid!-<oo.millm!iifliiim'@ ~ [l1({))]I, <ll ~i'llIIUIi!ilII1I1Ii~1Ii~ iIi~!!jJrrar!lIce Sltl!llT-iim@) S~ll ~1tI11J4I*~ siimlli~1aiJIt1tl11J ItMttlOlff!HI ~ eIt<!llll.. [1/ 1/]WiI<iII5>IIJIS$!Il
ItI11J ~ ~ '>.'!!)ii!!ll!ltn 0Jf 1tIhte ~nlTlYl!iilfj ~ <llftIMm' elIIDIn 1mJ!!e I11.iff ttII~ ~\UIlI!li il!i/11l'.dI ~ ttll~ ~11aiJIt Ittsimi~ iliiI!Itdllllell1Tll1lii£.. 1't.<lI~0if~iWIaiJlt~4l¥f1IIlI iir1J~I~i<liiIlctli~ ~~(/)JfIJ~~Jl!!liir1JI\T11Jw1t<lltt1tlhte1~llOlf!ttlooffitoo1tl!Jlltn:!zn11lt$ 4l¥f1IIlI ~ rtmI1Ii~ 0Jf ttI~ IMw> ~~ ~~~ ibJjy' 1E'QlIIS [l1~JjJ) w.@S; ~1:i;JUj1'l1lW iir1J ~ ~. ~.9lJII1I~ IE~ CDJIii!Jjinlllllt,u <dlw-~~~rtml1Ii~ ttitn<l!I!t0if~II\lwi1TIIs:~~Ibi~~lctli~ 0Jf IIIh~ IL, WIce IUfS'e1JJ ~ ~iliJaqjj I1!I1WtdIJiiitt1lltii1:mn.JJ
IRM 0Jf IlwliIiJIll ~iIIW" 4I:sJ ~ ~1/1Ilfire!Il1I ~ ~71 .. f6l eft:
f6l..~~<JtlitdI5JD)IJIllWl1l~~~.({)J:± !!ii..~~, 115i-4!lDJ~
~nil., ~ 3J'i1J~ 1(II,itr/l1> IIn'lllllJ ~ ~JMi:idlIlYII\ ttI\lrreJ I8t4iII tC;lI" Mlll1(Q)
~.lT1~<iffil!lllt$~~IIIIll'iJI1t\\(M'" ~0Jf~IftIIIJd~,
1~1Wt1111ll1ftlllJd~, i:lflt((jjttllJmj~((I\i®. l1ilID)., ~ttI~<iffil!lllt$({[if~
[image:2.612.51.403.72.522.2]AJNR:2, January/February 1981 NORMAL CEREBRAL DENSITY AND CSF SPACES 43
A
B
Fig. 2.- A, Grade 0 atrophy 01 lrontal lobes. Barely discernible inler
-hemispheric fissure (arrow). B, Grade 1. Anterior end of interhemispheric fissure easily seen (arrrow). C, Grade 2. Anterior end and middle third 01
interhemispheric fissure identifiable (arrow). D, Grade 3. Widened in
er-100 70
>-r
~o 0 ~
GRADE L ATROPHY a:
0
!<
60GRADE 2 ATROPHY
~so
•
TOTAL NUMBER WIT'H ATROPHY >-CD~ (GR~rE I + GRADE 2. 0
<
:; 0 ~ 0 50
tI!J W
0
...
...
~60
l,
e
.
'"'"
40"l .... 0
i
snIf
'"
:>..,
"'30 ""40
~
'"
0
[
0<
...
~
20~30
'''''
fr
,
,
<>
~ t-;
r
r
<%20 to.
!
10
I
I
I
rf/'0
I
"
,
I
f;.;
r
~ 1 ..~
0
"
IG 2e z:, 3~ 3:5 ...:,~ -' {))FI< .,!E£F .:.G( C.""QUF"S
A
B
Fig. 3.-Frequency 01 Irontallobe atrophy in normal males
radiata and centrum semiovale (fig. 1 D). were chosen from It1e
printouts of two of the slices. as described by Arimitsu et at. [3l
Calculations ~ere made on 60-100 pixels from the cen
a
of each area marked in figure 1 and a mean attenuation coefficiefllt and standard deviation was obtained for each area. The nomOOlCllal-lure of levels 3A and 4A in figure 1 has been used il1l al~ oI1hlelf' figures and tables for convenience and brevity. Total crail1l dem$iity'las obtained by pooling the deep gray and white matter atl€llllll<'l.OOoI11 coefficients bet '1een 15 and 60 using the E I histogram PI"~
lalion of Hoonsfield units and emimating an average value. Catlcwi-lations from printouts and histograms were then done, ~ ibJy
hand and Jllartly with a PDP 11/40 computer. A curoolf' ",-/<3$ oott
c
D
hemispheric fissure (long arrow) and lateral frontal $Vlci (arrowheads). This>
slice. a feVl miffime ers superior 0 A-C. smw/S appearance of remalm"!J
cortical convexity when affected by gra!le 3 alropfly (short amwl$'.
~j
0
e.?AD£ '- ATROffiYD
GRMlIE 2. tl iWPHY•
TOTAL Mi!li3EIR ,. R.Offi(GRAUE ' .... GRIWE 21
~
/'"1
I
~j
l
IIall')
~
II·
-II
I
J
,
):5 Ik!lI 15 2l!D 25i 3i!lI 36 4@ ~
,,"WIE 'ifIBW'i! lAG(£. ~$
) amI!II felTl1ll<1J\E$ • IIiIIuJlmrdl>ar iim jIrElIr61~ are ,fII!J!1)1it!lI."'T: lIIf~~,
lUIsadi fftlW tIlIre
aJrea
@jf iill111to:lrl!!$i iim a'JIiTW @jf tIlIre e:stti~ki>ml$ ~ iitt itt>teiittIt1'elf a dlf'd~ tlW a $ljjlUl,jllne" w.ih1ildlll ~ «llkrJi _ roiooltJke wiitllh1 lI!tre
~!P'e I!llff tIItne tpIaIfi!ikalJil!arr' ;alJfea..
R
es
uHs
Cerelix.oo>f)liooJ! /FI!(fJ/iid Sg;e~
Itt
\\Was
fflOllUllrlK!ll 1I1htalt ff« IOOtIJhl ITlI1\1lIIles aJfIlIflI ff~Ike$" 1IOOire \\Wiil1$ [image:3.612.57.555.75.252.2] [image:3.612.56.556.322.566.2]44
CALA ET AL AJNR:2, January/February 1981A
B
Fig. 4.-A, Grade 0 atrophy of cerebellar vermis. Faint groove at posterior
end of quadrigeminal cistern. Intact vermis (arrow). B, Grade 1. Anterior and posterior limits of vermis and one sulcus (arrow) more clearly visible. C,
100 >-I
"-0
a: .... 80 <t
>-'"
0 GO w
....
u w
...
...
<t 40
w
'"
<t
....
z 20
w u
a:
w
"-171
0 5 10 15 20 25 30
FIVE YEAR AGE GROUPS
A
35
c
o
Grade 2. Several vermiform sulci (arrow). D, Grade 3 atrophy (arrow). Well defined lateral superior cerebellar cisterns with pool of cerebrospinal fluid
anteriorly and posteriorly leaves vermis isolated as island of tissue.
121
40 45
%
~
B6
BO
70
~ 60
;:
10
B
10
AGE GROUPS
Fig. 5.-Frequency of vermis atrophy, grades 1 and 2, in normal males (A) and females (B). Numbers in parentheses indicate numbers of subjects.
TABLE 2: Summary of Brain Density Results with Evans ratio
[12]
Gray matter
White matter
Area
Gray /white difference
Total brain density
Ventricular span/internal cranial
diameter ratio
Mean Density (H) (SO)
Females (n = 43)
32.95 (3.30)
30.09 (3.51)
2.86 (1.97)
33.93 (2.68)
0.31 (0.08)
Males (n = 48)
33.23 (3.21)
29.75 (3.30)
3.48 (2.04)
33.55 (2.57)
0.33 (0.06)
finding (figs. 2 and 3), but none exceeded grade 2. None of the other lobes in the supratentorial compartment showed any atrophy. Similarly, an increasing frequency of atrophy of the cerebellar vermis was found with advancing age (figs.
0.5
0.,
...
..
0.3
-.---
.
. .
--"-.-r ••
.
-!.. .... ___ .! __ _.
.
.
-
-.---.-
.
---:
.
0 0.2
....
'"
0.1
o.oL---~1~5~.~0----~2~0~.70----~2~5-.0~--~3~0~.0~--~3~5~.0~----,~O.O
FIVE YEAR AGE GROUPS
Fig. G.-Distribution of modified Evans ratio for both genders. Downward
slope not significant. Y intercept = 0.37, 95% confidence interval = 0.
30-0.43; slope = -0.002, 95% confidence interval = -0.004-0.0008; corre
[image:4.613.70.554.72.236.2] [image:4.613.55.562.295.499.2] [image:4.613.319.555.544.691.2] [image:4.613.51.297.563.658.2]AJNR:2, January/February 1981 NORMAL CEREBRAL DENSITY AND CSF SPACES 45
UJ
...
-z
:::> 0
..J
j;: UJ
z
:::> 0 :!:
A
45.0
40.0
35.0
30.0
25.0
.
_ _ _ _ _ ~ _ _ _ _ _ • _ _ JI_~~
.
_ _=-
~--:.
~- --.!-.-~.
-
--~-..
_.-.
.
. .
...
.
20.0 L - - -__ - r ______ ~----~----~---;_----~
15.0 20.0 25.0 30.0 35.0 40.0
FIVE YEAR AGE GROUPS
Fig. 7.- 0 istribution of white (A) and gray (8) matter density with age for both genders. Y intercept = 29.35 (A) and 33.76 (8), 95% confidence
intervat = 26.2-32.5 (A) and 30.8-36.8 (8); stope = 0.021 (A) and -0.025
4 and 5), but again the severity only reached grade 2. By contrast, only nine of the 115 subjects showed any atrophy of the cerebellar hemispheres.
It was found that fewer women showed frontal lobe
atro-phy but those who did exhibit this finding tended to have grade 2 atrophy more often than men (fig. 3). In our carefully
selected population, no men or women had grade 3 or 4
frontal lobe atrophy until age 40 years. Figure 20 shows
grade 3 frontal lobe atrophy.
The modified ratio of Evans [12] was found to be 0.31 ± 0.08 in females and 0.33 ± 0.06 in males (table 2), the differences between genders not being statistically signifi-cant. The ratios for the male and female subjects were combined and plotted against age (fig. 6), the slope of the
line not being significantly different from zero at the 95%
confidence limit. That is, there is no statistically significant change with advancing age up to 40 years. The interrupted line is the result of a linear least squares fit to all data points.
Brain Density
The results are summarized in table 2. Both males and
females showed a mean value of about 33 H for deep gray
matter and 30 H for white matter. Our installation is checked once a week and the mean value for a water phantom is
-3--4 H with a standard deviation of 3-4 H. This indicates that the standard deviation of the installation and the deep gray /white matter difference are of the same order.
There-fore, it is important to perform adequate quality control and
check drift on a regular basis to be able to continue to
discriminate white from deep gray matter.
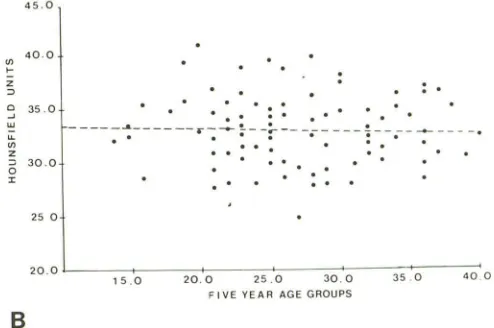
The values for males and females were then combined to assess any change in deep gray or white matter density with advancing age (fig. 7). No statistically significant change of
density with age was demonstrated up to age 40 years. The
spread of deep gray matter (25-41 H) and white matter
(24-41 H) was calculated, and from this the deep gray /
white matter difference for all subjects was found to be 3.2 ± 2.0 H. Weinstein et al. [13] found a gray/white difference
45.0
40.0 UJ
...
z
:::>
~ 35.0
w u.
UJ
Z
o
30.0:!:
25 0
.. ...
.
--
-
---:
-
---
--
1""-:--;.
- -
:--
-
-
.-
-
- -
-
!
-
-
.
--
__
-- --
.
..
20.0L---,5-.rO----~20~.~0----~25~.~0----3~0~.~0--~3~5~.0~--~4~00
fiVE YE A R AGE GROUPS
B
(8), 95% confidence interval = -0.09-0.14 (A) and -0.13-0.09 (8); cor
-relation coefficient = 0.04 (A) and -0.05 (8).
of 6 H to but his age group were not stated; Arimitsu et al.
[3] found a difference of 7 H but their subjects were of an
older average age than in our study. The deep gray/white
matter difference was plotted against age but again no
statistically significant change was demonstrated (fig. 8).
A histogram was then prepared of all the EMI values on
slices 3A and 4A by the EMI CT 1010 computer. From our
initial calculation for white and deep gray matter densities,
obtained manually from the printouts, values below 15 H
and above 60 H were excluded as not representative of
brain but the range chosen still would have included some
pixels representing extracranial soft tissues. The mode,
median, and average brain density values were calculated
manually from the EMI numbers retained on the histogram
that had been produced by the computer. For 3A the modes
were 23-41 H; average, 30.8 ± 3.4 H. The medians were
25-40 H; average, 31 ± 3.0 H. The average total brain
densities were 28-41 H; average, 32 ± 3.0 H. On the 4A
slice the modes were 24-42 H; average, 32.0 ± 4.0 H. The
medians were 27-43 H; average, 34.0 ± 3.0 H. The
aver-age total brain densities were 30-43 H; average, 36.0 ± 3.0 H. The averages for levels 3A and 4A were summated
to obtain total brain density: range, 29-40 H; average, 34.0
± 3.0 H. Again the values for total brain density were plotted
for each of the subjects against age (fig. 9). No statistically
significant change with age until 40 years was found.
Our findings were compared with those of Reese et al.
[2]. They found a slight but not significant downward slope
for total brain density with advancing age between 21 and
90 years (fig. 10). By combining the 93 subjects in our
series with the 100 subjects of Reese et aI., it can be stated
that between ages 15 and 90 years no change in total brain density is discernible by CT, whether using the EMI CT 1010 (as in our series) or the old water-box unit of Reese et al.
Discussion
In the supratentorial compartment, it appears that only
[image:5.612.308.555.75.239.2]46 CALA ET AL AJNR:2, January/February 1981 8.0
. : I •
---.!-
. ..
'.
.- - - - : - - -_ _ _ I
-!_:-:'_._;- ________ .:. ____
_
4.0
<n
!:
... ..
:
z ::>
5 0.0
w 15 0 20.0 25.0 30.0 • 35.0 40.0 "- FIVE YEAR AGE GROU PS
<n
z ::>
0
:I:
-4.0
Fig. 8.-Distribution of deep gray/white matter difference with age for
both genders. Y intercept = 4.41, 95% confidence interval = 2.55-6.28;
slope = - 0.046,95% confidence interval = - 0.11-0.02; correlation coef-ficient = - 0.14.
45.0
<n 40.0
!:
z
::>
a
-' 35.0
w
"-
---<n
z ::>
0 :I: 30.0
.
:
.
:
.
".
.
:'
. '--- -
--
--'-
~-
-=-- --
---.--
--:--
-
-.---
-.-.
" : . : .
.1
• • • I • • •
..
25.0
20.0L---~-r ____ ~~ __ ~~ ____ ~~ ____ ~ ____ ~
15.0 20.0 25.0 30.0 35.0 40.0
FIVE YEAR AGE GROUPS
Fig. 9.-Distribution of average total brain density with age for all subjects.
Y intercept = 32.89, 95% confidence interval = 30.46-35.31; slope =
0.032, 95% confidence interval = -0.06-0.12; correlation coefficient =
0.07.
40 years. Therefore, the finding of sulcal widening in other regions of the cerebral hemispheres may be regarded as
pathologic. Some atrophy of the cerebellar vermis can
oc-cur, but it is very infrequent in the cerebellar hemispheres,
so that the finding of widened hemispheric sulci should
again suggest a pathologic disturbance. While evidence of
shrinkage of brain substance was obvious from the
progres-sing prominence of the subarachnoid spaces, the ratio taken
as Evans ratio at the level of the frontal horns remained unchanged. If the ratio does change with age it must do so
after age 40 years.
Zatz [14] described how the original conclusions favoring the ratio, rather than the bifrontal span alone, were based
on an error in the calculations. However, we are satisfied with the ratio of bifrontal span: internal skull diameter at the
level of the frontal horns and find that it is a constant with
advancing age in normal subjects. In 180 patients and 20
volunteers, ages 10-81 years, Hahn and Rim [15] found
that the bifrontal span was 28% of the internal cranial diameter at 15 years of age and 31 % at 70 years, so there was a very slight change with advancing years. Their final
conclusions were that a maximum bifrontal diameter greater than 40% of the internal cranial diameter and less than 18%
is highly suspicious of abnormal ventricles.
TOTAL BRAIN
DENSITY
(HOUNSFrElO UNITS I
40 38 36 34 32 30 28 26 24 22
---1
I:
I ICALA &101. I
, , i___ _____. ____ .J '
REESE I' 01.
o 5 10 15 20 25 30 35 40 45 50 55 60 65 10 7!i 80 85 90
AGE (YEARS I
Fig. 10.- Comparison of our values for total brain density in the 15-40 year age group with those of Reese et al. [1] in the 21-90 year group. Each parallelogram contains 96% of the individual data points, the upper and lower edge being 2 SO from the mean of the data.
Meese et al. [16], who used the external skull diameter at
the level of the frontal horns: bifrontal ventricular span
(frontal horn index) in 170 individuals, 6 months to 71 years old, found a ratio of skull: ventricles of 4 or an inverse ratio of 0.25 until age 40 years. Thus our population had slightly larger ventricles at 0.3 but this may be accounted for by the use of the internal skull diameter.
Our results for brain density are comparable to those found in previous studies [1-3]. Our deep gray /white matter
difference of 3.2 ± 2.0 H is lower than that reported by Arimitsu et al. [3], but their subjects were of an average older age. Since there is such a small difference between white and deep gray matter density values in normal sub-jects, any unusual change (outside the standard deviation for the machine) may suggest pathology and may be
valu-able in the diagnosis of diseases of white or deep gray matter [3].
REFERENCES
1. Reese DF, Beeler GW, O'Brien PC, Gerding PR, Romme CR. A statistical analysis and comparison of two sets of 100 normal
CT brain scans. Presented at the annual meeting of the Amer
-ican Society of Neuroradiology, Bermuda, March 1977
2. Reese DF, O'Brien PC, Beeler GW, Gerding PR, Clifford CR.
A statistical description of the normal computerized brain scan.
AJR 1977; 129: 457 -462
3. Arimitsu T, di Chiro G, Brooks RA, Smith PB. White-gray matter
differentiation in computed tomography. J Comput Assist
Tom-ogr 1977;1 : 437 -442
4. Brassow F, Baumann K. Volume of brain ventricles in man
determined by computer tomography. Neuroradiology
1978;16: 187-189
5. Gyldensted C, Kosteljanetz M. Measurements of the normal
hemispheric sulci with computer tomography: a preliminary
study on 44 adults. Neuroradiology 1975; 10: 147 -149
6. Gyldensted C, Kosteljanetz M. Measurements of the normal ventricular system with computer tomography of the brain. A
preliminary study on 44 adults. Neuroradiology 1976; 10:
[image:6.612.59.295.71.210.2] [image:6.612.320.550.73.249.2] [image:6.612.57.293.270.417.2]AJNR:2, January /February 1981 NORMAL CEREBRAL DENSITY AND CSF SPACES 47
7. Barron SA, Jacobs L, Kinkel WR. Changes in size of normal
lateral ventricles during aging determined by computerized
tomography. Neurology 1976;26: 1 011-1 013
8. Haug G. Age and sex dependence of the size of normal ventricles on computed tomography. Neuroradiology 1977;14:
201-204
9. Gonzalez CF, Lantieri RL, Nathan RJ. The CT scan appearance
of the brain in the normal elderly population: a correlative
study. Neuroradiology 1978;16: 120-122
10. Cala LA, Mastaglia FL. Computerized axial tomography of the cranium and orbits in multiple sclerosis. J Neurol Sci 1978;36: 411-426
11. Huckman MS, Fox JH, Topel J. The validity of criteria for the
evaluation of cerebral atrophy by computed tomography.
Ra-diology 1975; 116: 85-92
12. Evans WA Jr. An encephalographic ratio for estimating ventr
ic-ular enlargement and cerebral atrophy. Arch Neurol Psychiatr
1942;47: 931-937
13. Weinstein MA, Duchesneau PM, Macintyre WJ. White and gray
matter of the brain differentiated by computed tomography.
Radiology, 1977;122:699-702
14. Zatz LM. The Evans' ratio for ventricular size: a calculation
error. Neuroradiology 1979;18:81-82
15. Hahn FJY, Rim K. Frontal ventricular dimensions on normal
computed tomography. AJR 1976;126: 593-596

![TABLE 2: Summary of Brain Density Results with Evans ratio [12]](https://thumb-us.123doks.com/thumbv2/123dok_us/1185281.641618/4.613.55.562.295.499/table-summary-brain-density-results-evans-ratio.webp)