Val M. Runge1 Ann
C.
Price1 Howard S. Kirshner2Joseph H. Allen 1 C. Leon Partain 1
A.
Everette James, Jr.1This article appears in the November 1984 issue of AJR and November/December 1984 is-sue of AJNR.
Received February 13, 1984; accepted after re-vision June 26, 1984.
Presented at the annual meeting of the American Roentgen Ray Society, Las Vegas, April 1984; Ex-ecutive Council Award winner.
, Department of Radiology and Radiological Sci-ences, Vanderbilt University Medical Center, Nash-ville, TN 37232. Address reprint requests to V. M. Runge.
2 Department of Neurology, Vanderbilt University Medical Center, Nashville, TN 37232.
AJNR 5:691-702, November/December 1984 0195-6108/84/0506-0691
© American Roentgen Ray Society
Magnetic Resonance
Imaging
of
Multiple
Sclerosis:
A Study of
Pulse-Technique Efficacy
691
Forty-two patients with the clinical diagnosis of multiple sclerosis were examined by proton magnetic resonance imaging (MRI) at 0.5 T. An extensive protocol was used to facilitate a comparison of the efficacy of different pulse techniques. Results were also compared in 39 cases with high-resolution x-ray computed tomography (CT). MRI revealed characteristic abnormalities in each case, whereas CT was positive in only 15 of 33 patients. Milder grades 1 and 2 disease were usually undetected by CT, and in all cases, the abnormalities noted on MRI were much more extensive than on CT. Cerebral abnormalities were best shown with the T2-weighted spin-echo sequence (TE/TR =
120/1000); brainstem lesions were best defined on the inversion-recovery sequence (TE/TI/TR
=
30/400/1250). Increasing TE to 120 msec and TR to 2000 msec heightened the contrast between normal and abnormal white matter. However, the signal intensity of cerebrospinal fluid with this pulse technique obscured some abnormalities.The diagnosis of multiple sclerosis continues to be a clinical challenge [1,2). The lack of an objective means of assessment further complicates the evaluation of treatment regimens. Evoked potentials, cerebrospinal fluid (CSF) analysis, and computed tomography (CT) are currently used for diagnosis, but all lack sensitivity and/or specificity. Furthermore, postmortem examinations demonstrate many more lesions than those suggested by clinical means [3). Two previous investigations [4, 5) have established the sensitivity of magnetic resonance imaging (MRI) for detecting cerebral abnormalities in multiple sclerosis. However, both reports were limited by the small numbers of patients and the variety of pulse techniques used.
In our series, seven different MR scan techniques were used to evaluate the relative efficacy of T1- and T2-weighted images. Findings were correlated with the patients' clinical histories, laboratory data, and CT examinations.
Subjects and Methods
Patients
Forty-two patients (16 men and 26 women) with a clinical diagnosis of multiple sclerosis
were studied. In each case, multiple neurologic events separated by both anatomic site and
time had been observed. The age range of patients was 26-66 years, and the duration of
disease varied from 1 month to 30 years. The three patients over age 55 all had greater than a 10-year history of multiple sclerosis. Oligoclonal bands were present in the cerebrospinal
fluid in eight of 21 cases tested.
CT
High-resolution GE CT
IT 8800
scans were performed with and without intravenous contrast enhancement (300 ml of a 30% meglumine iothalamate solution as a continuous drip) in 38of the 42 patients. Of these examinations, 33 were done within 2 weeks of the MR scan. The CT scanner was operated at 120 kVp with contiguous 10-mm sections obtained from the
692
RUNGE ET AL. AJNR:5, Nov/Dec 1984and abnormal contrast enhancement, ventricular enlargement, and cortical atrophy.
MR
A Technicare 0.5-T superconducting magnetic resonance imager with a 28-cm-ID radiofrequency coil was used. Data were acquired using a 256 x 128 pixel matrix, with interpolation along the y axis to yield a 256 x 256 matrix and a pixel size of 2.2 x 2.2 mm. The slice thickness was 1 cm. The protocol for MRI required 2 hr per patient and consisted of three anisotropic volume studies of the brain, each with 32 contiguous transverse sections and four identical level trans-verse sections through the body of the lateral ventricles.
Two spin-echo (SE) volume techniques were used. The 30 msec TE and 250 msec TR is primarily proton density and T1-weighted with a very slight T2 contribution: the 120 msec TE and 1000 msec TR is primarily T2-weighted. The third volume technique was a T1-weighted inversion-recovery (IR) sequence with 30 msec TE, 400 msec TI, and 1250 msec TR. The scan times for these three volume techniques were 10, 37, and 47 min, respectively. Motion artifact was minimized by the use of adhesive tape and Velcro straps to restrain the head.
Each of the single sections was obtained at the same level with four spin-echo techniques, TE/TR (in msec) being 30/500, 60/1000,
120/1000, and 120/2000. Axial sections were obtained to facilitate comparison with CT, but the angles of the MR sections did not duplicate the CT due to limitations imposed by the smaller internal diameter of the MR head coil. Of the 42 patients, 37 had complete examinations. Five other examinations were limited in scope due either to technical problems or the patients' medical conditions. Five patients were studied twice at intervals ranging from 3 to 14 weeks. This complex and lengthy imaging protocol was used for three reasons. First, the acquisition of three volume studies allowed a direct comparison of the three pulse sequences, lesion for lesion, through-out the entire brain. Second, these scans permitted a thorough assessment of the extent of intracranial involvement. Third, the four identical-level spin-echo sections allowed a more complete compari-son of the utility of different pulse techniques.
Disease severity on MRI was graded on a scale of 1-4 by the size, number, and definition of lesions. Grade 1 disease involvement was limited to the peri atrial and supraventricular regions. Supraventricular lesions, when present, were poorly defined. Grade 2 was defined by the identification of disease involvement in an additional anatomic region, usually the periventricular white matter. The supraventricular lesions were larger than those of grade 1, measuring more than 0.25 cm in diameter, and well separated from the ventricular system. The addition of well-defined frontal horn involvement, supraventricular lesions greater than 0.5 cm in diameter, and white matter lesions in the frontal, parietal, occipital, temporal, or capsular regions consti-tuted grade 3 disease. The presence of brainstem lesions with grade 3 supratentorial white matter changes constituted grade 4. Without brainstem changes, white matter involvement distant from the peri-ventricular, supraventricular, and capsular lesions was required for diagnosis of grade 4 disease.
Each volume study was analyzed for lesions by anatomic location.
Areas of artifact, noise, or significant mottle were excluded. The efficacy of a particular MR scan technique was defined as the percentage of lesions detected by one method, at a given anatomic level, when compared with the method demonstrating the maximum number of lesions. Asymmetry of involvement and confluence of lesions were also assessed. The four 2D spin-echo techniques were rated by diagnostic value in each case.
Calculated T1 and spin-density images were also acquired in a limited number of patients. Two images, SE 30/1250 and IR 30/400/
TABLE 1: Comparative Efficacy of CT /MRI in Recognition of Multiple Sclerosis
Disease Severity No. CT
by MAl Cases
Positive-Grade 1 . . . . . . . . . . .
.
. 11 0Grade 2 9 5
Grade 3 . . . . . .
.
. 8 6Grade 4 ... 5 4
Total 33 15
• Criteria for diagnosis by CT included focal areas of low attenuation and abnormal areas of contrast enhancement.
1250, were obtained in sequence, minimizing potential errors arising from instrument fluctuations. T1 values were calculated by fitting the two observed points to a single exponential curve and obtaining the time constant for the curve. Mobile proton density was computed from the upper limit of this curve defined by the observed T1 calcu-lation. A slight T2 dependence is introduced in this calculation by T2 dephasing due to the finite time (30 msec) spent generating the spin echo.
Results
Clearly defined abnormalities of both high and low signal intensity were detected in each case of multiple sclerosis scanned by magnetic resonance. Of the 33 CT examinations, only 15 (45%) showed discrete areas of low attenuation or abnormal areas of enhancement. Less specific findings of ventricular enlargement and cortical atrophy were seen equally well on MRI and CT. Detection of disease by CT increased with severity as judged by MRI (table 1). No MRI grade 1 cases, the least severe disease involvement, had positive findings on CT, as compared with 80% of grade 4 cases.
The distribution of lesions in multiple sclerosis, as assessed by MRI, correlated well with autopsy data in the literature [1], showing a predilection for symmetrical, periventricular involvement (table 2). Lesions contiguous with the frontal and occipital horns, as well as along the bodies and atria of the lateral ventricles, were most common. Supraventricular white matter was also frequently involved (84%) (fig. 1). Brainstem lesions were not uncommon (30% of patients had an area of abnormality in the pons). Cerebellar lesions were seen least frequently, with a total of four lesions detected in three patients. Lesions were typically confluent around the frontal and occipital horns and atria on all the MR techniques used. In the white matter not immediately adjacent to the ventricles,
lesions tended to be more discrete and often circular. Abnor-malities noted in the brainstem were either circular or bar-shaped.
AJNR:5, Nov/Dec 1984 MRI OF MULTIPLE SCLEROSIS 693
TABLE 2: Efficacy of MR Scan Technique and Distribution of Lesions Efficacy (%) Location
SE SE IR
30/250 120/1000 30/400/1250 Abundance'
Periventricular:
Frontal . . . .
.
. 79 100 86 97Body 48 100 72 86
Atrial 59 100 51 100
Occipital . . . . .... 33 100 24 92
Temporal . . . . . . . . . . 0 100 13 32
White matter:
Supraventricular · . . . . .
.
. 66 100 98 84Frontal 32 100 61 46
Parietal . . . . . .
.
. 6 100 33 46Occipital . 0 100 60 11
Temporal 0 100 8 19
External capsule . . . .
.
. · . . . . ..
. 17 100 67 11Internal capsule. 38 88 100 43
Corona radiata . . . . . .
.
. · . . . . . . . 48 86 100 30Brainstem:
Mesencephalon . 31 63 100 22
Pons . . . . .
.
. . . . 13 25 100 30Medulla . . . . . . Cerebellum.
Note.-Data from 37 studies .
• Percentage of patients with lesions in the given anatomic region.
A
B
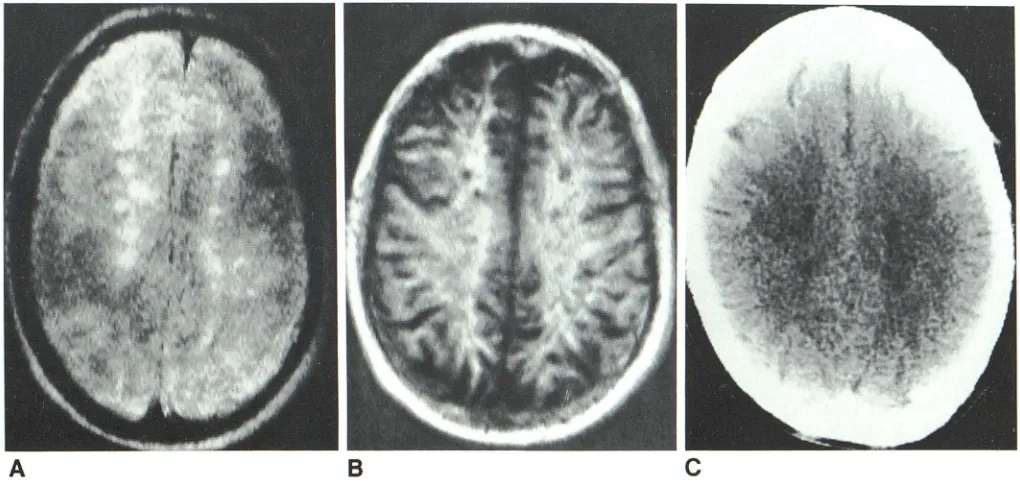
Fig. 1.-Supraventricular white matter lesions of multiple sclerosis seen by
two different anisotropic volume MR techniques. A, SE 120/1000. Lesions are seen as areas of high signal intensity (white). B, IR 30/400/1250. Lesions are
were then noted as areas of high signal intensity (white) compared with the darker normal surrounding white matter. A wide range of T1 and T2 values of abnormal areas was encountered (fig. 3). An intermediate echo time (TE) and
repetition time (TR), for example 60 msec TE and 1000 msec
TR (fig. 3A) may show lesions of both high and low signal
0 0 100 5
25 100 50 8
c
seen as areas of low signal intensity (black). Although severity of disease was
grade 3 by MRI, CT in this patient was normal (C).
intensity. Of the four 20 spin-echo techniques (survey of 32
cases, table 3), the SE 120/1000 technique proved to be
most valuable, consistently showing the largest number and
greatest extent of multiple sclerosis lesions. Of note, however,
is that no one technique was superior in all cases. Increasing
[image:3.612.125.488.95.318.2] [image:3.612.51.561.357.600.2]694 RUNGE ET AL. AJNR:5, Nov/Dec 1984
A
B
c
o
increased the T2 dependence of the image, resulting in better
definition of lesions and identification of smaller lesions, with
higher contrast between abnormal and normal white matter,
as noted on a previous investigation [7]. With this sequence,
however, the higher signal intensity of CSF obscured some
periventricular lesions. With SE 60/1000, some lesions
be-came isointense.
In a comparison of the three different anisotropic volume
techniques (table 2), the T2-weighted study (SE 120/1000)
was generally superior for detection of lesions in the cerebral
hemispheres, with the exception of those in the internal
capsule and corona radiata. These lesions and those in the
cervical cord, medulla, and pons were best seen with the
T1-weighted inversion-recovery technique (IR 30/400/1250). The
E
Fig. 2.-Four transverse 2D spin-echo sections obtained at same level, through body of lateral ventricles, in patient with grade 2 multiple sclerosis. A, SE 30/500. B, SE 60/1000. C, SE 120/1000. D, SE 120/2000. E, CT for comparison.
short spin-echo sequence (SE 30/250) was most time-effi-cient and demonstrated a large number of lesions well. How-ever, the contrast between normal and abnormal white matter
was relatively low, preventing the detection of many lesions.
In the cerebral hemisphere, the inversion-recovery tech-nique was not as efficacious, as some lesions at the normal gray-white matter junction were lost, while others were diffi-cult to distinguish from partial-volume effects of the cortical
sulci. Lesions in the internal capsule (fig. 4) and corona radiata,
two areas unaffected by the previous considerations, were
indeed best seen by the inversion-recovery technique. In
general, lesion margins were more distinct on
inversion-re-covery scans than on T2-weighted sequences (table 4).
AJNR:5, Nov/Dec 1984 MRI OF MULTIPLE SCLEROSIS
695
Fig. 3.-Comparison of appearance and detect-ability of supraventricular lesions with two different spin-echo (20) techniques. A, SE 60/1000. B, SE
120/2000. Range of T1 and T2 values demonstra-ted by lesions is evident, with abnormal areas of high signal intensity in B corresponding to regions of both high and low Signal intensity in A.
A
TABLE 3: Rating of MR Sf Techniques by Diagnostic Value
30/500 . 60/1000 . 120/1000 120/2000 .
TEfTR (msec) RatingO
4.0 2.3
1.4
2.1
o Comparison of 2D transverse sections obtained at level of body of lateral ventricle (32 cases). scale of 1-4 with 1 being most diagnostic.
identified by inversion-recovery technique with proper
win-dowing of the image. However, lesions adjacent to the body
of the lateral ventricles were often difficult to identify due to
the poor contrast with adjacent CSF (both areas manifesting
a low signal intensity on inversion-recovery technique). Thus,
the presence of these lesions often created an appearance of
irregularity in the margins of the lateral ventricles, a
"Iumpy-bumpy" pattern that could be identified readily as abnormal
(recognition of this pattern was not included in the calculations
of table 2).
Cerebellar lesions were noted in only three patients (fig. 5).
Because of the small group size, the results concerning
efficacy of scan technique in this region were not statistically
significant. However, T2-weighted techniques did seem to be
superior in the diagnosis of cerebellar plaques, as these
lesions were difficult to differentiate from CSF spaces with
the inversion-recovery technique. Brainstem lesions, as noted
previously, were best identified with the inversion-recovery
technique (fig. 6). Distinct areas of high signal intensity,
re-sembling leSions, were noted in a few patients on
inversion-recovery scans. In one patient (fig. 7), rings of high signal
intensity were seen surrounding otherwise typical low-signal-intensity plaques.
No definite abnormalities were noted in the optic nerves in
any of the 42 cases. This may reflect poor definition due to
B
either eye motion during the long scan times or the 1-cm section thickness. Sagittal and coronal sections (fig. 8) were
obtained in a small number of patients, illustrating the
ap-pearance of disease in other planes. Figure 9 illustrates the
use of more recently introduced scan techniques in the
ex-amination of a patient with multiple sclerosis.
In the five patients studied twice (with the interval between examinations varying from 3 to 14 weeks), no overall change
in grade of disease involvement was noted (fig. 10).
Differ-ences were observed, however, in the appearance of
individ-ual lesions, with the regression of some abnormalities and
progression of others.
The MR scans were also examined for asymmetry of disease involvement, considering lesions in the first six cate-gories of table 2. Of the 42 examinations, 22 (52%) showed
unilateral predominance of lesions, seven with marked
asym-metry.
Little correlation was noted between disease severity, as
graded on MRI, and duration of disease. Recently diagnosed
« 6 months) cases of multiple sclerosis were equally
distrib-uted among the four grades of disease severity. Three of five
grade 4 cases had a history of the disease for greater than
20 years. There was, however, a statistical difference in age
of the patient population when comparing disease grades 1
and 4 (37 ± 10 years compared with 48 ± 8 years, respec-tively; p
<
0.025). A more extensive comparison and evalua-tion of disease severity on MRI as compared with patientdisability is in progress.
Discussion
The signal intensity observed in MRI of solid tissues
de-pends on three factors.: proton density (4)), T1, and T2. A
large contrast scale exists because of the difference in T1
696 RUNGE ET AL. AJNR:5, Nov/Dec 1984
A
B
c
o
TABLE 4: Ability by Scan Technique to Identify Discrete Lesions
Scan Technique
SE 120/2000: Left ... . Right .
IR 30/400/1250:
Left ...
Right .
Note.- Data from 34 cases, supraventricular region.
Confluent Discrete Lesions Lesions (no. cases)' (no. lesions)t
21 24
8
6
35 25
87 89
• Number of cases in which lesions were confluent over supraventricular area.
t Number of discrete lesions counted.
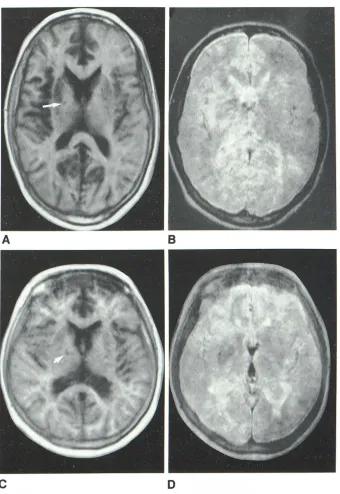
Fig. 4.- lnternal capsule lesions (arrows) in two
patients seen on images from anisotropic 3D vo l-ume data acquisitions. These lesions are better
identified on IR 30/400/1250 (A and C) than on SE 120/1000 (8 and D).
occur in these relaxation times with certain disease
proc-esses. The value of magnetic resonance in the diagnosis of
neurologic disease derives from this high level of contrast,
the lack of bone artifact, specific changes noted with
patho-logic conditions, the flexibility in imaging technique and plane
selection, and the lack of known biologic hazard [6). The
contribution of T1 to image intensity is enhanced on an
inversion-recovery type of pulse technique, although only a
narrow range of T1 differences is emphasized. Here, lesions
[image:6.612.56.396.75.569.2]dif-AJNR:5, Nov/Dec 1984 MRI OF MULTIPLE SCLEROSIS
697
Fig. 5.-Cerebellar lesion (arrow). A, SE 120/
1000. B, IR 30/400/1250.
A
ferences are emphasized in spin-echo images with 60+ msec TE and 1000+ msec TR. This produces an image in which the white matter has a lower signal intensity than gray matter (a reversal of that seen with inversion recovery), and in which the lesions of multiple sclerosis are seen as areas of high signal intensity. Changes relatively specific for multiple scle-rosis on MRI include the abundance of discrete lesions, the anatomic distribution of plaques, the asymmetry of disease
involvement, and the presence of a "lumpy-bumpy" pattern adjacent to the lateral ventricles. Previous investigators have demonstrated the relative insensitivity of CT in the detection of multiple sclerosis, even with high-dose contrast enhance-ment and thin sections [8-10]. The marked superiority of MRI was immediately apparent with its introduction [4, 5], lesions being seen on a scale not previously possible, except at autopsy.
From the 42 cases examined, the efficacy of different scan techniques in detection of abnormalities was established. A T2-weighted spin-echo sequence (SE 120/1000) proved su-perior in the cerebral hemispheres and cerebellum, with two
exceptions: the corona radiata and the internal capsule. Le-sions in these areas, as well as those in the brainstem, were best identified on inversion-recovery technique (IR 30/400/ 1250). This result may be due in part to the low signal-to-noise ratio of the T2-weighted images that were used. In-creasing TR to 1500 or 2000 msec, while maintaining TE at 120 msec, should improve the ability to detect brainstem lesions on T2-weighted images. Further, acquisition of adja-cent (contiguous) sections, from the base of the skull to the vertex, should be mandatory for the MR imaging technique used to avoid missing small lesions between nonadjacent sections.
The ability to increase contrast between normal and
abnor-B
mal white matter by prolonging both TE and TR was dem-onstrated, confirming previous work [7]. Although smaller lesions could then be identified and the areas of abnormality often appeared more discrete, the use of very long TE and
TR resulted in obscuration of periventricular lesions by the
high signal intensity of CSF. The optimum technique in the
cerebral hemispheres (of the four evaluated) proved to be SE
120/1000.
As noted previously, no one sequence was superior in all
cases. This variability relates, in part, to the range of T1 and
T2 values [5] that the abnormalities of multiple sclerosis
exhibit. This range of abnormal relaxation times was con-firmed through visual inspection of images (e.g., figs. 3 and
9), although not computed from the data. These differences
in image characteristics may correlate with the pathologic variations in demyelination, gliosis, axonal loss, and edema
demonstrated in plaques at autopsy [5, 11, 12]. Although
techniques for the acquisition of calculated T1 and T2 images exist [13], the application of these in the diagnosis of multiple
sclerosis is uncertain due to the long scan time and relatively poor resolution. Spin-density images may find use in the evaluation of the water content of multiple sclerosis plaques.
However, more extensive use and experience with calculated
T1 and T2 images may allow improved characterization of disease, particularly the age and severity of lesions. The use
of multiecho techniques allows the acquisition of MR sections differing in T2 weight simultaneously, thereby facilitating
iden-tification of tissue pathology and reducing significantly the overall examination time.
Several cautionary notes must be added to these conclu-sions. The correspondence between lesions at autopsy and
698
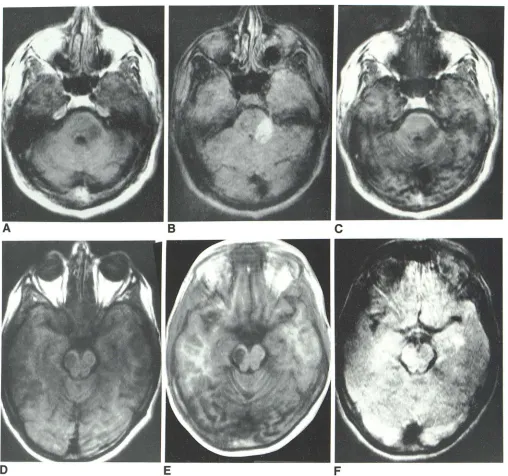
RUNGE ET AL. AJNR:5, Nov/Dec 1984Fig. 6.- Two patients with brain stem lesions. Region of abnormality in left
cerebellar peduncle seen on three 3D volume techniques: A, SE 30/250. S, SE 120/1000. C, IR 30/400/1250. Round. well circumscribed lesion of multiple
sensitivity of the technique. Multiple sclerosis on MRI must
be distinguished from deep white matter infarcts that appear
in the elderly in a similar pattern [14]. However, these occur
in a clinically distinct group of patients [15, 16] and present a significantly more diffuse pattern both on CT and MRI. The spinal cord, a common site of lesions, has yet to be imaged with sufficient detail to enable the diagnosis of lesions due to
multiple sclerosis. Finally, some of the findings presented are
specific to the field strength used (0.5 T). Increasing the field
strength causes a prolongation of T1, inducing smaller
changes in T2 as well. The impact of changes in field strength
sclerosis in mesencephalon. Although lesion is well seen on two T1-weighted
3D anisotropic volume techniques, SE 30/250 (D) and IR 30/400/1250 (E), it is
poorly seen on T2-weighted study, SE 120/1000 (F).
on the efficacy of imaging techniques is yet to be established.
The observation of "white" (high signal intensity) lesions on inversion-recovery images probably results from a shortening of T1 in such areas of pathology and may relate to the stage
of disease evolution. The patient presented in figure 7 was
acutely symptomatic, with two enhancing lesions noted on
CT corresponding to abnormalities on MRI.
The implications for the future are many. Diagnosis of
abnormalities by CT can be improved significantly with the
present experience in distribution and abundance of multiple
[image:8.612.56.564.76.552.2]AJNR:5, Nov/Dec 1984 MRI OF MULTIPLE SCLEROSIS 699
Fig. 7.-Rings of high signal intensity surround
more typical lesions of low signal intensity on two scans from 3D IR 30/400/1250. Although pr evi-ously undescribed, areas of high signal intensity (in
contrast to those of low signal intensity), presumed also to represent pathologic changes, were noted in a minority of patients (5%) on inversion-recovery
scans.
A
B
c
Fig. 8.-Sagittal (A) and coronal (B and C) sections from two patients with multiple sclerosis. A, SE 120/2000. B, SE 120/1000. C, IR 30/450/1500.
examinations showed significantly more lesions than previ-ously recognized. Newly available multiecho techniques (fig. 9) should be relevant because of the wide range of abnormal T1 and T2 values and the present lack of a single superior scan technique. New multislice techniques will significantly reduce scan times while increasing resolution, compared with the current anisotropic volume techniques. The use of thinner,
5-mm sections also should improve the sensitivity of MRI,
avoiding the loss of lesions due to partial-volume averaging.
Paramagnetic intravenous contrast agents [17, 18] may fur
-ther increase the diagnostic ability of MRI. In vivo proton
chemical shift imaging [19] may become important in the evaluation of a disease process such as multiple sclerosis,
which causes significant changes both in lipid and water
content.
MRI seems to be the method of choice at present for the diagnosis and evaluation of multiple sclerosis. Care must be exercised in selection of the appropriate scan technique for the region of interest. Our limited experience with the temporal change in appearance of the disease (five patients) suggests that evolution of the disease process is being observed.
[image:9.612.226.556.87.308.2] [image:9.612.54.559.373.558.2]700
RUNGE ET AL. AJNR:5, Nov/Dec 1984o
E
F
G
too limited to permit a comparison of relaxation rates and age of involved areas. The significance of these findings and the
Fig. 9.-Lesions in a patient with multiple
scle-rosis. A, Observed T1. B, Calculated spin density.
C, MO ratio; scan produced by division of signal
intensity from inversion-recovery image with that
from spin-echo image, both with 30 msec TE. A-C
obtained in 15 min. Compare these to four spin-echo images (of eight total acquired) at same
ana-tomic level using multiecho sequence (total
acqui-sition time of 5 min for all eight images. 0, SE 30/
2000. E, SE 60/2000. F, SE 90/2000. G, SE 120/
2000.
AJNR:5, Nov/Dec 1984 MRI OF MULTIPLE SCLEROSIS 701
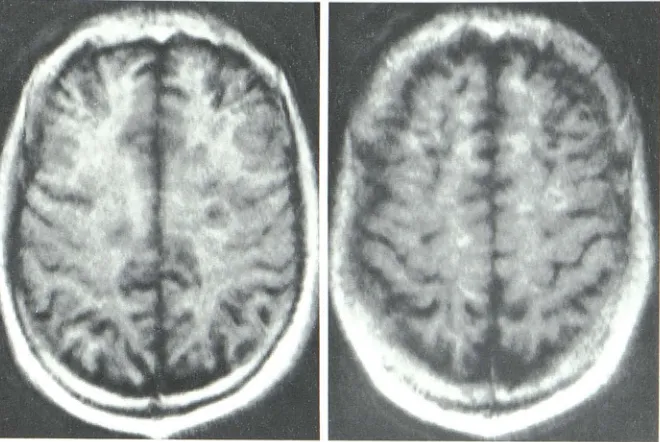
Fig. 1 a.-Changes in peri-and supraventricular lesions of multiple sclerosis over time on 3D volume SE 120/1000 images. C and D obtained 3 months
after A and B.
ACKNOWLEDGMENTS
c
We thank B. J. Zirger, William Whetsell, Jr., Bonnie Norman, Jill Craig, Oscar Wolfe, John Bobbitt, and Mary Henry for assistance.
REFERENCES
1. McFarlin DE, McFarland HF. Multiple sclerosis (part I). N Engl J Med 1983;307: 1183-1188
2. McFarlin DE, McFarland HF. Multiple sclerosis (part II). N Engl J
Med 1982;307:1246-1251
3. Haughton VM, Ho KC, Williams AJ, Eldevik DP. CT detection of demyelinated plaques in multiple sclerosis. AJR 1979;
132:213-215
4. Young IR, Hall AS, Pallis CA, Bydder GM, Legg NJ, Steiner RE.
D
Nuclear magnetic resonance imaging of the brain in multiple sclerosis. Lancet 1981; 2: 1 063-1 066
5. Lukes SA. Crooks LE, Aminoff MJ, et al. Nuclear magnetic resonance imaging in multiple sclerosis. Ann Neural
1983;13:592-601
6. Bydder GM, Steiner RE, Young IR, et al. Clinical NMR imaging of the brain: 140 cases. AJR 1982;139:215-236
7. Crooks LE, Hoenninger J, Arakawa M, et al. High-resolution magnetic resonance imaging: technical concepts and their imple-mentation. Radiology 1984;150: 163-171
8. Hershey LA, Gado MH, Trotter JL. Computerized tomography in the diagnostic evaluation of multiple sclerosis. Ann Neural 1979;5: 32-39
702 RUNGE ET AL. AJNR:5, Nov/Dec 1984
10. Sears ES, McCammon A, Bigelow R, Hayman LA. Maximizing
the harvest of contrast enhancing lesions in multiple sclerosis.
Neurology 1982;32:815-820
11. Brownell B, Hughes JT. The distribution of plaques in the
cere-brum in multiple sclerosis. J Neurol Neurosurg Psychiatry
1962;25: 315-320
12. Lumsden CEo The neuropathology of multiple sclerosis. In:
Vin-ken PJ, Bruyn GW, eds. Handbook of clinical neurology, vol 9.
1970:217-309
13. Mills CM, Crooks LE, Kaufman L, Brant-Zawadzki M. Cerebral
abnormalities: use of calculated T1 and T2 magnetic resonance
imaging for diagnosis. Radiology 1984; 150: 87 -94
14. Bradley WG Jr, Waluch V, Brant-Zawadzki M, Yadley RA, Wycoff
RR. Patchy, periventricular white matter lesions in the elderly: a
common observation during NMR imaging. Noninvasive Med
Imaging 1984;1 :35-41
15. Goto K, Ishii N, Gukasawa H. Diffuse white-matter disease in the
geriatric population. Radiology 1981;141 :687-695
16. Zeumer H, Schon sky B, Sturm KW. Predominant white matter
involvement in subcortical arteriosclerotic encephalopathy
(Bin-swanger disease). CT 1980;4: 14-19
17. Runge VM, Clanton JA, Lukehart GM, Partain CL, James AE Jr.
Paramagnetic agents for contrast-enhanced NMR imaging: a
review. AJR 1983;141 :1209-1215
18. Runge VM, Clanton JA, Herzer WA, Price AC, Weinmann HJ,
James AE Jr. The application of paramagnetic contrast agents
to magnetic resonance imaging. Noninvasive Med Imaging 1984;1 :137-147