i
Water footprint assessment of crop
production in Shaanxi, China
Bachelor Thesis Civil EngineeringUniversity of Twente, Enschede, the Netherlands Date:
August 2014 Author:
Thomas de Boer t.m.de.boer-1@student.utwente.nl s1136763
Supervisors:
S. Sun ssksci@163.com
A.Y. Hoekstra a.y.hoekstra@utwente.nl
L. Zhuo l.zhuo@utwente.nl
Place of research:
Northwest Agricultural and Forestry University, Yangling, China Keywords:
iii
ABSTRACT
The water footprint, introduced by professor A.Y. Hoekstra, is an indicator of freshwater use that looks not only at direct water use of a consumer or producer, but also at the indirect water use. Therefore, it gives a great insight into how and where water is used in the supply chain and helps to form a proper basis for decision making. The water footprint consists of three components. The green water footprint refers to the consumption of green water resources, such as rainwater use. The blue water footprint refers to the consumption of blue water resources, such as surface- and groundwater. The grey water footprint refers to pollution and is defined as the volume of freshwater that is required to assimilate the load of pollutants during the process. The concept can be applied to a wide range of commodities, such as industrial products, agricultural crops and so on. Also, it can be applied at different scales, such as business scale, provincial scale or even globally.
China has the largest population of the world, over 1.3 billion people, and is still growing. Next to this projected population growth, the economy of China is developing quickly. These factors combined will lead to a rising demand for food, that China’s domestic supply will not be able to meet in the future. China’s agriculture has been playing an important role in guaranteeing the food safety of the country. Agricultural production has to increase due to this growing demand for food in the future. This will lead to more water use, and since water is already scarce, to even more water scarcity. In some provinces there is more water scarcity than in others. Water scarcity also differs within provinces. Here a water footprint assessment related to agricultural crop production is carried out for the year of 2008 for a key agricultural province in China; the Shaanxi province.
As a starting point the methodology of water footprints and water footprint definitions are followed as set out in Hoekstra et al. (2011). The assessment focuses on the crops related to agricultural production in the study area and the accounted crops represent 80% of cultivated land use and 77% of production of agricultural crops in the Shaanxi province. The model that has been used is the CROPWAT model and its definitions are based on Allen et al. (2008). The crop water requirement option is used, this means that adequate soil water is maintained by rainfall and/or irrigation so it does not limit plant growth or crop yield.
The water footprint of consumption within Shaanxi in the year of 2008 was 18764 Mm3 yr-1 (40% green; 42% blue; 18% grey). The ten districts of the province showed a great variety concerning the water footprints, which can be ascribed to the difference in production values per district. The two major crops are Wheat (6352 Mm3 yr-1) and Maize (6337 Mm3 yr-1). Together they accounted for 68% of the total water footprint in the province.
Compared to other studies the water footprints per unit mass of crop were slightly higher. Besides, we see a major shift from green to blue water use, due to the fact that the year 2008 was a relatively dry year. Cotton (7285 m3 ton-1) and Soybean (3785 m3 ton-1) have the largest water footprint per unit mass of crop. In comparison, Wheat (1347 m3 ton-1) and Maize (1157 m3 ton-1) have a low water footprint per unit mass of crop but have the most influence on the total water footprint related to crop production.
iv part more humid. Also, the districts with the higher water footprints related to crop production are located in the North and in the middle of the province. This will lead to exhaustion of the water resources of these districts, such as surface and groundwater. Severe water pollution is only
v
PREFACE
This thesis is written in partial fulfilment of the requirements of completion of the Bachelor Civil Engineering at the University of Twente, The Netherlands.
I started my study on the water footprint concept at end of February 2014 at the Northwest A&F University, China. The start of this study was quite interesting, since it turned out that the original assignment was not feasible in the scheduled 10 weeks. An alternative assignment was offered, still with the focus on water footprints. After this exceptional start, it was searching what was possible and what was not. After gaining more insights in the concept, datasets and its possibilities, the pieces of the puzzle started to fall into place.
I would like to thank several people for helping me along the way with this project. Without their help this study would not have been possible.
I would like to thank my supervisors Arjen Hoekstra and La Zhuo for their advice, guidance and thoughts on this study. Their view has helped me to overcome obstacles, especially at times when difficult decisions had to be made.
I would like to thank my supervisor from the Northwest A&F University, dr. S. Sun for giving me new insights, advice on the study and water footprint analysis and for setting up the new assignment. Also I would like to thank the head of the Water Savings Institute, prof. P. Wu for giving me the
opportunity to do my thesis at this institute.
I am thankful to Jack and ShiLijie for being excellent guides, teaching me more about China and its culture and guiding me in the daily life of China. Also, I would like to thank ShiLijie again for collecting datasets, being supportive and having a critical look on my ideas.
Finally, I am grateful to Zou Yufeng for taking care of arrangements, such as housing, visa
requirements and other practical matters. And also to Guoping Zhang, Martijn Booij and Ellen van Oosterzee for setting up the connection with the Northwest A&F University.
vii
TABLE OF CONTENTS
Abstract ... iii
Preface ... v
List of figures ... ix
List of tables ... ix
1 Introduction ... 1
1.1 Background of the study ... 1
1.2 Scope ... 2
1.2.1 Water footprint assessment ... 2
1.2.2 Study area ... 2
1.2.3 Research objectives ... 3
1.2.4 Research questions ... 3
1.2.5 Crop coverage ... 4
1.2.6 Study period ... 5
1.2.7 Study tools ... 5
1.3 Outline of the report ... 5
2 Methodology ... 6
2.1 CROPWAT model ... 6
2.2 Crop water requirement ... 7
2.3 Green crop water use ... 8
2.4 Blue crop water use ... 8
2.5 Grey assimilation water use ... 8
2.6 Water footprint per unit mass of crop ... 9
2.7 Water footprint of crop production ... 10
2.8 Assessment of blue water scarcity ... 10
2.9 Assessment of grey water pollution ... 10
3 Data collection ... 12
3.1 Climatic data ... 12
3.2 Crop data ... 12
3.3 Soil data ... 13
3.4 Yield, agricultural production data ... 14
3.5 Data for grey water footprint calculation ... 14
3.6 Water availability data ... 14
viii
4.1 Water footprint related to crop production... 15
4.1.1 Water footprint per district ... 15
4.1.2 Water footprint by crop ... 18
4.1.3 Water footprint of the crops per district ... 19
4.2 Water footprint per unit mass of crop ... 20
4.2.1 Water footprint of the largest crops ... 21
4.2.2 Comparison with other studies ... 22
4.3 Water footprint sustainability ... 24
4.3.1 Blue water scarcity ... 24
4.3.2 Water pollution level ... 25
5 Discussion ... 28
6 Conclusion ... 30
References ... 32
ix
LIST OF FIGURES
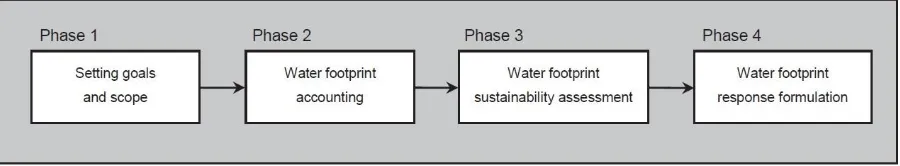
Figure 1.1: Four distinct phases in water footprint assessment (Hoekstra et al., (2011)) ... 2
Figure 1.2: Location of the Shaanxi province in China (left) ; Location of the districts in Shaanxi province (right) ... 3
Figure 2.1: Development of Kc during the crop growing season (Chapagain & Hoekstra, 2004) ... 7
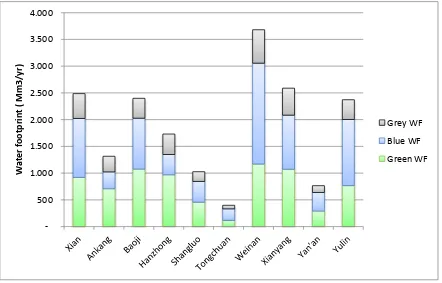
Figure 4.1: The green, blue and grey water footprint per district in Shaanxi province in 2008 ... 16
Figure 4.2: The total, green, blue and grey water footprint (WF) in Shaanxi province spatially mapped per district in 2008 ... 17
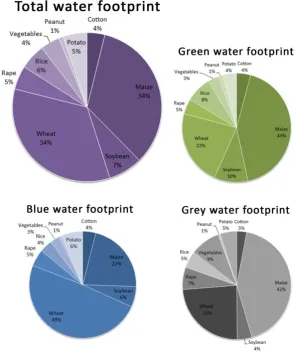
Figure 4.3: The contribution of different crops to the total, green, blue and grey water footprint of crop production in Shaanxi province in 2008 ... 18
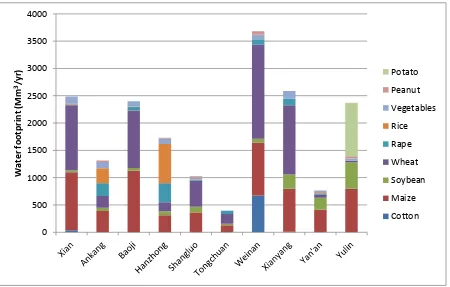
Figure 4.4: The water footprint per district in Shaanxi province with a distinction made between the crops in 2008 ... 19
Figure 4.5: The water footprint per unit mass crop distributed spatially for wheat (left) and maize (right) in Shaanxi province in 2008 ... 22
Figure 4.6: Blue water scarcity per district in Shaanxi province in 2008... 25
Figure 4.7: Grey water pollution per district in Shaanxi province in 2008 ... 26
LIST OF TABLES
Table 1.1: Land use and production values per crop in the period of 2008 ... 4Table 3.1: The characteristics of the meteorological stations used ... 12
Table 4.1: Water footprint per district in Shaanxi province in 2008 ... 15
1
1
INTRODUCTION
1.1
Background of the study
With a population of over 1.3 billion people, China has the world’s largest population. Over the last 60 years the population has more than doubled and will grow to 1.5 billion by the year of 2025 (United Nations, 2013). Besides this prospected population growth in the next few years, the
economy of China is growing too. The annual growth of the GDP (Gross Domestic Product) of 2013 is 7.8% and will keep on growing seen the economic statistics of the last years (The World Bank, 2014). These factors combined will lead to a rising demand for food, that China’s domestic supply will not be able to meet in the future (Zhuo et al., 2012).
What will be the impact of this rising demand for food? First, if the domestic supply of China cannot meet the demand, China has to import food from other countries. This will have an economical effect on higher food prices around the globe (Zhuo et al., 2012). Next to importing food, the agricultural production has to increase even more due to this demand for food. This will have a significant impact on water resources in China. it can be problematic if water use is not managed correctly and
becomes scarce (Liu & Savenije, 2008). Currently, more than 60% of freshwater withdrawals are used for agricultural productions. The irrigation water claims nearly 90% of the total agricultural water use. The agricultural irrigation districts have been playing an irreplaceable role in guaranteeing the food safety of China (Sun et al., 2012). Also, the rising demand for food can have an impact on water sustainability, due to an increase of fertilizer, irrigation water and agrochemicals to maintain high production (Meng, et al., 2012).
Apart from the increase of food demand, water scarcity is already occuring in China for a few decades. Particulary North China faces severe water scarcity (Ma et al., 2006). Resulting in over-exploitation of ground water. This overover-exploitation of groundwater leads to a drastic decline of groundwater levels, exhaustion of water sources and also causes sinking of ground surfaces (Ministry of Construction, 2006).
The assessment of water resource utilization during agricultural production processes is necessary to give an insight in the water use of the agricultural processes. Gathering knowledge and information about these processes, policies can be formulated to prevent, cure or decrease the described
problems above. A method to quantify the water balance of crops or products is the water footprint. The water footprint has been introduced by Professor A.Y. Hoekstra in the year 2002. The water footprint is an indicator of freshwater use that looks not only at direct water use of a consumer or producer, but also at the indirect water use. The definition of a water footprint is, as Hoekstra et al. (2011) state: ‘The water footprint of a product is the volume of freshwater used to produce the product, measured over the full supply chain. It is a multidimensional indicator, showing water consumption volumes by source and polluted volumes by type of pollution’ (Hoekstra et al., (2011)). This concept will unravel the hidden link between consumption and water use.
2 and is defined as the volume of freshwater that is required to assimilate the load of pollutants during the crop production process.
A full water footprint assessment consists of four distinct phases (Figure 1.1). Phase one consists of setting the goals and determining the scope of the study. Defining phase one clearly will give a transparent view on how the study is executed. In the next phase the required data is collected and the accounts for the water footprint are determined. The third phase is the sustainability
assessment, in which the results from phase two will be evaluated from an environmental
perspective, as well as from a social and economic perspective. The last phase consists of formulation response options, policies and strategies. A study on water footprint does not have to include all four phases. Depending on the scope and goals one can choose to stop after the accounting or
sustainability assessment part (Hoekstra et al., 2011).
1.2
Scope
1.2.1 Water footprint assessment
This study focuses on the first three phases which are discussed in section 1.1. The ultimate target of this study is to quantify, map and describe the effects of the water footprints of a crop. In phase one ‘setting goals and scope’, described here, the scope, research objectives and research questions are discussed. Phase two focuses on quantifying the green, blue and grey water footprint of the crop. Phase three includes the primary environmental impacts of the blue and grey water footprints on respectively blue water scarcity and water pollution. The final phase of formulating a response option is not included in this study. After quantifying the water footprints of the study area, the results are spatially mapped.
1.2.2 Study area
The study area for this assessment is the Shaanxi province (35° 36′ 0″ N, 108° 24′ 0″ E), located in China. The location of the Shaanxi province is shown in Figure 1.1. The province borders 7 different provinces and one of the five autonomous region (Inner Mongolia) in China. It has an area of 205,800 km2, which covers 2.1% of the total area of China, which is 9,630,960 km2. It has a population of 37.3 million people, 2.8% of the total Chinese population, and its largest city, Xi’an, has a population of 6.5 million. Shaanxi stretches across basins of the Yellow River and the Yangtze River bounded by the Qinling Mountains. On the northern side of the province the Yellow River is located and on the southern side the Yangtze River. The drainage area of the Yangtze River system and the Yellow River system takes up 35% and 65% of the provincial area, respectively (Shaanxi Province, 2012).
[image:13.595.71.521.121.204.2]Furthermore, the Shaanxi province can be divided into 10 districts (Figure 1.2). Each district has its own district capital city. With over 8.5 million people, the Xi’an district is the largest one concerning population. Due to the large span in latitude, the climate in Shaanxi differs a lot from North to South.
3 The northern part of Shaanxi is cold in the winters and hot in the summers, with dry winters, springs and autumns and can be classified as a cold arid climate. The southern part has a more humid subtropical climate (Shaanxi Province, 2012).
1.2.3 Research objectives
The first objective of this study is to quantify and map the field-scale water footprints of crop production in the Shaanxi province using the CROPWAT model. This objective corresponds to what is called ‘water footprint accounting’ in the Water Footprint Assessment Manual (Hoekstra et al., 2011).
The second objective is using the estimated water footprints of the first objective to determine the effects of these water footprints, in other words, determining the environmental effects of the blue water footprint on blue water scarcity and the environmental effect of the grey water footprint on water pollution level in the Shaanxi province. This objective corresponds to what is called ‘water footprint sustainability assessment’ in the Water Footprint Assessment Manual (Hoekstra et al., 2011).
The effects of the green water footprint on green water scarcity are not taken into account, because according to Hoekstra el al. (2011) the analysis of green water scarcity is largely unexplored. Further research on green water scarcity should be done before implementing this objective in this study. Therefore this study will not include green water scarcity.
1.2.4 Research questions
[image:14.595.81.550.132.378.2]Three research questions have been formulated based on the research objectives. These research questions are as follows:
4
1. What are the quantities of the blue water footprint, the green water footprint and the grey water footprint related to crop production of the Shaanxi province?
2. What is the environmental effect of the blue water footprint of the crops on the blue water scarcity in the Shaanxi province?
3. What is the environmental effect of the grey water footprint of the crops on the water pollution level in the Shaanxi province?
1.2.5 Crop coverage
The assessment focuses on the crops related to agricultural production in the study area. Not all the crops related to agricultural production are taken into account due to lack of data. A selection has been made to represent crop production for the Shaanxi province.
[image:15.595.69.532.414.730.2]The crop coverage is based on the size of cultivated area per crop and production values per crop. This means that the selection includes mainly the primary agricultural crops with a significant amount to the total cultivated area and production. The selection is based on the crop categories given in the Shaanxi Statistical Yearbook of 2009 (Shaanxi Provincal Bureau of Statistics & NBS Survey Office in Shaanxi Province , 2009). As shown in Table 1.1, there are 6 crop categories considered. The ‘grain’ category, with an amount of 81%, contributes the largest amount to the agricultural land use and also has the largest contribution to the production, with a value of 50%. Categories are distinguished by their own specific crops. We see that certain categories have crops named ‘other crops’; these types of crops are not defined by the Yearbook.
Table 1.1: Land use and production values per crop in the period of 2008
Crop category Crop Area use Production
103 Ha Percentage 104 tonne Percentage Grain
Wheat 1140 28% 391.5 17%
Maize 1113 28% 504.3 22%
Soybean 184 5% 24.6 1%
Rice 119 3% 3.6 0%
Other 678 17% 226.9 10%
Oils
Rape seed 178 4% 33.3 1%
Peanut 33 1% 8.2 0%
Other 66 2% 7.9 0%
Vegetables
Vegetables small*
204 5% 586.9 26%
Potato 135 3% 202.5 9%
Other 46 1% 277.6 12%
Fibres
Cotton 85 2% 10.1 0%
Other
Other 34 1% 7.5 0%
Total 4016 100% 2284.9 100%
Selection 80% 77%
5 The selected crops that are assessed in this study are marked. This selection represents 80% of cultivated land use and 77% of production of agricultural crops in the Shaanxi province. Due to lack of characteristic data on certain crops and unclear definitions of other types of crops, such as ‘other grains’, these crops have not been included. Appendix II gives an overview of crop distribution per district.
It should be noted that the crop ‘vegetables small’ contains different types of small vegetables crops. However the data of small vegetable crops individually are not available. Therefore these crops are combined together to one category called ‘small vegetables’ that represents these crops.
1.2.6 Study period
The time period of this study is one single year, 2008. This single year was chosen because it was the most recent year that the required data could be obtained. Since this study is the first water
footprint assessment (concerning the scope) of the Shaanxi province, there are no results of the years before to compare the results to. Concerning the climate we can say that 2008 was a relatively dry year compared to the years before. The annual rainfall of 2008 in Shaanxi was 592.2 millimetres. Compared to the an average annual rainfall of 656.5 millimetres, this shows a decrease of 9.8%. (Department of Water Resources, 2008)
1.2.7 Study tools
The model that is used to do the assessment is the CROPWAT 8.0 model. Its use is to generate the necessary data for the water footprint assessment. More details about the model can be found in section 2.1. The software that is used to map the accounted water footprints spatially is ArcGIS 10.0.
1.3
Outline of the report
In order to meet the research objectives and answer the research questions, this report is written in a structured way. Chapter 2 will discuss the methodology of the water footprint assessment used in this study. Chapter 3 gives an overview of the datasets used to do this assessment. Here,
6
2
METHODOLOGY
As a starting point the methodology of water footprint assessment is followed as set out in Hoekstra et al. (2011). The green, blue and grey water footprints accounting of a crop are explained. Also the sustainability assessment on blue water scarcity and grey water pollution are explained. The methodology of the CROPWAT model and the models definitions are based on Allen et al. (2008). The symbols discussed in this chapter are presented in Appendix I.
2.1
CROPWAT model
The model used to do the water footprint assessments is the CROPWAT 8.0 model. The CROPWAT model is developed by the Land and Water Development Division of FAO. It is a model for the calculation of crop water requirements and irrigation requirements based on soil, climate and crop data (FAO, 2013). The model approach is based on FAO publications by Allen et al. (1998).
When local data is not available, standard crop and soil data is implemented in the CROPWAT model. When local data is available, this data can be easily modified to implement it in the model. Side by side with the CROPWAT model is CLIMWAT. CLIMWAT includes a climate database obtained from over 5000 stations worldwide for the period of 1971 to 2000, which can be referred to when local climate data is not available (FAO, 2013).
The CROPWAT model offers two options to calculate the crop evapotranspiration (ET). The first option is the ‘crop water requirement option’ (CWR option). This option calculates the ET under ‘ideal growth conditions’, which means that adequate soil water is maintained by rainfall and/or irrigation so it does not limit plant growth or crop yield. The second option is the ‘irrigation schedule option’. The irrigation schedule option does not work with the concept of effective precipitation as the CWR option. It includes a soil water balance to keep track of the soil moisture over time.
Therefore, the model needs input data on soil. This option is recommended by Hoekstra et al. (2011) to apply whenever possible., because it is more precise. The applicability of this option depends on whether required data is available (Hoekstra et al., 2011).
In this study the CWR option was used, because local detailed soil data of the study area was not available.
The CWR option uses four modules for input data: the Climate/ET0 module, the Rainfall module, the
Crop module and the Soil module. The Climate/ET0 module in CROPWAT was used to determine the
reference evapotranspiration (ET0). This program determines the average ET0 per month and the
calculation is based on the FAO Penman-Monteith Method (Allen et al., (1998)). The module is primary for data input, requiring information on the meteorological station together with climatic data. The Rain module in CROPWAT was used to implement precipitation data (PR) and to calculate the effective rainfall (Peff). In the program, the Peff is calculated using the USDA S.C. Method (Allen et
al., (1998)). The Crop module in CROPWAT has two different options: non-Rice and Rice. The input parameters in the Crop module of the Rice option contains planting date, crop coefficient (Kc), length
of the stages, rooting depth, puddling depth and crop height (optional). The input parameters of the Crop module in the non-Rice option contains planting date, crop coefficient (Kc), stages, rooting
7 maximum infiltration rate, maximum rooting depth, initial soil moisture depletion, drainable
porosity, critical depletion for puddle cracking, and water availability at planting maximum water depth.
2.2
Crop water requirement
A crop needs a certain amount of water to grow. The volume of water necessary for a crop to grow is called the crop water requirement (CWR, mm). Each type of crop has its certain level of CWR varied spatially and temporally. Two factors influence the value of the CWR of a certain crop, the crop coefficient (Kc) and the reference crop evapotranspiration (ET0, mm). These factors are influenced by
climate variations, such as temperature, sunshine, wind speed, and humidity.
The CWR is calculated by ET0 multiplied by the Kc. The CWR is equal to the actual crop
evapotranspiration (ETc, mm), assuming there are no water limitations to crop growth, so that the
crop water requirements are fully met.
(1)
(2)
ET0 is defined as the evapotranspiration rate from a reference surface, without shortage of water.
The reference crop is a hypothetical grass reference crop with specific characteristics. This means that only climatic parameters will influence reference crop evapotranspiration and it does not consider a difference in crop characteristics and soil factors.
Kc is a value that distinguishes field crops from the reference crop of grass used for ET0. Variations of
the Kc occur because of difference in crop characteristics over the length of a growing period. The
variations of Kc are mainly determined by crop variety, climate, and crop growth stages.
The growing period of a crop is split up into four growth stages: the initial stage, the development stage, the mid-season stage and the late season stage (Allen et al., (1998)). Three values of the Kc
are implemented: one at the initial stage (Kc,ini), one at the mid-season stage (Kc,mid), and one at the
[image:18.595.76.487.581.748.2]end of the late season stage (Kc,end). Figure 2.1 shows a the Kc curve over the growth stages of a crop.
8
2.3
Green crop water use
The green component of crop water use (CWUgreen, m3 ha-1) is the volume of green water that is used
by the crop for evapotranspiration. Green water is defined as water from rainfall. The CWUgreen is
calculated by accumulating the daily green evapotranspiration (ETgreen, mm day-1) over the complete
growth period. The factor 10 is included to convert the water depths in mm into water volumes per land surface in m3 ha-1. The summation is carried out in the time step of 10 days over the length of the complete growth period of a crop.
∑ (3)
The ETgreen is either the ETc or the effective precipitation (Peff). If the Peff is larger than the crop water
requirement, the ETgreen will be equal to the value of the ETc , because a crop uses as much water as
possible, but never uses more than required for optimal growth. If the Peff is smaller than the ETc, the
ETgreen will be the total Peff.
( ) (4)
The calculation of the effective rainfall (Peff) is carried out by CROPWAT using the actual rainfall (Pact).
The calculation is based on a simplified version of the USDA method (FAO, 2013). Equations (5) and (6) show the formulas on how to calculate the effective precipitation. The choice of what equation to use, is dependent on the actual rainfall values.
(5)
(6)
2.4
Blue crop water use
The blue component of crop water use (CWUblue, m3 ha-1) is the volume of irrigation water required
for crop growth and is calculated in a similar way as the green crop water use. Blue water use includes surface and ground water.
∑ (7)
The ETblue, also known as the irrigation requirement (IR), is calculated by taking the difference
between the ETc and the Peff. If the Peff is larger than the ETc, the ETblue is zero, therefore no irrigation
is required. If the crop water requirement is not fully met by Peff then the ETblue is the difference
between these two values.
( ) (8)
By using the approach described in this section, it should be noted that only the consumptive irrigation water use by the crop on the field is taken into account. This means that the losses of irrigation water along the way to the field and on the field are excluded.
2.5
Grey assimilation water use
9 assimilation water use (AWUgrey, m3 ha-1) only considers the ‘waste flow’ of chemicals to freshwater
bodies, which is a fraction of the total application of fertilizers or pesticides to the field. In other words, the amount that is not consumed by the crop is generally considered as a surplus of fertilizer and will affect the freshwater bodies such as ground water and surface water.
AWUgrey is calculated by dividing the pollutant load (Lleached, ton ha-1) by the difference between the
ambient water quality standard for that pollutant (the maximum acceptable concentration cmax, mg L
-1
) and its natural concentration in the receiving water body (cnat, mg L-1). The factor 10-6 is included to
convert the units in mg L-1 into ton m-3.
( ) (9)
The amount of chemicals applied to the field can be measured, but the fraction of applied chemicals that is not used and reaches the ground- and surface water is hard to measure. Therefore, it is common practice to estimate the fraction of applied chemicals that enter the water system. In equation (10) the leaching fraction is called α (-). The total load applied to the field is defined as
Lapplication(ton ha-1) and the leached load is defined as Lleached (ton ha-1).
(10)
2.6
Water footprint per unit mass of crop
The total water footprint of a process of growing a crop (WFproc) is the sum of the green (WFproc,green,
m3 ton-1), blue (WFproc,blue, m3 ton-1)and grey(WFproc,grey, m3 ton-1) water footprint components. It gives
the amount of water consumed to produce a certain amount of a crop, usually in m3 ton-1 for unit mass of crop.
(11) The WFproc,green is calculated by dividing the green crop water use (CWUgreen, m3 ha-1) by the crop yield
(Y, ton ha-1). In parallel, The WFproc,blue is calculated as the blue crop water use (CWUblue, m3 ha-1)
divided by the Y. The WFproc,grey is calculated by the grey water use (AWUgrey, m3 ha-1) divided by the Y.
(12)
(13)
10
2.7
Water footprint of crop production
The water footprint of crop production refers to the volume of water consumed to grow the amount of crop production for a certain period. The total water footprint of a crop (WF, m3 yr-1) related to production is the sum of the green (WFgreen, m3 yr-1), blue (WFblue, m3 yr-1) and grey (WFgrey, m3 yr-1)
water footprint components.
(15)
The calculations of the three components are done by multiplying the water footprint per unit mass of crop (WFproc,x, m3 ton-1) times the annual production (P, ton yr-1). By doing this the water footprint
of each component will be expressed in volume of water footprint per time period (m3 yr-1).
(16)
(17)
(18)
2.8
Assessment of blue water scarcity
To calculate the environmental sustainability of the blue water footprint, the blue water availability (WAblue, m3 yr-1) is necessary. In a basin or catchment the blue water availability is defined as the
natural run-off in the catchment (Rnat) minus the ‘environmental flow requirement’ (EFR). Because
this study does not include a basin or catchment, values on water availability will be used to calculate the blue water scarcity. These values will be explained in section 3.6.
The blue water scarcity (WSblue) is defined as the ratio of the total blue water footprints (∑WFblue) to
the blue water availability.
∑ (19)
Blue water scarcity values have been classified into four levels of water scarcity (Hoekstra et al., 2012):
Low blue water scarcity (<100%): the blue water footprint is lower than 20% of natural runoff and does not exceed blue water availability; river runoff is unmodified or slightly modified; presumed environmental flow requirements are not violated.
Moderate blue water scarcity 100-150%): the blue water footprint is between 20 and 30% of natural runoff; runoff is moderately modified; environmental flow requirements are not met.
Significant blue water scarcity (150-200%): the blue water footprint is between 30 and 40% of natural runoff; runoff is significantly modified; environmental flow requirements are not met.
Severe water scarcity (>200%): the blue water footprint exceeds 40% of natural runoff; runoff is seriously modified; environmental flow requirements are not met.
2.9
Assessment of grey water pollution
11 which measures the degree of pollution. The water pollution level is defined as a fraction of the waste assimilation capacity consumed and calculated by taking the ratio of the total of grey water footprints (∑WFgrey) to the actual run-off (Ract) in a basin or catchment. The same principle is used as
the blue water availability, which is using values to represent the actual run-off. These values will be explained in section 3.6. A water pollution level of 100 per cent means that the waste assimilation capacity has been fully consumed. A water pollution level bigger than 100 per cent means the quality standards are violated (Hoekstra et al., 2011).
12
3
DATA COLLECTION
As a starting point, the data had to be local wherever possible. This means local datasets were prioritized on standardized data. Where local data lacks, such as input data for CROPWAT, calculation data for the water footprint estimations, standardized datasets from databases were used. In this chapter the local data and sources where this data were obtained are described. It will be noted clearly if standardized data was used.
3.1
Climatic data
The input climate data is for estimating the ET0 and Peff in CROPWAT using the Climate/ET0 module.
Required station profile data includes country, station name, latitude, longitude, and altitude. Required climatic data for monthly ET0 calculation includes monthly average minimal temperature
(⁰C), maximum temperature (⁰C), humidity (%), wind speed (km day-1), and sunshine length (hours). These climatic parameters were monthly values of the year 2008 and were entered per
meteorological station.
The precipitation data (PR) was implemented to calculate the effective rainfall (Peff) in CROPWAT
using the Rain module. In the program, the Peff is calculated using the USDA S.C. Method (Allen et al.,
(1998)). Like the climatic data, the rainfall parameters were monthly values of the year 2008 and were entered per meteorological station.
[image:23.595.72.466.506.675.2]Table 3.1 shows the characteristics of the ten meteorological stations. The required climatic data at each meteorological station were obtained from China Meteorological Data Sharing Service System (CMDSSS, 2014). Each station individually represents the climate condition for one district of the Shaanxi province. Due to the data limitation for high intensity of stations per district, as well as the little variation of climate condition in each district, we chose one station for each district to represent its climate.
Table 3.1: The characteristics of the meteorological stations used
# District Station name Latitude Longitude Altitude (m)
1 Xi'an Weiyang 34⁰ 31' 108⁰ 93' 397.5
2 Ankang Hanbin 32⁰ 72' 109⁰ 03' 290.8
3 Baoji Weibin 34⁰ 35' 107⁰ 13' 612.4
4 Hanzhong Hantai 33⁰ 07' 107⁰ 03' 509.5
5 Shangluo Shangzhou 33⁰ 87' 109⁰ 97' 742.2
6 Tongchuan Yaozhou 35⁰ 08' 109⁰ 07' 978.9
7 Weinan Linwei 35⁰ 82' 109⁰ 50' 1159.8
8 Xianyang Qindu 34⁰ 25' 108⁰ 22' 447.8
9 Yan’an Baota 36⁰ 60' 109⁰ 50' 958.5
10 Yulin Yuyang 38⁰ 27' 109⁰ 78' 1157.0
3.2
Crop data
13 The data on the crop calender (planting and havest dates) and Kc values for all crops per district were
available. When implementing the planting date, the standardized harvest date is automatically adjusted, based on standardized crop growing length. However, there could be a difference between the local harvest date and the standardized harvest date due to growth duration differences per district or per crop. By changing the length of the stages of a crop (initial, development, mid-season, late season), this difference was settled. This was done by distributing the difference in terms of percentage to the four stages of the crop. Here, the longest stage will get more (or less if the local harvest date is earlier than the standardized harvest date) days in comparison to the shortest stage. Usually these differences were relatively small compared to the whole growing period, therefore these adjustments did not have a significant effect on the other crop parameters. The local planting and harvest dates were obtained from China Meteorological Data Sharing Service System (CMDSSS, 2014) and Department of the Ministry of Agriculture Industry (DMAI, 2014).
Next to the local planting and harvest dates, also local crop coefficients (Kc) were used per stage
(initial, mid-season, late season). The crop coefficients were obtained from the book Main crop irrigation water quota of northern China (Duan et al., 2004). Standardized CROPWAT values were used for the other crop parameters, such as rooting depths, critical depletion factors, yield response factor, and crop height.
For the category ‘vegetables small’ the standarized CROPWAT values were used. Since there was no fixed planting date available for this category and these crops are planted throughout the year, an average value of the ET was calculated. This was done by calculating the ET for 6 different planting dates throughout the year ( 01-01, 01-03, … , 01-09 , 01-11 [dd-mm]) and using the average ET for the water footprint calculation.
Appendix III gives an overview per district of which crops were cultivated and the corresponding local parameters.
3.3
Soil data
The Soil module has two different options, equivalent to the Crop module: non-Rice and Rice. The parameters of the Soil module for a non-Rice crop include total available water (TAW), maximum infiltration rate, maximum rooting depth, and initial soil moisture depletion. The parameters of the Soil module for a Rice crop include total available water (TAW), maximum infiltration rate, maximum rooting depth, initial soil moisture depletion, drainable porosity, critical depletion for puddle
14 The CROPWAT soil database offers 7 different soil types: light soil, medium soil, heavy soil, black clay soil, red loamy soil, red sandy loam soil and red sandy soil. One soil, the medium soil, was chosen to represent the Shaanxi province. The choice of soil was based on empirical knowledge. Next to selecting a soil, the maximum water depth of Rice and the water availability at planting had to be implemented. The values of the maximum water depth and water availability at planting were 100 mm and 50 mm, respectively, and were obtained from the book Irrigation and drainage engineering
(Wang, 2010).
3.4
Yield, agricultural production data
Data on crop yield (ton ha-1) and agricultural production (ton yr-1) was obtained from Shaanxi Statistical Yearbook (Shaanxi Provincal Bureau of Statistics & NBS Survey Office in Shaanxi Province , 2009). It has to be noted that all agricultural production values were obtained from this source, except for the Potato crop. The value of agricultural production of the Potato crop was obtained from Liu (2011).
3.5
Data for grey water footprint calculation
Data on grey water footprint related to Nitrogen (N) was obtained from a several different sources. Data on the nitrogen fertilizer application rates per crop was estimated based on FAO FertiStat database (FAO, 2007). We assumed that the fertilizer application rates (kg ha-1) in the Shaanxi province were equal to the national average (see Appendix IV).
The assumption was made that on average 10% of the applied nitrogen fertilizer is lost through leaching. This results in a leaching factor of 0.10. This factor was based on Chapagain et al. (2006). The maximum value of nitrogen (N) is 10 mg per litre, following US-EPA (Chapagain et al., 2006). Since there was a lack of data on natural value of nitrogen, the natural concentration (cnat) was
assumed zero, following Hoekstra et al. (2011) when natural concentrations are not known precisely. There has to be noted that this results in an underestimated grey water footprint when the natural concentration is not equal to zero.
3.6
Water availability data
The amount of ‘available irrigation water’ for crop production per district was used as reported by Shaanxi Water Resources Bulletin 2008 (Department of Water Resources, 2008). These values have been assumed here to represent the blue water availability of the province. The water for
assimilating the water pollution of the grey water footprint is normally the actual run-off (Ract). Also,
15
4
RESULTS
4.1
Water footprint related to crop production
Shaanxi’s total water footprint of crop production in 2008 was 18764 Mm3 yr-1. The green water footprint was 7543 Mm3 yr-1, the blue water footprint was 7836 Mm3 yr-1 and the grey water footprint was 3385 Mm3 yr-1. This converts to percentages of 40%, 42% and 18% to the green, blue and grey water footprints, respectively.
4.1.1 Water footprint per district
The water footprint per district is set out in Table 4.1. Next to the values of the water footprints, the district’s relative share of the provincial water footprint is given. Also the ranking position is given, with #1 as the largest contributor and #10 as the smallest. The water footprint per district was obtained by summarizing each individual water footprint of the crops cultivated in the district. Appendix V shows the water footprint by crops per district.
[image:26.595.66.553.440.647.2]As Table 4.1 shows, the largest contributor was the Weinan district (3682 Mm3 yr-1) and it accounts for 20% of the total water footprint for Shaanxi province. The Tongchuan district (398 Mm3 yr-1) is the smallest contributor to the provincial water footprint with 2%. The main causes are the amount of crops cultivated and its production values per district. Weinan is also the largest one concerning the production. For Tongchuan it is vice versa, where it has the smallest production compared with the other districts.
Table 4.1: Water footprint per district in Shaanxi province in 2008
In Figure 4.1 a distinction is made between the green, blue and grey components of the water footprints for the districts. The ten districts differ slightly from each other concerning the green-blue water footprint ratio. This ratio for the province is about 1:1 (40%:42%). Individually the districts: Xi’an (#3),Tongchuan (#10),Weinan (#1), Yan’an (#9) and Yulin(#5) have a larger blue water footprint than the district’s green water footprint. The districts: Ankang (#7),Baoji(#4),Hanzhong (#6), Shangluo (#8),Xianyang (#2) have a smaller blue water footprint compared to the district’s green water
footprint. The provincial grey water footprint accounts for 18% of the total water footprint. The District Water footprint related to production (Mm
3
yr-1)
Percentage Position #
Green Blue Grey Total
Xi'an 920 1103 464 2487 13% 3
Ankang 707 315 292 1315 7% 7
Baoji 1075 952 372 2399 13% 4
Hanzhong 968 380 382 1731 9% 6
Shangluo 457 388 182 1027 5% 8
Tongchuan 116 216 66 398 2% 10
Weinan 1169 1887 626 3682 20% 1
Xianyang 1073 1011 505 2589 14% 2
Yan’an 291 347 127 765 4% 9
Yulin 766 1237 369 2372 13% 5
Total 7543 7836 3385 18764 100%
16 district’s grey water footprint compared to the district’s total water footprint varies between 16% (Yulin) and 22% (Hanzhong and Ankang). The grey water footprint in terms of quantitative values varies between 66 Mm3 yr-1 (Tongchuan) and 625 Mm3 yr-1 (Weinan).
The variations of the water footprints per districts are spatially mapped in Figure 4.2. The districts located in the middle of Shaanxi (Xi’an, Hanzhong, Baoji, Xianyang, Weinan) and in the North of Shaanxi (Yulin) show the largest water footprint. Looking at the water footprint components
individually, we see the same phenomenon of higher water footprints in the middle and the North of Shaanxi. The main reason is that the crop production in these districts with a large water footprint are significantly larger compared to the districts with lower water footprints. Another reason, but with less impact on the size, is the water footprint per unit mass of crop. As it is higher for certain crops in some areas because of the difference in the degree of development of crop agriculture between the districts and the difference in the crop water requirements of the same crops between districts due to climatic influences. A more complete explanation is given in section 4.1.
Comparing the water footprint of districts this way will give a view on where the largest water footprint is located in the province. It is logical to say that smaller districts with less cultivated land and less production have smaller water footprints compared to districts with more cultivated land and more production. This can been seen at the Tongchuan district, a small district, versus the Yulin district, that is a number of times larger. There is a way to compare districts in another way, based on the import and export of crops for every district. In chapter 6, the discussion part, this way of
comparison will be explained briefly, as this method is excluded in this study.
500 1.000 1.500 2.000 2.500 3.000 3.500 4.000
Wate
r fo
o
tp
ri
n
t
(
M
m
3/yr
)
Grey WF
Blue WF
[image:27.595.71.513.129.412.2]Green WF
17
18
4.1.2 Water footprint by crop
The contribution of the major crops to the water footprint related to crop production of Shaanxi province is presented in Figure 4.3. Wheat (6352 Mm3 yr-1) and Maize (6337 Mm3 yr-1) contribute the largest part to the total water footprint together accounting for about 68% of the province total. The other crops’ water footprint is 6075 Mm3 yr-1 and accounts for the other 32%.
The total green water footprint was 7543 Mm3 yr-1. Maize (3207 Mm3 yr-1) has a large green water footprint and accounts for about 43% of the total green water footprint. Next to Maize, Wheat (1695 Mm3 yr-1) is the second largest contributor to the green water footprint and accounts for 22% of the total green water footprint. The other crops (2641 Mm3 yr-1) account for 35%.
The total blue water footprint was 7836 Mm3 yr-1. The major crops contributing to the blue water footprint are similar to the green water footprint. Here the Wheat crop (3849 Mm3 yr-1) is the largest contributor with 49% and is followed by Maize (1690 Mm3 yr-1), which accounts for 22%. Other crops (2297 Mm3 yr-1) contribute 29%.
[image:29.595.76.371.388.745.2]The total grey water footprint related to the use of nitrogen fertilizer in crops cultivation was 3385 Mm3 yr-1. Maize (1439 Mm3 yr-1) and Wheat (808 Mm3 yr-1) are also the largest contributors to the grey water footprint, accounting for 42% and 24,espectively. The other crops (1138 Mm3 yr-1) account for 34%.The detailed information on water footprint of the other crops can be found in Appendix VI.
19
4.1.3 Water footprint of the crops per district
The contribution of the crops to the water footprint per district is presented in Figure 4.4
As shown in Figure 4.3, the size of the water footprints are mainly caused by the Maize and Wheat crops, as described in the previous subsection. Especially in the districts Xi’an, Baoji, Weinan and Xianyang, the water footprints of Maize and Wheat are large and therefore create a large water footprint for these districts.
For Cotton we see a significant share in the Weinan district, but in the other 9 districts, where Cotton is cultivated, the amount is insignificant.
The water footprints of Rape and Rice are noticeable in the Ankang and Hanzhong districts, but minimal for the other districts.
Potato has a large share in the water footprint of the Yulin district.
The water footprint of Soybean has a noticeable amount in all of the districts, especially in the districts of Xianyang, Yan’an and Yulin.
Peanut contribution is relatively small in the districts where it is cultivated. This phenomenon, where the district’s size of the water footprint of Peanut is small, corresponds with the size of the water footprint of Peanut at provincial level. This is mainly caused from the low share of production compared to the other crops.
The water footprint of small vegetables is relatively small, even though the small vegetables account for 26% of the total crop coverage related to production. This can be explained due to the small amount of the water footprint to produce a ton of small vegetables (m3 ton-1). Therefore the small water footprint (m3 ton-1) compensates the large production values of these vegetables and results in a small water footprint related to production compared to the other crops.
0 500 1000 1500 2000 2500 3000 3500 4000
Wate
r fo
o
tp
ri
n
t
(M
m
3/y
r) Potato
Peanut
Vegetables
Rice
Rape
Wheat
Soybean
Maize
[image:30.595.72.522.489.776.2]Cotton
20
4.2
Water footprint per unit mass of crop
The green, blue, grey and total water footprint per unit mass of crop are given in Appendices VII and VIII.
As shown in Appendix VII, the water footprint per unit mass of crop per district are given. If we compare the blue and green water footprint per unit mass of crop, we can see a relation between the location of a district and its water footprint. In the North of Shaanxi, districts Yulin, Yan’an and Tongchuan, we see larger blue water footprints compared to the green water footprint. In the middle of Shaanxi, districts Xi’an, Boaji, Shangluo, Weinan and Xianyang, the blue and green water footprints are more in ratio with each other. In the South of Shaanxi, districts Hangzhong and Ankang, we see a larger green component compared to the blue water footprint. This phenomenon can be ascribed to the amount of precipitation in a district. A low amount of precipitation will lead to a smaller green water footprint and a higher blue water footprint, since irrigation water has to fill up the necessary amount (which the green water could not meet) to fulfil the crop water requirement. It applies the opposite way vice versa, high precipitation will lead to a large green water footprint and a small blue water footprint. As we know, the climate varies throughout the length of Shaanxi, with a more arid and dry climate in the North and a more humid and subtropical climate in the South. Since there is less precipitation in the North due to the climate, the green water footprint is smaller than the blue component (less green water, more blue water to meet CWR). In the South it the other way around, due to the climate with its high precipitation. The climate in the middle is somewhere in between these extremes and therefore the green and blue components are the same.
As we see in Appendix VIII, the magnitude of the water footprints of the same type of crop vary between districts. There are several factors that explain why the water footprint can differ so much for the same crop in different districts. Kampman (2007) showed that there are two main factors, which have large correlations with the size of a crop water footprint. The first factor is the difference in crop yield. A higher crop yield will lead to a lower water footprint and vice versa. The crop yield mainly depends on the development of agriculture. The better developed, the higher the crop yields. The degree of development can be divided in different sides of agricultural production, such as crop characteristics, fertilizer use or irrigation schedules. The second factor is the amount of the crop water requirements, which goes side by side with the evapotranspiration (ET). A high crop water requirement will lead to a higher water footprint at same level of crop productivity (Y) and vice versa. The crop water requirement is influenced by climatic parameters and crop characteristics. It has to be noted, that a higher ET rate leads not only to a higher crop water requirement but also to a higher biomass of the crop, which leads to a higher yield. However, the non-productive part of the ET
rate (losses), that does not contribute to the biomass of the crop, is relatively higher and therefore the influence of climatic parameters on the water footprint is relatively higher.
21
4.2.1 Water footprint of the largest crops
Since a general conclusion on the water footprint of crops is hard to find, it is still interesting to see how certain crops and their corresponding water footprint are distributed spatially. As shown in Figure 4.3, Wheat and Maize have the largest contribution to the crop water footprint related to crop production in the Shaanxi province. Wheat and Maize have a share of 68% together of the total water footprint related to crop production. Therefore the water footprint per unit mass of these two crops are described in more detail.
Figure 4.5 (left) shows the spatial variation of the water footprint per unit mass of Wheat in the Shaanxi province.
The water footprint of Wheat in the Shaanxi province varies from 1125 m3 ton-1 to 11732 m3 ton-1 among districts, with an weighted average of 1347 m3 ton-1.
The district with the largest water footprint of Wheat is the Yulin district (11732 m3 ton-1) in the most northern part of the province. The reason behind this large water footprint concerns the low
production values compared to the area use, or low yield. The yield of Wheat in the Yulin district is 0,631 ton ha-1 compared to the average yield of 3,219 ton ha-1 for the whole province. Besides the low yield the crop water requirement is 37% higher in this district compared to the average value. Next to the largest water footprints of Wheat in Yulin, the water footprints in Shangluo (2593 m3 ton
-1
), Tongchuan (1940 m3 ton-1) and Yan’an (2143 m3 ton-1) are relatively large. The size of these water footprints is a result of reasons similar to those of the Yulin district, namely lower yield and higher crop water requirements. However, they were less extreme compared to Yulin.
Medium water footprints can be found in the Hanzhong (1310 m3 ton-1), Weinan (1432 m3 ton-1) and Ankang district (1654 m3 ton-1). Although Ankang’s water footprint is still somewhat large.
Smaller water footprints can be found in remaining districts Xi’an (1125 m3 ton-1), Baoji (1183 m3 ton
-1
) and Xianyang (1265 m3 ton-1). The reasons for smaller water footprints are higher yields and lower crop water requirements.
The crop yields in the districts can be ascribed to the degree of development of a district, described in the previous section. The Yulin district (0,631 ton ha-1) differs a lot from the average yield as it is 80% smaller than the average provincial yield (3,219 ton ha-1). It is obvious to say, this difference can be ascribed to harvest failure. However, comparing to the yields of the previous two years, 0,822 ton ha-1 (2006) and 0,480 ton ha-1 (2007), we see that these yields are also very low. There are either two possibilities: the cultivation of Wheat in the Yulin district is underdeveloped or the district struggles with harvest failures the last few years. These two possibilities are related to each other because underdevelopment can lead to loss of harvest due to of lack of well agricultural management. Figure 4.5 (right) shows the variation of the water footprint of Maize in the Shaanxi province. The water footprint of Maize in the Shaanxi province varies from 850 m3 ton-1 to 1748 m3 ton-1, with an average of 1157 m3 ton-1.
22 In South Shaanxi, the Ankang (1632 m3 ton-1), Hanzhong (1418 m3 ton-1) and Shangluo (1341 m3 ton-1) districts have large water footprints. The water footprint of Maize is large due to lower yields, since the crop water requirement lies under the provincial average.
Yulin (1240 m3 ton-1) is about average of the Maize water footprint. Lower water footprints can be found in the districts at middle to mid-North Shaanxi: Xi’an(1030 m3 ton-1), Tongchuan (1067 m3 ton
-1
), Weinan (964 m3 ton-1), Xianyang (850 m3 ton-1) and Yan’an (1060 m3 ton-1). Here the crop water requirements are average to low and yields are average to large.
As this Figure 4.5 shows the water footprint of Maize is higher in South Shaanxi. This is mainly caused by the lower yields in these districts. We can say that these districts are less developed in terms of the cultivation of Maize than the other districts. Also the climate can play part in the limitation of crop yields. However, the climate in the South is in generally more gentle than in the North. The crop water requirements are below average and therefore not responsible for the large water footprints. Except for the Baoji district, where the large crop water requirements influence the water footprint a lot.
4.2.2 Comparison with other studies
[image:33.595.74.504.339.602.2]The acquired water footprints (m3 ton-1) of this study can be compared to the water footprints of previous studies. A study that includes the water footprints of crops of Shaanxi is ‘The green, blue and grey water footprint of crops and derived crop products’ (Mekonnen & Hoekstra, 2011). It includes an assessment of the water footprints of crops and crop products around the world for the
23 period of 1996-2005. As part of this assessment the Shaanxi province has been included and the values of the water footprints of this study are obtained from Appendix II of the report.
[image:34.595.65.534.172.355.2]Table 4.2 shows the comparison of the average water footprints estimated in this study the study by Mekonnen & Hoekstra (2011).
Table 4.2: Comparison between water footprint per unit mass crop in Shaanxi province
Crop
De Boer (2014) Mekonnen & Hoekstra (2011)
Comparison Water footprint (m3 ton-1) Water footprint (m3 ton-1)
Year 2008 Average for 1996-2005
Green Blue Grey Total Green Blue Grey Total
Cotton 3144 3135 1006 7285 2971 371 1344 4687 55%
Maize 585 309 263 1157 713 20 290 1023 13%
Peanut 1266 718 259 2243 1190 44 257 1491 50%
Potato 151 251 83 485 202 4 97 303 60%
Rape seed 1021 1196 677 2894 1261 0 505 1766 63%
Rice 802 411 233 1446 483 297 215 995 45%
Soybean 2056 1323 406 3785 2374 253 254 2881 31%
Wheat 360 816 171 1347 720 285 312 1317 2%
Veg. small 42 41 52 135 N/A N/A N/A N/A -
We see differences between the values. The biggest difference of the total water footprint per unit mass is 63% and belongs to the Rape seed crop. The Wheat crop shows the smallest difference of 2%. As explained in the previous section 4.2, values can differ a lot due to large crop water requirements and low yields.
The main differences can be explained by the following reasons:
Difference between study periods;
Application of different data and area scale
Different model approaches and assumptions.
The time period of this study includes the year of 2008 and assumes all the crop land was irrigated without consideration of soil water stress. As we examine the study of Mekonnen & Hoekstra (2011), it includes a time period of several years, ranging from 1996 to 2005. The water footprints found by Mekonnen & Hoekstra (2011) are average values for rain-fed and irrigated area under soil water stress over these years. Therefore climate variations throughout the year do not have as much impact on the water footprints. For a single year study, such as this study, climate variation can have a certain impact on the water footprints. As described in section 1.2, the year of 2008 was relatively dry. Since there was less rainfall, the shortage of water to complete the crop water requirements will be done by irrigating more. This leads to a higher blue water footprint, which we see when
comparing the two studies. The blue water footprints are higher in this study than in the compared study of Mekonnen & Hoekstra (2011). This also explains why the green water footprint in this study is lower compared to Mekonnen & Hoekstra (2011).
24 such as rainfall, growth periods, Kc, yields, and production. This will lead to different ETc’s and
different water footprints per single crop. The average water footprints per unit mass of crop are taken by the weighted average water footprints per unit mass of crop per district, with its weight based on the production values. In the study of Mekonnen & Hoekstra (2011) the accounting of the water footprints of the crops has been averaged at province scale and not on district scale.
Accounting the water footprints on a larger scale, details can be overlooked. Also, Mekonnen & Hoekstra (2011) state that in a global study like theirs, because of lack of data, several assumptions and expert guesses were made. Therefore the water footprint values at a smaller spatial scale should be interpreted with care.
In the study of Mekonnen & Hoekstra (2011), a grid-based water balance model was used to
estimate the crop water use for 126 primary crops. For the other 20 crops, which are grown in only a few countries, the CROPWAT 8.0 model was used. Mom (2007) states that the use of different model scan have a significant impact on the outcome, since simulations and assumptions are different per model. Also, Mekonnen & Hoekstra (2011) used irrigation maps per crop to allocate where irrigation is taking place, and in those places the application of full irrigation is assumed. The method used in this study and the Mekonnen & Hoekstra (2011) method both lead to an overestimation of the blue water footprint. Because farmers may decide to irrigate below the optimal yield level, especially in places where water scarcity is occurring. However, the method of using irrigation maps will give more precise calculations because it is clear where irrigation is taking place at all. In contradiction, in this study we assumed that irrigation is taking place wherever it needed if rainfall does not cover the crop water requirement. In reality it is possible that irrigation is not possible in certain areas even though it is needed. This could lead to an overestimation of the blue water footprint.
4.3
Water footprint sustainability
4.3.1 Blue water scarcity
Figure 4.6 shows the blue water scarcity for cropland per district of the Shaanxi province. There is blue water scarcity when the blue water footprint exceeds the available blue water. Blue water availability and water scarcity values can be found in Appendix IX.
As stated in section 2.7, blue water scarcity has four different classes.
The first class is defined as ‘low blue water scarcity (<1.0)’. There are four districts that could be assigned to this class: Hanzhong (0.05), Ankang (0.05), Shangluo (0.29) and Baoji (0.69). Here, the blue water footprint does not exceed blue water availability. It means the supplied blue water was enough for cropping at optimal condition in the four districts.
For the other six districts the ratio exceeds 1,0. Here, blue water scarcity might occur.
25 South of Shaanxi, since the northern part is more arid and the southern part more humid. Also, the districts with higher water footprints related to production are located in in the North and in the middle of Shaanxi. The districts in the South belong to the five districts with the lowest water footprints.
Figure 4.6: Blue water scarcity per district in Shaanxi province in 2008
The blue water scarcity assessment was done under the best condition, where we assumed all supplied irrigation water can contribute to the actual productivity without waste. In reality it could be worse, by considering the low irrigation water efficiency values (~0,5) of the districts (Appendix X). This could lead to an underestimation of the blue water scarcity of the districts.
It has to be noted that the blue water sustainability assessment is executed based on the yearly blue water scarcity. For this reason there has no distinction been made of monthly blue water scarcity. An explanation is given in the discussion part.
4.3.2 Water pollution level
Figure 4.7 shows the water pollution level per district of the Shaanxi province. The water pollution level is too high when there is not enough water to assimilate the grey water footprint.
26 However, the districts in middle Shaanxi, Xi’an, Xianyang and Weinan could be risks in the future. As stated before, the same reasons of the blue water scarcity apply for these districts too.
[image:37.595.76.320.165.456.2]Like the blue water scarcity analysis, the grey water pollution analysis is also done on a yearly basis. The explanation done for the blue water scarcity also applies for the grey water pollution.