2 Design of a 360 degree obstacle detection system with haptic feedback
3
Summary
The i-Botics center is an initiative of the University of Twente and TNO. The main goal of the i-Botics group is to design a remote controlled robot with telepresence technologies. In this, an operator should be able to operate the robot in a remote environment, while having the sensation of being present at the robot’s location. This can be useful in situations which re-quire human expertise but where safety of humans is not guaranteed. To be able to experience telepresence, feedback must be given to the operator. Multiple forms of feedback exist such as audio, visual and haptic feedback.
This thesis is a subpart within the larger i-Botics project and contains the design of a haptic feedback system for the detection of obstacles in the surrounding area of the robot. Such a system can be useful to prevent collisions between the robot and the environment, making sure that damage to both is prevented. The research done is design oriented and puts the focus on the design of the obstacle detection system. The software structure for the haptic feedback system is implemented but the implementation and testing of the haptic feedback algorithm is left for future work.
For the obstacle detection system, it is necessary to have sensors on the robot. Based on pre-vious work, an ultrasonic sensor is chosen to fulfill this task. In the analysis, the important scanning area around the robot is determined. Based on this, a sensor configuration is chosen. An Arduino is used to interface the sensors’ data measurements.
A software system is implemented in the production phase. The sensor data measurements are translated to an obstacle list in a base frame. Filtering of obstacles is done next as it is decided to only give haptic feedback on obstacles in the path of motion. For obstacles in the path of motion a path length is calculated. The path length is seen as the distance from the robot to an obstacle. Haptic feedback will be based on this path length and on the velocity of the robot. The velocity is received from the IMU sensor.
Experiments were conducted to test the performance of the system. It appears that the system responds as expected but that includes limitations. The main issue is the calculation for the path length to an obstacle. To keep track of time, simplifications are made. These result in large, but predictable, path length errors. There are 3 parts which contribute to the path length errors. The first introduced path length error is caused by the assumed path starting point, resulting in a maximum error of 0.647m. The second introduced path length error is caused by the calculations for obstacles in the swerving area, resulting in a maximum error of 14m. The final introduced path length error is caused by the assumed angle of an obstacle. It turns out that in some cases the theoretical assumed angle is so far off from the actual angle, that the system ignores obstacles which lie in the path of motion of the robot. This results in collisions between the robot and obstacles.
The conclusions is drawn that a proper structural basis is given in which all the elements needed to translate sensor data to haptic feedback is included. However, some improvements are needed to further reduce the path length errors. Therefore, multiple recommendations for future work are given. These include the need for a different angle approximation method such as a worst case assumed angle. Next, a simple check must be implemented that determines whether an obstacle is in the swerving area. Finally, The proper collision point on the platform must be determined. This can be done by using the calculated radii and angles.
4 Design of a 360 degree obstacle detection system with haptic feedback
5
Samenvatting
Het i-Botics centrum is een initiatief van de Universiteit Twente en TNO. Het hoofd doel van de i-Botics groep is om een op afstand bestuurbare robot met telepresentie technologieën te ontwerpen. Hierin moet de bestuurder de robot op afstand kunnen besturen en tegelijkertijd het gevoel krijgen aanwezig te zijn op de locatie van de robot. Dit kan nuttig zijn in situaties die menselijke expertise vereisen maar waar veiligheid van mensen niet gegarandeerd kan worden. Om telepresentie te ervaren moet feedback worden gegeven aan de bestuurder. Verschillende vormen van feedback zoals audio, visuele en haptische feedback bestaan.
Deze scriptie is een subonderdeel binnen het grotere i-Botics project en gaat over het ontwerp van een haptisch feedback systeem voor het detecteren van obstakels in het nabijgelegen ge-bied van de robot. Dit systeem kan nuttig zijn om botsingen tussen de robot en de omgev-ing te voorkomen en zorgt ervoor dat schade aan beide voorkomen wordt. Het onderzoek is ontwerpgericht en de focus ligt bij het ontwerp van het obstakeldetectiesysteem. De software structuur voor de haptische feedback is geïmplementeerd maar de implementatie en het testen van het haptische feedback algoritme zullen in de toekomst moeten worden gedaan.
Voor het obstakeldetectiesysteem zijn er sensoren nodig op de robot. Er is gekozen voor een ultrasonische sensor en deze keuze is gebaseerd op eerder werk. In de analyse is het belan-grijke scangebied rondom de robot gedefinieerd. Gebaseerd op het scangebied is een sen-sorconfiguratie gekozen. Een Arduino zal dienen als interface voor de data metingen van de sensoren.
In de productiefase is het softwareonderdeel geïmplementeerd. De datametingen van de sen-sor zijn omgezet naar een obstakellijst in een basis coördinatenstelsel. Hierna worden ob-stakels gefilterd omdat de keuze is gemaakt om alleen feedback te geven op obob-stakels in het pad van beweging. Voor obstakels in het pad van beweging worden de padlengtes berekend. De padlengte kan gezien worden als de afstand van de robot tot aan het obstakel. De haptische feedback wordt uiteindelijke gebaseerd op 2 componenten: de afstand tot een obstakel en de snelheid van de robot. De padlengte wordt gebruikt voor het afstands component. De snelheid van de robot wordt doorgegeven door de IMU sensor. Het combineren van beide componenten geeft de input voor de haptische feedback.
Experimenten zijn uitgevoerd om de functionering van het systeem te testen. Het blijkt dat het systeem zich gedraagt zoals verwacht, echter kwamen hiermee ook de bijbehorende beperkin-gen naar voren. Het voornaamste probleem is de berekening van de padlengte naar een ob-stakel. Om de tijd in de gaten te houden, zijn er simplificaties uitgevoerd. Hierdoor zijn er significante, maar voorspelbare, padlengtefouten geïntroduceerd. Er zijn 3 onderdelen die bijdragen aan de padlengtefouten. De eerste geïntroduceerde padlengtefout wordt veroorza-akt door het aangenomen padstartpunt, dit resulteert in een maximale fout van 0.647m. De tweede geïntroduceerde padlengtefout wordt veroorzaakt door de berekening voor obstakels in het zwenkgebied, dit resulteert in een fout van maximaal 14m. De laatste geïntroduceerde padlengtefout wordt veroorzaakt door de veronderstelde hoek van een obstakel. Het blijkt, dat in sommige gevallen, de theoretische veronderstelde hoek zo ver van de werkelijke hoek af ligt, dat het systeem obstakels negeert die in het pad van beweging liggen. Dit resulteert in botsin-gen tussen de robot en obstakels.
Concluderend, er is een degelijke structurele basis gegeven waarin alle benodige elementen aanwezig zijn die sensordata omzetten naar haptische feedback. Echter, een paar verbeterin-gen zijn nodig om de padlengtefouten te verminderen. Daarom zijn er meerdere aanbevelin-gen voor toekomstig werk. Een andere hoekbenaderingsmethode is nodig, dit kan
6 Design of a 360 degree obstacle detection system with haptic feedback
beeld een worst case veronderstelde hoek zijn. Daarnaast moet er een simpele check worden gedaan of er een obstakel in het zwenkgebied zit. Als laatste, moet het juiste botsingspunt op het platform worden bepaald. Dit is mogelijk door gebruik te maken van de berekende radii en hoeken.
7
8 Design of a 360 degree obstacle detection system with haptic feedback
Contents
1 Introduction 1
1.1 Context . . . 1
1.2 Project goal . . . 1
1.3 Approach. . . 1
1.4 Research questions . . . 1
1.5 Report outline . . . 2
2 Analysis 4 2.1 Robotic setup . . . 4
2.2 Existing system . . . 4
2.3 Obstacle detection system. . . 5
2.4 System structure . . . 16
2.5 Conclusion. . . 17
3 Design and implementation 19 3.1 Sensor system . . . 19
3.2 Calculation of distance to obstacle . . . 20
4 Testing and Results 31 4.1 Experiment 1: Validate the quadrant system working for the collision area . . . . 32
4.2 Experiment 2: Validate the working of the boundary conditions of the collision area . . . 33
4.3 Experiment 3: Test the filtering of obstacles near the collision area . . . 35
4.4 Experiment 4: Determine if the closest obstacle is chosen for haptic feedback . . 37
4.5 Experiment 5: Determine the severity of the path length error due to the path starting point . . . 38
4.6 Experiment 6: Show the false angle calculation for an obstacle in the swerving area 39 4.7 Experiment 7: Determine the severity of the introduced path length error due to the assumed angle of an obstacle. . . 40
4.8 Discussion . . . 41
5 Conclusion and Recommendations 44 5.1 Conclusion. . . 44
5.2 Recommendations . . . 46
A Initial idea for haptic feedback 50
CONTENTS 9
10 Design of a 360 degree obstacle detection system with haptic feedback
1
1 Introduction
1.1 Context
The I-botics center is an initiative of TNO and the University of Twente. The aim of the I-botics center is to design a robot with telepresence technologies such that the operator can operate the robot from a distant place while still having the sensation of being in a remote environment. The focus in this research is on the design of a subsystem in this larger project. To be able to experience telepresence, feedback must be given to the operator of the robot. There are many different feedback implementations such as audio, visual and haptic feedback. This research focuses on the design of a haptic feedback system for the detection of obstacles.
1.2 Project goal
When driving in a remote environment, it is likely that the platform encounters obstacles. De-tecting and avoiding these obstacles is essential as colliding with the obstacle could result in damage to the platform or environment. An obstacle detection system can support the oper-ator in this by detecting obstacles and making their presence known to the operoper-ator. The goal of this particular project is therefore to extend the existing 1 degree of freedom obstacle detec-tion sensory system to a full 360° obstacle detecdetec-tion system. With this detecdetec-tion system, haptic feedback is provided to notify the operator where obstacles are located in the surrounding area without having any visual information. The system aims on supporting the user when trying to avoid obstacles rather than driving autonomously.
1.3 Approach
The first steps on designing this obstacle detection system have already been done and all the information about the existing system can be found in [6]. This system uses one ultrasonic sensor which is mounted at the front of the robot’s platform. This allows detection of obstacles at the front of the platform. The existing system needs to be extended such that 360° obstacle detection is realized. Therefore multiple sensors need to be added to the sides and back of the platform. Consequently, research needs to be done on the feasibility of the use of multiple ultrasonic sensors. Also, the currently existing haptic feedback feature is designed for the use of one ultrasonic sensor. It must be extended for the use of multiple sensors and multiple obstacles. In addition to this, it is important to evaluate and redesign the algorithm used in the haptic feedback feature as multiple users stated a drop in the interpretation of the force especially at the closer regions to the obstacle. During this project, software is written in C++ and the middleware ROS is used as communication framework.
1.4 Research questions
The main goal of this design is to achieve 360° obstacle detection with haptic feedback. The system is divided in two subsystems: the obstacle detection system that will detect obstacles and the haptic feedback feature to notify the operator of the presence of obstacles. To be able to achieve the main goal, research questions are formulated for each subsystem. These research questions are:
Main research question:
• How to design a properly functioning 360° obstacle detection system with an intuitive feeling haptic feedback implementation?
2 Design of a 360 degree obstacle detection system with haptic feedback
Obstacle detection system:
• What area around the platform is of interest when trying to detect obstacles?
• How many sensors with what individual position and orientation are needed to be able to properly scan this area of interest?
• How are interference and dead zones influencing the performance of the sensor setup? How can this be tested?
Haptic feedback:
• What sensor data processing must be done such that it can be used to generate haptic feedback based on the location of one or more obstacles?
• On which obstacles does the system need to give haptic feedback? 1.5 Report outline
In Chapter2, the analysis part for the obstacle detection system is done. In this, the require-ments will be formulated and the general approach is given. In Chapter3, the steps towards the design and implementation of the obstacle system is outlined. Next, experiments are con-ducted and these will be presented in Chapter4, together with the results. In that same chapter, a discussion about the results is given. Based on the results, conclusions can be drawn and rec-ommendations can be given, this is done in Chapter5.
CHAPTER 1. INTRODUCTION 3
4 Design of a 360 degree obstacle detection system with haptic feedback
2 Analysis
In this chapter, the steps towards the conceptual design of the obstacle detection system are presented. First, the requirements on the obstacle detection system are discussed and after-wards the used sensor is characterized. Based on this, a sensor configuration is chosen. Finally, a decision is made on how to interpret the measurements done by the sensor. This all gives a basis for the design phase of the system. The haptic feedback feature will not be implemented due to time constraints and only some initial ideas are presented.
2.1 Robotic setup
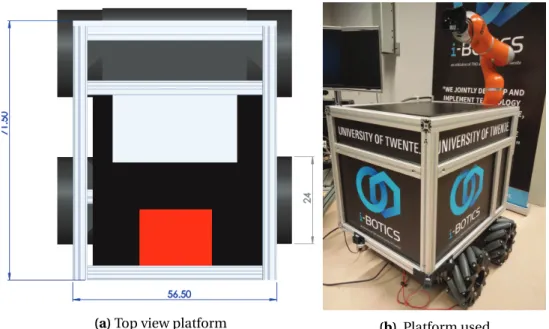
The robotic setup is shown in Figure2.1. In Figure2.1aa drawing for the top view of the plat-form is shown. The dimensions of the platplat-form are 71,50 cm by 56,50 cm and via its 4 mecanum wheels it is able to move around. In Figure2.1b, the physical system is shown. The horizontal bottom aluminum bars can be used to mount ultrasonic sensors on. Haptic feedback will be given on the input device that actuates the platform. This could either be an omega device or pedals.
(a)Top view platform (b) Platform used
Figure 2.1: Robotic setup
2.2 Existing system
As mentioned in the introduction part, the existing system exists of a single ultrasonic sensor mounted at the front of the platform. With this, obstacles can be detected at the front of the platform. When an obstacle is detected, the ultrasonic sensor will measure a distance to the obstacle. The distance measurement from the sensor is presented as an analog voltage signal and is send to an Arduino Uno. The Arduino Uno translates the analog voltage to a distance and afterwards it sends the information via ROS to the PC. The control system of the platform runs on the PC. This control system makes sure that the user input is read to actuate the plat-form and haptic feedback is given to the user. The haptic feedback implementation consists of a linear force feedback algorithm. The force algorithm exists of the sum of 2 individual com-ponents. One component is based on the distance to an obstacle and the other component is based on the velocity of the platform. Both these components have a linear relation with the
CHAPTER 2. ANALYSIS 5
force. The equation used for haptic feedback is shown in Equation2.1:
F=c·d x
d t +k·x (2.1)
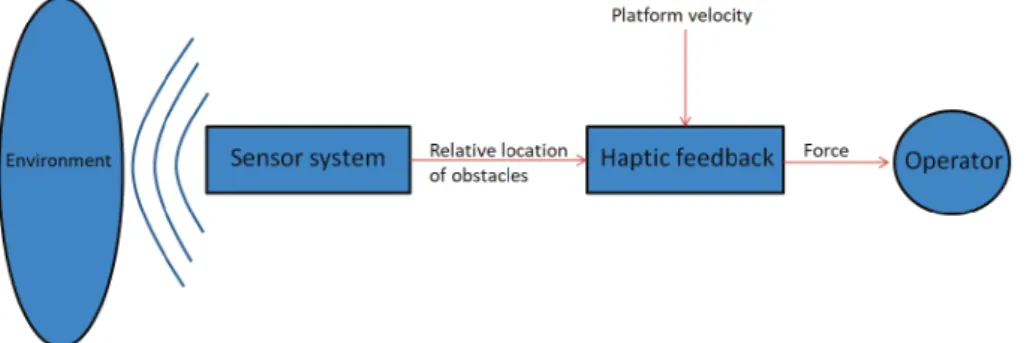
. The velocity is included because the operator has different response times at different veloci-ties. An overview of the haptic feedback system is shown in Figure2.2. For additional informa-tion on the design of the existing system, see [6].
Figure 2.2: Haptic feedback system overview
2.3 Obstacle detection system
In this section the requirements on the sensor system are discussed. Based on this a sensor configuration is chosen.
2.3.1 Area of interest
Before going into detail about the sensor configuration, it must be clear what particular areas around the platform are important to scan when trying to prevent collisions. This area of inter-est is dependent on the motion capabilities of the platform. By knowing the motion capabilities of the platform, it can be determined which obstacles form a threat to the platform. Therefore, it is necessary to determine the motion capabilities first. This will be done now.
The movement of the platform is assumed to be differential. This means that the platform is able to move forward and backward but also rotate around its axis. Any combination of these is also possible resulting in a circular motion with a radius. Now the movement has been defined it is possible to address the important areas which need scanning. In Figure2.3ba top view of the system is shown. The red circles show the points which are most important when rotating as they define the amount of swerving. These are: the back corners and front wheels. The blue circles represent the space that the platform needs when rotating for each mentioned point. The sensor system should thus scan the area within the outer blue circle. The next movement is translation which can be seen in Figure2.3a, where the straight lines represent the forward and backward movement. A combination of translation and rotation is shown with the circles in Figure2.3a. The motion capabilities of the platform can thus be seen as the set of different circular movements. These motion capabilities are of importance when defining an area of interest.
CHAPTER 2. ANALYSIS 9
In Figure2.6is shown how the beam pattern (detection area) of the sensor is shaped for certain objects. In each scenario A, B and C, the sensor is positioned at the bottom (middle) of the grid. Pattern A is measured with a dowel (cylindrical rod) of 6.1mm as object while pattern B is measured with a dowel of 1 cm as object. It is mentioned by MaxBotix that the beam pat-tern size and shape for human detection lies between patpat-tern A and B. The assumption is now made that pattern A is an "at least" requirement. This means that the area around the platform must be at least covered when having radiation pattern A. In other words each sensor must ex-actly touch or have overlap with its neighbor sensors when applying beam pattern A. With this statement, it should thus be possible to detect at least humans and dowels of 6.1mm diameter. As different materials and shapes will influence the radiation pattern it could be possible that some obstacles have an even smaller detection area or are not detected at all.
When implementing the sensor beam patterns into the drawing of Figure2.5a few things be-came evident. The first point is that using the MB1000, the system needs at least 10 sensors to cover the full 360° range, assuming the at least case scenario with beam pattern A. So when proposing configurations (which will be done in the next section), the least amount of used sensors is 10. Another remark is about the area close to the platform. It can be seen in Figure 2.6that the sensor has a small beam width in the first few inches. The data sheet also states that any distance closer than 6 inch is represented as 6 inch. It will thus be difficult to detect obstacles in this area. This should be kept in mind when proposing configurations.
Figure 2.6: Radiation patterns MB1000 for obstacles A: dowel 6.1mm, B: dowel 1 cm, C: dowel 8.89cm on a 30 cm grid [1]
For the interface of the sensors there are multiple data representations and these are listed below:
• Analog voltage • Pulse width • RS232 Serial
To visualize each of these data representations a scheme is given in Figure2.7.
CHAPTER 2. ANALYSIS 13
unknown how the beam pattern is shaped when detecting other obstacles than the mentioned dowels. So the case of a beam pattern which is bigger than beam pattern C is to be considered. On the other hand the manufacturer quotes the following:"The MaxSonar® sensors, because of continuously variable gain, will typically ignore adjacent sensors when running simultaneously" [4]. This suggests that the sensors would ignore each others signal bursts and thus interference would typically not be a problem. Extensive testing needs to be done to be able to measure how much problems interference will give. In this research no extensive testing will be done and is left for future work. In the next section some possible software based solutions will be given in case interference causes problems.
2.3.4 Multi-operation use of sensors
In the previous section a sensor configuration is chosen and this showed that there will be overlap in the radiation area of neighbor sensors and in some cases also other sensors. This could cause interference when the sensors are operating simultaneously. The manufacturer claims that due to continuously variable gain it will typically ignore adjacent sensors and thus prevents interference problems. Because the manufacturer does not guarantee it, it could still be a problem and thus a backup plan is made. The manufacturer has multiple ways on how chaining of sensors could work without interference. These are:
• Free run operation • Simultaneous Operation
• Commanded Sequential Reading • Constant Looping Operation
The free run operation is commonly used when there is a single sensor operating in the area. If there are multiple sensors operating next to each other they are not synchronized because of frequency drifts. When a sensor has just started its cycle it will send out a burst. When this burst has been send out it will go into listening mode. While in listening mode it could be possible that another burst coming from a different sensor is being reflected back by an obstacle and received by the listening sensor.
Simultaneous operation is a method which is used when chaining of sensors is desired. This method enables synchronization of the sensors. All RX pins of each of the sensors are con-nected. This means that all sensors will start their burst at the exact same time. Their cycles are thus synchronized but still it could be that a reflected signal from a sensor is received by another nearby sensor. This could result in collecting incorrect data.
Commanded sequential reading is also a method which can be used when chaining sensors. The chain is put in a sequential configuration meaning that when the first sensor is triggered it will first finish its cycle before triggering the next sensor. The chain is triggered by an external device and after one iteration of the entire chain it will wait for the external device to trigger it again. This is a safe method because there won’t be any chance on having interference prob-lems. This is because there is always just one sensor operating. The downside for this method is that the overall update frequency will decrease with the amount of sensors used.
The last method is the constant looping iteration which uses the same principle as the com-manded sequential reading but this one does not have to be triggered by the external device after each iteration. It will trigger the loop once and then the chain is continuously operat-ing.
Another method could be to combine the Commanded sequential reading and the simultane-ous operation. For example, 2 sequential pairs could be formed where the individual sensors in a pair operate simultaneous. This could be seen as an odd and even pair. Where sensor 1 is
16 Design of a 360 degree obstacle detection system with haptic feedback
it is difficult to determine whether both sensors are detecting the same obstacle or a different obstacle. To keep track of time the decision is made to treat each measurement of sensors as a separate obstacle even when it is the same obstacle. So this scenario would not occur but in future work research could be done to handle this. To again keep track of time it is decided to assign the angle of the sensor to the obstacle.
2.4 System structure
In section2.3the analysis for the sensor system is done and the conclusion is drawn that it is now possible to locate obstacles in the area of interest. This gives the basis to start on the processing part of the system. In this section, the control structure of the entire system is pre-sented. This to give an overview on the steps that are needed to translate sensor measurements to data, which can be presented to the haptic feedback component.
2.4.1 Control system
An overview of the control system that is used is given in Figure2.13. This control system is also used in the existing system and therefore it is also be used in this design.
Figure 2.13: Extended system overview [6]
The first part of the system is to make sure the platform is able to move. This is done via the Omega haptic device. The user moves the Omega around and gives the controller a position in-put. The controller translates this position to a velocity set point and sends velocity commands to the platform. A detailed discussion of this system is out of scope for this assignment. The other part of the system generates haptic feedback based on measurements of the ultra-sonic sensors and the velocity received from the IMU. The controller calculates the feedback force and the Omega is set accordingly. How the controller determines the according feedback force is discussed in the next section.
2.4.2 Model for calculating force feedback
The model used to calculate the force feedback is visualized in Figure2.14. Here the vertical fixed world represents an obstacle. When this obstacle is detected by the ultrasonic sensor a virtual spring and damper can be used to model the force feedback. When approaching the obstacle the spring is compressed and its counterforce depends on the displacementxof the spring. The damper is used to generate a force based on the velocity of the platform. In the linear case a formula as shown in Equation2.14represents the force feedback calculation. The damping factor c and stiffness factor k are constant in this case.
F=c·d x
d t +k·x (2.14)
.
18 Design of a 360 degree obstacle detection system with haptic feedback
19
3 Design and implementation
In this section the design and implementation towards a functioning obstacle detection system is presented. First, the sensor system is implemented to pass on its distance measurements to the rest of the system. After that, an overview is given for the software implementation, which will further process the distance measurements. Each of the components in the software implementation will be discussed. After this chapter, the system should be able to deliver both the distance and velocity component for haptic feedback.
3.1 Sensor system
3.1.1 Sensor casings
To be able to properly mount the sensors with their respective angles on the platform some casings are designed. The angles of each sensor in the to be defined base frame are determined in Section3.2.3. The design for the cases are done in Solidworks [3]. An example of such a drawing in solidworks is given in Figure3.1a.
(a)Sensor casing drawing in SolidWorks (b) Sensors mounted on platform
Figure 3.1: Sensor setup
The result of mounting these cases on the platform is shown in Figure3.1b. With the sensors being properly positioned on the platform it is possible to perform the next step, which is to interface the sensor data with the PC. How this is done will be explained in the next subsec-tion.
3.1.2 Arduino hardware
To be able to process the sensor data an interface is needed that connects the sensor system and the PC. The distance measurements done by the sensors are processed by an Arduino Mega. The Arduino Mega uses a microchip which provides 54 digital pins. So with 12 sensors the Arduino Mega is able to receive all the data with the used pulse width data type. Two more digital pins are needed to trigger the 2 sequential pairs. When the data is processed by the Arduino it will present the data via the ROS middleware to the PC. The PC further processes this data to eventually determine the distance to obstacles. How this is done will be discussed in the next section.
CHAPTER 3. DESIGN AND IMPLEMENTATION 21
3.2.2 Arduino software implementation
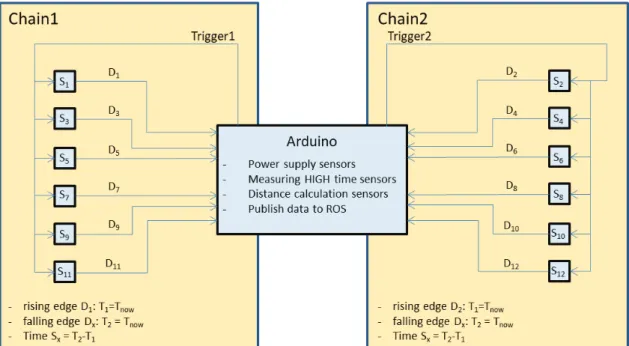
The first component mentioned in the previous section was the Arduino. In this, the data com-ing from the sensors is received, processed and eventually presented to the coordinate trans-formations component. The first step in the design for this is the measurement it self. As men-tioned in the analysis, the sensor system will have 2 separate chains in which each chain has 6 sensors measuring synchronously. This is visualized in Figure3.3, where 2 triggers individually trigger 6 sensors at the same time.
Figure 3.3: Arduino software structure
In this, it is important to mention that any neighbor sensor is in a different chain for inter-ference prevention. Because 6 sensors are operating at the same time, a method needs to be implemented that makes sure that the sensors data pins can be read out real-time. To facilitate this timestamps are used. The ArduinoPul se I n() function is used to delay the system until the rising edge of the data pin of the first sensor in the chain. This marks the time when the sensor starts its measurement and thus the first time stamp is set here. It is assumed that the data pins are synchronized because of the connected RX pins, this has not been verified. The Pul se I n() function needs to measure a falling edge first before it will finish its measurement on the rising edge. The sensor data pins will only provide a falling edge after a measurement is done. Therefore, the refresh rate of the system is half of what it could be. A solution should be found to use timestamps without thePul se I n() function.
Having set the first time stamp, a while loop will continuously check each data pin to see if it has been pulled low. When this occurs, the second time stamp for a specific sensor is set. Subtracting the second time stamp from the first time stamp gives the range reading. This time reading can be translated to a distance as the data sheet mentions that 147 micro seconds equals 2,54 cm. This will continue until all sensor data pins are pulled low. Afterwards the second sensor chain will be triggered in the same way and so on. This range reading list will be send to the coordinate transformations component via ROS which is discussed in the next section.
22 Design of a 360 degree obstacle detection system with haptic feedback
3.2.3 Coordinate transformations
Having received the range reading list from the sensor system it is now possible to project the obstacles in a base frame. This step is done because the sensors measure a distance with re-spect to their own location. Generalizing the list of obstacles to a representation in a uniform frame will make it simpler to process the obstacle list further on. This base frame is defined as shown in Figure3.4. The reason that this base frame orientation is chosen, is because the IMU sensor also uses this reference frame. To keep the system simple the base frame will have the same orientation. To be able to present obstacles in the defined base frame, coordinate transformations have to be done for each obstacle measured. In the following calculations, the theory behind these coordinate transformations is explained.
First it must be mentioned that the needed coordinate transformations are a static transfor-mation as the base frame and the sensor frames will be located on the same body, namely the platform. Because of this the needed coordinate transformations can be performed by using the transformation matrix H given in Equation3.1.
H(x,y,θ)=
cos(θ) si n(θ) x −si n(θ) cos(θ) y
0 0 1
(3.1)
In Equation3.1,θrepresents the angle offset between the original frame and the new frame. A counter clockwise rotation means a positiveθ. x and y represent the coordinate of the origin of the original frame expressed in the new frame. This transformation matrix can be used to describe a point in a base frame which is measured in a sensor frame. To transform the point p measured in a sensor frame (s) into a point p described in a base frame (b), Equation3.2 holds:
bP=Hb
s sP (3.2)
In Equation3.2sPdescribes the point p in a sensor frame,bPdescribes the point p in the base frame. When writing this out further this will result in Equation3.3:
bx by 1 =
cos(θ) si n(θ) x −si n(θ) cos(θ) y
0 0 1
sx sy 1 (3.3)
The frame of the sensors are defined in a way such that the y-axis of the sensor frames are in line with the sensors line of sight. This is visualized in Figure3.4. The assumption was made that the measured obstacle is assigned the same angle as the sensor angle. Because of this the cartesian coordinates of the obstacle which is described in the sensor frame will always have an x coordinate equal to 0 and a y coordinate value equal to the distance d, measured by the sensor. ThussP becomes as is shown in Equation3.4:
sP= 0 sd 1 (3.4)
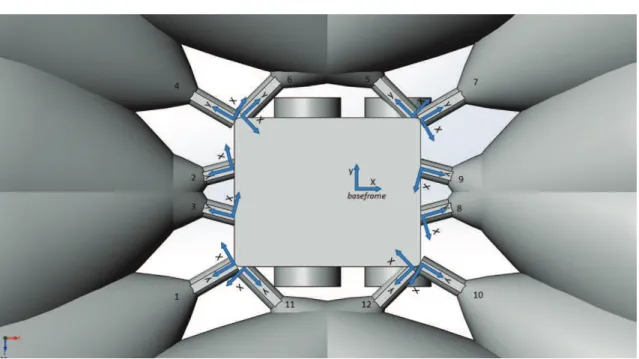
Thus now the only thing left to do is to actually determine the angle offsetθfrom the sensor frame to the base frame and to define the origin of each sensor frame expressed in the base frame. As mentioned earlier all the frames are fixed with respect to the same body and thus the parameters x,y andθ are fixed as well. Figure3.4shows the assigned frame number for each sensor. Theθof interest for each sensor is the relative angle difference between a sensor
CHAPTER 3. DESIGN AND IMPLEMENTATION 23
frame and the base frame given that counter clockwise rotation results in a positive angle. The defined angles forn1..12are shown in Equation3.5:
θn=£−120 −105 −75 −60 −45 45 60 75 105 120 135 −135¤
(3.5)
Figure 3.4: Orientation and numbering of the sensor frames
Figure3.5shows the position and distance offset for the sensors 1,3,8,10,11 and 12 from the center of rotation. On the other side the other 6 sensors are positioned and these are the mir-rored versions of the shown ones. The base frame will have its origin in the center of rotation (same as the IMU) and thus these parameters can be used to express the origin of each sensor frame defined in the base frame. The Cartesian coordinates (x.y) in meters forn1..12are shown
in Equation3.6:
·bxn byn ¸
= ·
−0.42 −0.42 −0.42 −0.42 0.24 −0.37 0.29 0.29 0.29 0.29 −0.37 0.24 −0.28 0.13 −0.13 0.28 0.28 0.28 0.28 −0.13 0.13 −0.28 −0.28 −0.28
¸
(3.6)
26 Design of a 360 degree obstacle detection system with haptic feedback
In Equations3.8and3.9the following parameters are valued:h1= 0.293m ,h2= 0.422m and w
= 0.566m.
This calculation of the minimum and maximum radius also holds when the platform is moving in quadrant 1 and 2. P0 is in that case located on the left side of the platform. In that case P6 would be taken to calculate the minimum radius and P4 would be taken to calculate the maximum radius. The platform is symmetrical around the x-axis and therefore the length from the points P0 to P6 and P0 to P4 are equal to the lengths defined for motions in quadrant 3 and 4 .
Having determined the radius boundaries, the next step is to calculate the angle boundaries. With the angle boundaries the collision area is fully defined. The angle boundaries are formu-lated as shown in Equations3.10and3.11
quad r ant1and4 (
θmi n=2π−si n−1(rh2
max)
θmax=|vx|·t
rcor
(3.10)
quad r ant2and3 (
θmi n= −2π+si n−1(h1
rp3)
θmax= −|vx|·t
rcor
(3.11)
The only unknown variable rp3 (shown in Figure 3.6) is calculated according to Equation
3.12:
rp3=
r
(rcor+w 2)
2+h2
1 (3.12)
As mentioned earlier moving in quadrant 1 and 4 (thus having a forward motion) will result in a positive angle. Moving in equadrant 2 and 3 (thus having a backwards motion) will result in a negative angle. This is also used for the boundaries. Figure3.6ashows a visualization for θmi nandθmax in case of a forward motion. It can be seen thatθmi nin Equation3.10is always positive andθmaxin Equation3.11is always negative. This may seem strange at first but it has to do with path length calculations for obstacles in the collision area, as will be explained later on in this section.
Having defined the radius and angle boundaries, the collision area is defined. If the radius and angle to an obstacle is known a check can be done whether these lie within the collision area. Therefore the calculation of the radius and angle of an obstacle is the next step in the process.
For determining the radius and angle of an obstacle, again a quadrant system is used. Any position of an obstacle is known in cartesian coordinates with respect to the center of rotation of the platform, as explained in the coordinate transformations component. These cartesian coordinates are used to define the obstacle’s quadrant. The numbering of the quadrants is the same as defined in the quadrant of motion system and is shown in Equation3.13.
Obst acl e quad r ant=
1 f or x>0and y>0 2 f or x<0and y>0 3 f or x<0and y<0 4 f or x>0and y<0
(3.13)
With the information about the quadrant of motion and obstacle quadrant it is time to de-termine the radius and angle of an obstacle. A switch structure is used to do this. The switch
CHAPTER 3. DESIGN AND IMPLEMENTATION 27
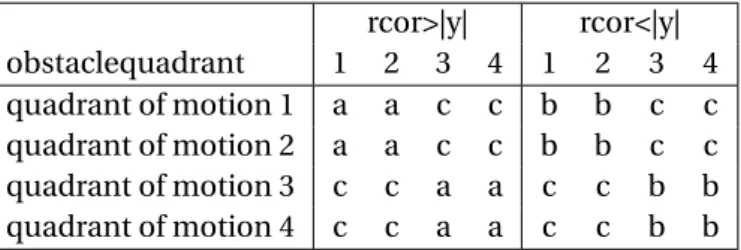
statement determines the quadrant of motion first and afterwards the quadrant of the obstacle. In this there are 48 different sets of equations. The calculations are variations of the equations for the radius and angle shown in Equation3.14and Equation3.15.
Rad i us= p
x2+(rcor− |y|)2=a
p
x2+(|y| −rcor)2=b
p
x2+(|y| +rcor)2=c
(3.14)
Ang l e=
t an−1( |x|
rcor−|y|)=d
t an−1(|y|−|xr|
cor)=e
t an−1( |x| |y|+rcor)=f
(3.15)
The variations for the radius are given in table3.1and for the angle in table3.2. rcor>|y| rcor<|y|
obstaclequadrant 1 2 3 4 1 2 3 4
quadrant of motion 1 a a c c b b c c quadrant of motion 2 a a c c b b c c quadrant of motion 3 c c a a c c b b quadrant of motion 4 c c a a c c b b
Table 3.1:Radius calculations used in the quadrant system
rcor>|y| rcor <|y|
obstaclequadrant 1 2 3 4 1 2 3 4
quadrant of motion 1 d 2π-d 2π-f f π-e π+e 2π-f f quadrant of motion 2 -2π+d -d -f -2π+f -π-e -π+e -f -2π+f quadrant of motion 3 -2π+f -f -d -2π+d -2π+f -f -π+e -π-e quadrant of motion 4 f 2π-f 2π-d d f 2π-f π+e π-e
Table 3.2:Angle calculations used in the quadrant system
With the conditions defined for the switch statement an example is given. In the following example an obstacle is positioned in quadrant 4. The platform will either move in quadrant of motion 3 or 4. A visualization of this example is shown in Figure3.7.
CHAPTER 3. DESIGN AND IMPLEMENTATION 29
Algorithm 1Check for obstacle in collision area
1: ifquad r ant i s1or 4then
2: ifrobs>rmi n AN D robs<rmaxthen
3: ifθobs>θmi n AN Dθobs<θmax then
4: Obstacle in collision area
5: end if
6: end if
7: end if
8: ifquad r ant i s2or 3then
9: ifrobs>rmi n AN D robs<rmaxthen
10: ifθobs<θmi n AN Dθobs>θmax then
11: Obstacle in collision area
12: end if
13: end if
14: end if
area will be calculated next. Due to the definitions of the radius and angle for the obstacles Equation3.18can be used:
l= |θobs| ·robs (3.18)
With this, it is known what the path length to each obstacle is in the collision area. To keep track of time it is decided to only pass on information about the obstacle with the shortest path length to the haptic feedback component (which will not be implemented). Once the obstacle with the shortest path length is determined the obstacle processing component will output in-formation about the path length and velocity of the platform. These are the parameters needed to calculate the haptic feedback components.
30 Design of a 360 degree obstacle detection system with haptic feedback
31
4 Testing and Results
At this point the obstacle detection system has been designed and implemented. In this sec-tion experiments are executed to test the system. The experiments in secsec-tion4.1,4.2,4.3, and 4.4determine if the structure of the system works as intended. In these experiments it is deter-mined respectively, if the quadrant system works, if the collision area is properly calculated, if filtering of obstacles is done properly and if the closest obstacle is chosen for haptic feedback. If all of these results comply with the theory, the obstacle processing is done as intended. After this, the experiments performed in section4.5,4.6and4.7should present the known lim-itations of the system defined in Chapter3. As there are multiple assumptions made, false cal-culations occur. These false calcal-culations are known and these experiments will present them. The experiments respectively determine the severity of the path length error due to the path starting point, show the false angle calculation for an obstacle in the swerving area and the path length error introduced due to the assumed angle of an obstacle.
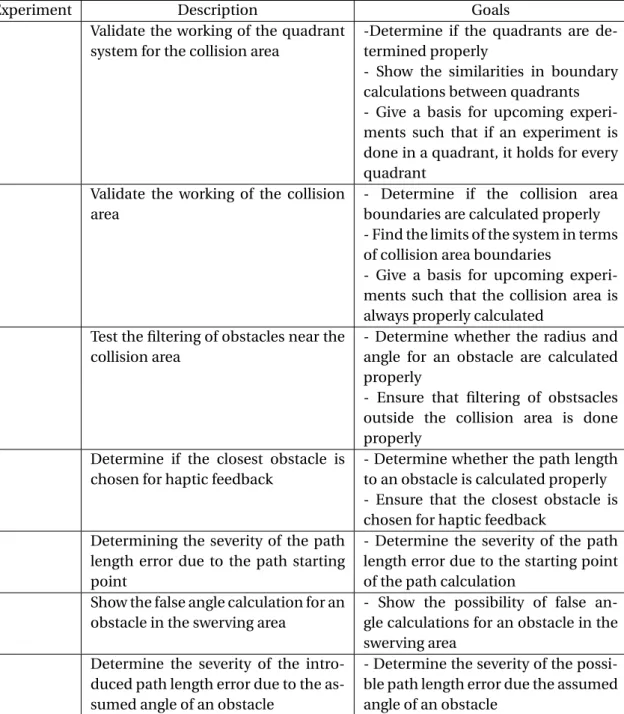
Now each experiment will be performed, but first, an overview of all the experiments executed and their goals is given in table4.1:
32 Design of a 360 degree obstacle detection system with haptic feedback
Experiment Description Goals
1 Validate the working of the quadrant system for the collision area
-Determine if the quadrants are de-termined properly
- Show the similarities in boundary calculations between quadrants - Give a basis for upcoming experi-ments such that if an experiment is done in a quadrant, it holds for every quadrant
2 Validate the working of the collision area
- Determine if the collision area boundaries are calculated properly - Find the limits of the system in terms of collision area boundaries
- Give a basis for upcoming experi-ments such that the collision area is always properly calculated
3 Test the filtering of obstacles near the collision area
- Determine whether the radius and angle for an obstacle are calculated properly
- Ensure that filtering of obstsacles outside the collision area is done properly
4 Determine if the closest obstacle is chosen for haptic feedback
- Determine whether the path length to an obstacle is calculated properly - Ensure that the closest obstacle is chosen for haptic feedback
5 Determining the severity of the path length error due to the path starting point
- Determine the severity of the path length error due to the starting point of the path calculation
6 Show the false angle calculation for an obstacle in the swerving area
- Show the possibility of false an-gle calculations for an obstacle in the swerving area
7 Determine the severity of the intro-duced path length error due to the as-sumed angle of an obstacle
- Determine the severity of the possi-ble path length error due the assumed angle of an obstacle
Table 4.1:Overview of the experiments executed and their goals
4.1 Experiment 1: Validate the quadrant system working for the collision area
This experiment has two main goals. The first goal is to determine whether the quadrants are properly determined using the path of motion and to show that there are similarities in the boundary calculations between quadrants. The second goal is to give a basis for the upcom-ing experiments, such that if an experiment is done in a quadrant of motion, it holds for all quadrants of motion.
The steps executed in this experiments are as follows. First a path of motion in each of the 4 quadrants of motion (with equal radius) is defined. Then the radius and angle range for each of the 4 quadrants of motion is calculated. Finally, the theoretical calculations are compared to the system calculations.
CHAPTER 4. TESTING AND RESULTS 33
The hypothesis is, that the radius boundaries for each quadrant of motion should give the same results. Also, the angle boundaries for the quadrants of motion 1, 4 and quadrants of motion 2, 3 should give the same results.
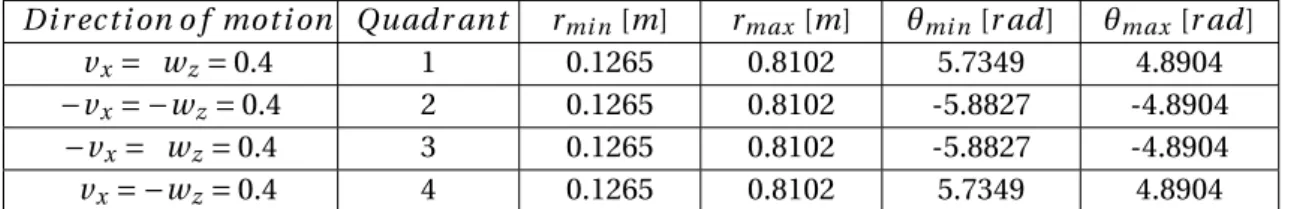
The magnitude of the values chosen forvxis 0.4m/sandωzis 0.4r ad/s. The theoretical values for the radius and angle boundaries are shown in table4.2.
Di r ec t i on o f mot i on Quad r ant rmi n[m] rmax[m] θmi n[r ad] θmax [r ad]
vx= wz=0.4 1 0.1260 0.8105 5.7356 4.8904
−vx= −wz=0.4 2 0.1260 0.8105 -5.8826 -4.8904
−vx= wz=0.4 3 0.1260 0.8105 -5.8826 -4.8904
vx= −wz=0.4 4 0.1260 0.8105 5.7356 4.8904
Table 4.2:Theoretical calculations for quadrants of motion
The system calculated values for the radius and angle boundaries are shown in table4.3
Di r ec t i on o f mot i on Quad r ant rmi n[m] rmax[m] θmi n[r ad] θmax [r ad]
vx= wz=0.4 1 0.1265 0.8102 5.7349 4.8904
−vx= −wz=0.4 2 0.1265 0.8102 -5.8827 -4.8904
−vx= wz=0.4 3 0.1265 0.8102 -5.8827 -4.8904
vx= −wz=0.4 4 0.1265 0.8102 5.7349 4.8904
Table 4.3:System calculations for quadrants of motion
It can be seen that the theoretical- and system calculations are close to identical and comply with the expected result. Thus, determining the quadrant of motion is done properly for al quadrants. Based on experiment 1, the assumption is made that the results for a quadrant of motion holds for all quadrants of motion. The following experiments will use this assump-tion.
4.2 Experiment 2: Validate the working of the boundary conditions of the collision area
This experiment has multiple goals. The main goal is to verify that the calculation of the colli-sion area boundaries are done according to the theory. Another goal is to show that the angle boundaries are limited to a full circle in case of small radii and that large radii may introduce difficulties in angle boundary calculations. This experiment aims thus on finding the limits of the system in terms of boundary conditions for the collision area. The final goal is to give a ba-sis for the following experiments, such that it can be assumed that the collision area is properly determined in each quadrant of motion.
The steps executed in this experiment are as follows. First some radii of interest for the path of motion are defined. The collision areas for the radii of interest are calculated next. finally, these results will be compared to the system calculated collision area.
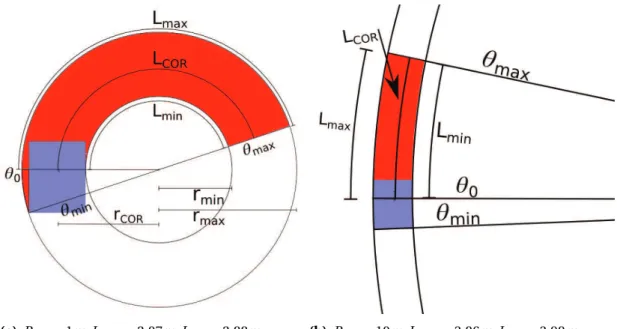
Interesting path of motions are: rotation only (r =0.01m), motion with radius equal to half the width of the platform (r =0.3m), random movements (r =1, 10m) and translation only (r=100m) Thus, the defined radii of interest are:rcor=[0.01, 0.3, 1, 10, 100]m. In table4.4the theoretical calculations for the collision area are shown.
CHAPTER 4. TESTING AND RESULTS 35
(a)Rcor=1m,Lmi n=2.07m,Lcor=2.88m, Lmax=3.89m
(b) Rcor=10m,Lmi n=3.86m,Lcor=3.98m, Lmax=4.09m
Figure 4.2: Visualization of the collision area for given path of motion
In general, it can be stated that the system calculates the collision area as expected. The bound-aries are limited to a full circle as is shown in the calculation for the radius of interest equal to 0.01. Also, for a large radius of motion the angle range become quite small. In this case, the res-olution of the system becomes vital. Based on this experiment it is assumed that the collision area is properly calculated, this will be used in the following experiments.
4.3 Experiment 3: Test the filtering of obstacles near the collision area
The main goal of this experiment is to make sure that the radius and angle calculation for an obstacle is done properly. The other goal is to ensure that filtering of obstacles outside the collision area is done.
The steps executed in this experiment are as follows. First a radius of motion is defined and the collision area is calculated. The corner points of the collision area are then determined in polar coordinates and translated to cartesian coordinates. Obstacles will be positioned around these corner points and their cartesian coordinates are calculated. Translating the obstacles carte-sian coordinates back to polar coordinates will show which obstacles lie within the boundaries of the collision area. Finally, a comparison is made between theory and practice.
An example radius of motion is chosen asrcor =2m. An approximation visualization of the collision area is shown in Figure4.3.
CHAPTER 4. TESTING AND RESULTS 37
The cartesian coordinates of the obstacles are translated back to polar coordinates and are shown in table4.9. Based on table4.9it can be seen that obstacle 2,4 and 8 lie in the
colli-obstacle Radius [m] Angle [rad]
1 1.692 1.689
2 1.731 1.687
3 1.737 1.709
4 2.297 1.692
5 2.302 1.710
6 2.337 1.690
7 2.341 6.094
8 2.295 6.108
Table 4.9:Polar coordinates of obstacles
sion area as their radius and angle is within the boundaries defined in table4.6. The other obstacles lie outside the collision area. This corresponds with the theory.
What has not been tested is whether the resolution of the system for large radii of motion suf-fices. It might be possible that for large radii of motion an obstacle is falsely positioned inside or outside the collision area due to the resolution of the system. Because for large radii of mo-tion the radius calculamo-tion for both the collision area and obstacle approaches infinity and the corresponding angle calculations approach 0. This should be examined in future work.
4.4 Experiment 4: Determine if the closest obstacle is chosen for haptic feed-back
The main goal of this experiment is to determine whether the path length calculation is done properly. The other goal is to see if the closest obstacle is taken for haptic feedback.
The steps executed in this experiments are as follows. First a radius of motion is defined. Then 3 obstacles with different radii in the collision area will be defined. The path length to each of these obstacles is calculated next. Finally, the system should determine which obstacle is the closest one.
The same radius of motion of experiment4.3is chosen and is defined asr =2m. The corre-sponding collision area boundaries are given in table4.6. The obstacles that are defined will all have an angle equal to,θmax−0.01, and radii as shown in table4.10a.
Obst acl e Rad i us[m] pat h l eng t h[m]
1 rmi n+0.01 2.918
2 rmi n+rmax
2 3.415
3 rmax−0.01 3.909
(a)Theoretical path length calculations
Obst acl e Rad i us[m] pat h l eng t h[m]
1 rmi n+0.01 2.921
2 rmi n+rmax
2 3.415
3 rmax−0.01 3.908
(b)System calculated path length calculations
Table 4.10:Path length calculations
A visualization of the positioning of each obstacle is shown in Figure4.4and it can be seen that obstacle 1 is the closest obstacle to the platform.
42 Design of a 360 degree obstacle detection system with haptic feedback
found by taking the starting point of the path at the point on the platform that will collide with the obstacle. The polar coordinates of this point must be found in order to determine the path length to an obstacle.
The path length error for obstacles in the swerving area was analyzed in the experiment of Section4.6. The experiment showed that for the given obstacle, the path length was equal to 14.018m. That was caused by the assumption that the platform would collide with the obstacle in a forward motion. A first step would be to define the angle as 2π−θobs instead ofθobs (for-ward motion) and−2π+|θobs|instead ofθobs(backwards motion) for obstacles in the swerving area. The boundaries of the collision area can be used to implement this.
The experiment in Section4.7was executed to determine the path length error due to the as-sumed angle of an obstacle. A scenario was chosen in which the largest angle error occurs. It appeared that no radius of motion could be found such that both the projected and actual obstacle were in the collision area. There is a possibility that the projected obstacle lies out-side the collision area while the actual obstacle lies inout-side the collision area. This could cause a collision between the platform and obstacle. No additional tests have been done to find the largest path length error when both obstacles lie in the collision area. This would give an idea on what the path length error could be.
CHAPTER 4. TESTING AND RESULTS 43
44 Design of a 360 degree obstacle detection system with haptic feedback
5 Conclusion and Recommendations
The conclusions of this research are described in this chapter by reviewing the research ques-tions defined in Section1.4. Based on this, recommendations for future work are given. 5.1 Conclusion
The focus in this research is summarized by the main research question:
How to design a properly functioning 360° obstacle detection system with an intuitive feeling haptic feedback implementation?
The first research question, that followed from the main research question, defined the area of interest and gave the requirements for the sensor system:
What area around the platform is of interest when trying to detect obstacles?
For this, the requirement of a travel time of 5 seconds was set. Due to the omni-directional movement of the platform it appeared that the area of interest is ellipse shaped as was shown in Figure2.5. A sensor configuration had to be found that could properly scan this area of interest, which led to the following research question:
How many sensors with what individual position and orientation are needed to be able to properly scan this area of interest?
The sensor configuration shown in Figure2.9bwas chosen. The area coverage in the area of interest for this configuration was optimal compared to others. It appeared that it was not possible to guarantee full coverage of the area of interest. Therefore, a travel time of 5 seconds is not ensured. The consequence is, that the user might have less response time for smaller obstacles, but the severity of this is unknown.
Using this sensor configuration, sensors will have overlap in their scanning area. This was done to prevent dead zones and consequently prevent collisions. There is a trade off between pre-venting dead zones and interference. Both of these could influence the performance of the system and therefore the following research question was derived:
How are interference and dead zones influencing the performance of the sensor setup? How can this be tested?
A sensor chaining method is implemented, in which 2 chains of 6 sensors are working sequen-tially. This ensures that neighbor sensors are not measuring at the same time. This could pre-vent interference. Experiments to test the performance of the sensor system in terms of dead zones and interference have not been performed. In future work experiments should be done to test whether dead zones and interference are problematic.
An Arduino Mega interfaces the sensor data and is responsible for the chaining of sensors. In this, the update frequency could be improved. The frequency is half the frequency of what is desired. This is caused by the PulseIn() function used for setting timestamps. Also, based on the interference experiment results, a decision could be made whether sequential measuring is actually necessary.
Having received obstacle data from the sensor system, processing the obstacle data was neces-sary to translate it to haptic feedback. First, it had to be determined on which obstacles haptic feedback should be given. This led to the following research question:
CHAPTER 5. CONCLUSION AND RECOMMENDATIONS 45
On which obstacles does the system need to give haptic feedback?
Because the main goal of this system is to prevent obstacle collisions it was determined that haptic feedback is only given on obstacles in the path of motion of the platform. Other obsta-cles are not a threat to the platform and can be ignored. Knowing this, it was possible to deter-mine what data processing was required. This led to the following research question:
What sensor data processing must be done such that it can be used to generate haptic feed-back based on the location of one or more obstacles?
Methods have been implemented to translate sensor data measurement to haptic feedback. These are: calculating the collision area, positioning of obstacles, filtering of obstacles and cal-culating the path length to an obstacle.
It appeared that the collision area was properly calculated but for large radii of motion the resolution of this system becomes significant. Errors in filtering of obstacles might occur. It has not been tested if the resolution becomes a problem and at what point. This should be done in future work.
The next method is to position obstacles in the surrounding area. For this, an assumption was made that the angle of an obstacle is equal to the sensor angle. It appeared that some obstacles are positioned outside the collision area, while in reality, they are in the collision area. This may cause collisions between platform and obstacles. A more accurate method to determine an obstacle angle should be implemented.
Knowing the collision area and position of obstacles, a method is implemented that determines whether the obstacle is inside the collision area. This appeared to work properly.
The final method implemented was the calculation of the path length. Simplifications were done for time’s sake but a proper basis is given. Multiple experiments showed that there are path length errors. Causes for this are: using the false starting point of the path, false calcu-lations for obstacles in the swerving area and assumed angle of an obstacle. It appeared that in some cases the deviations are large and an approximation of the real path length can not be guaranteed. Improvements on the calculations have to be done to reduce the path length errors before it is usable for haptic feedback.
Having reflected back on the research questions it can be concluded that the implementation as is contains all the necessary structural components from measurements to haptic feedback. This has given a good basis to further improve the system. This is needed as collisions with obstacles can not yet be fully prevented. Recommendations to improve the system are given in Section5.2.
46 Design of a 360 degree obstacle detection system with haptic feedback
5.2 Recommendations
From the conclusions drawn in Section5.1it appeared that the performance of the system can be improved. These improvements will be discussed now.
For the sensor system there are 3 recommendations to improve the performance of the system. First, the 9 remaining sensors must be mounted on the platform. At this point, only 3 sensors are mounted due to time constraints. All the sensors and cases are already available, but wiring and mounting is yet to be done.
The second improvement might be to implement data filtering, which is not done right now. During the implementation phase it became clear that there are fluctuations in the data mea-surements in a static environment. The difficulty in this, is to determine whether fluctuating data is the result of detecting different obstacles or sensor characteristics.
The third improvement is to increase the update frequency. The PulseIn() function used to set the first timestamp must be replaced by a different function. Also, removing the sequential measuring increases the update frequency but this can only be done if interference is not an issue. This should be tested.
For the obstacle processing system there are also 2 recommendations which could improve the performance of the system. The first improvement is to change the angle approximation method. The method used now, assigning the sensor angle to the obstacle angle, does not guar-antee a collision prevention. A different method is to take the worst case angle. This means that an obstacle is positioned at an angle which is the biggest threat to the platform. This can be de-fined as the angle at which an obstacle is in the collision area and has the shortest path length. It might still be possible that there is a significant path length error, but it ensures that at least all collisions are prevented. Another method is, to use probability theory for approximating an angle to an obstacle, this might decrease path length errors.
The second improvement is the calculation of the path length to an obstacle. In this, there are 2 parts to discuss. The first one is to decrease the path length error for obstacles in the swerving area. Now, the system assumes these collisions only occur at the front of the platform. An extra check must be done to verify that an obstacle is in the swerving area. Changing the angle calculation can be done as mentioned in Section4.8. The second and most challenging improvement is the starting point of the path. Now, the starting point is assumed in the center of rotation line. A method must be implemented that determines the point of collision on the platform. The path length is then equal to the arc from the collision point to the obstacle.
CHAPTER 5. CONCLUSION AND RECOMMENDATIONS 47
48 Design of a 360 degree obstacle detection system with haptic feedback
Bibliography
[1] Datasheet Ultrasonic sensor, visited 25-10-17,
https://www.maxbotix.com/documents/LV-MaxSonar-EZ_-Datasheet.pdf
[2] Matlab data plots, Software: Matlab R2016a education edition, MathWorks, https://nl.mathworks.com/company.html
[3] Beam pattern drawings, Software: SolidWorks 2016 education edition, Dassault Systèmes SOLIDWORKS Corp, Waltham, Massachusetts, USA
http://www.solidworks.com/
[4] Chaining method Ultrasonic sensors, visited 30-10-17
https://www.maxbotix.com/tutorials1/031-using-multiple-ultrasonic-sensors.htm
[5] IPM platform drawing, visited 02-11-17,
https://tex.stackexchange.com/questions/13933/drawing-mechanical-systems-in-latex
[6] Design and Implementation of a 3 Layered Obstacle Detection System with Haptic Feed-back Notification, K. Amr, University of Twente, BSc Report 033RaM2017, 2017
[7] Design of an anti-slip control system of a Segway RMP 50 omni platform, R Lieftink, Uni-versity of Twente, BSc Report RaM 2017, 2017
[8] On design and realisation of a telemanipulation demonstration setup, A. (Arnold) Hofst-ede, University of Twente, BSc Report RaM 2017, 2017
[9] Visuo-Haptic Interface for Teleoperation of Mobile Robot Exploration Tasks, Nikos C. Mit-sou, Spyros V. Velanas and Costas S. Tzafestas, arnumber=4107802, 2006, visited 06-11-17 http://ieeexplore.ieee.org/stamp/stamp.jsp?arnumber=4107802
[10] Predictive Haptic Feedback for Obstacle Avoidance Based on Model Predictive Control, Avinash Balachandran, Matthew Brown, Stephen M. Erlien, and J. Christian Gerdes, 2016, visited 06-11-17
http://ieeexplore.ieee.org/stamp/stamp.jsp?arnumber=7332989
[11] Haptic obstacle detector for the blind, Master of Science Thesis, The Chinh Nguyen, Stockholm, Sweden 2014, visited 06-11-17, page 33
http://www.diva-portal.org/smash/get/diva2:818827/FULLTEXT01.pdf
[12] Force Feedback Implementation Based on Recognition of Obstacle for the Mobile Robot Using a Haptic Joystick, Dong-Hyuk, Lee Kyoung-Taik, Park Sun-Kyun Kang and Jangmyung Lee, visited 07-11-17, page 85
https://link.springer.com/content/pdf/10.10072F978-3-642-40852-6.pdf
BIBLIOGRAPHY 49
50 Design of a 360 degree obstacle detection system with haptic feedback
A Initial idea for haptic feedback
In the previous work done the haptic feedback system is modeled as a linear spring damper system. The application has been tested and the conclusion was that there was a drop in force interpretation especially at closer regions to the obstacles [6]. This appendix will present an initial idea to possibly increase the force interpretation. The drop in force interpretation might be caused by the linear operation as it was hard to estimate the distance to an obstacle based on the force feedback. To increase the sensitivity at short distance a non-linear model of the spring damper system could be applied. This to increase the force interpretation and to make sure that distance estimation to an obstacle is improved. Keeping the above in mind the following applications of a non-linear spring damper system are proposed and will be discussed:
• Exponential function • Increasing linear function • Staircase function
The first algorithm is the exponential function. Due to its exponential behavior, the slope of the function and thus the force sensitivity also has an exponential behavior. The force equation shown in Equation2.14needs to be changed as shown in EquationA.1. A visualization of this equation for the distance component is shown in FigureA.1. The velocity component would have a reversed behavior as the maximum force feedback should be given at maximum velocity. This is opposed to the distance component where a maximum force should be given when the distance to an obstacle is minimal.
F=ec·d xd t +e k
x (A.1)
Figure A.1: exponential function
the constants P and Q will determine the sensitivity to a change in distance and velocity. In terms of having a changing force sensitivity when varying distance this method has the highest sensitivity. Especially at close distances to an obstacle the force sensitivity increases a lot which is definitely a positive aspect of this function. On the other hand when talking about distance interpretation the user might not able to match a certain force to a certain distance as there is no sudden force increase.
The second listed function is the increasing linear function. It uses a stepwise operation and is a linear function within an area but its slope increases when reaching the next area. The slope increase would be dependent on the velocity of the platform. In physical terms this means that the spring and damper constant is increased when reaching the next area. The same IPM shown in Figure2.14can thus be used to represent the system. Equation2.14is used but the constants C and K are varied as shown in EquationA.2. A visualization of this Equation is shown
![Figure 2.6: Radiation patterns MB1000 for obstacles A: dowel 6.1mm, B: dowel 1 cm, C: dowel 8.89cm on a 30 cm grid [ 1 ]](https://thumb-us.123doks.com/thumbv2/123dok_us/9687439.470120/19.892.237.652.533.777/figure-radiation-patterns-obstacles-dowel-dowel-dowel-grid.webp)
![Figure 2.13: Extended system overview [ 6 ]](https://thumb-us.123doks.com/thumbv2/123dok_us/9687439.470120/26.892.193.703.510.661/figure-extended-system-overview.webp)