The Effect of Investment in Children’s Education
on Fertility in 1816 Prussia
Sascha O. Becker* Francesco Cinnirella†
Ludger Woessmann‡
This version: November 9, 2010
Abstract
The interaction between investment in children’s education and parental fertility is crucial in recent theories of the transition from Malthusian stagnation to modern economic growth. This paper contributes to the literature on the child quantity-quality trade-off with new county-level evidence for Prussia in 1816, several decades before the demographic transition. We find a significant negative causal effect of education on fertility, which is robust to accounting for spatial autocorrelation. The causal effect of education is identified through exogenous variation in enrollment rates due to differences in landownership inequality. A comparison with estimates for 1849 suggests that the preference for quality relative to quantity might have increased during the first half of the nineteenth century.
JEL Classification: N33, I20, J13
Keywords: education, fertility, quantity-quality trade-off, unified growth theory, 19th century, Prussia
*
University of Warwick, CEPR, CESifo, Ifo and IZA. e-mail: s.o.becker@warwick.ac.uk
†
Ifo Institute and CESifo, Munich, e-mail: cinnirella@ifo.de
‡
1. Introduction
A large amount of scholarly research studies the decline in fertility that characterized Western countries in the late nineteenth century (Lee, 2003). The European Fertility Project (EFP), conducted at Princeton University during the 1960s and 1970s, aimed at studying the determinants of fertility of most Western European countries (Knodel, 1974; Coale and Watkins, 1986). The EFP concluded that the spread of new moral and cultural norms together with birth control technology were responsible for the fertility decline. This view has found fierce opposition as numerous studies have subsequently shown that economic factors played a significant role in triggering the fertility transition (Galloway et al., 1994; Brown and Guinnane, 2002, 2007).
More recently, the study of the effect of education on fertility as a partial explanation of the demographic transition has received increasing attention. In particular, the concept of a trade-off between the quantity and quality of children represents a crucial aspect of unified growth theories which model the transition from Malthusian stagnation to modern economic growth. According to some models, the technological improvements during the industrialization process increased the demand for education, which in turn triggered the decrease in fertility observed at the end of the nineteenth century (Galor and Weil, 1999; Galor, 2005a, 2005b). In other models, human capital plays a crucial role through its association with life expectancy (Cervellati and Sunde, 2005).
this increase in human capital caused a significant decrease in fertility. The study on Prussia shows the existence of the child quantity-quality trade-off before the demographic transition and focuses on the reverse causality between education and fertility choice.1
In this paper, we expand the existing historical literature on the quantity-quality trade-off of children by going back further in time. We estimate the effect of educational investment on parental fertility in Prussia in 1816. This is particularly interesting because most growth theories underline the significance of the child quantity-quality trade-off only during the fertility transition. In fact, we test the interaction of parental fertility and human capital investments that occurred several decades before the demographic transition, prior to the Industrial Revolution, when the technology-driven demand for education was still low. Our results reveal that a significant negative association existed between the educational enrollment rate and the child-woman ratio in 1816.
We estimate the effect of investment in children’s education both on concurrent and on subsequent parental fertility. In particular, we document to which extent preferences for
children’s education in 1816 affect average annual fertility rates in the subsequent period 1816-21. The results confirm that the effect estimated for 1816 is not due to some random fluctuations of fertility (or education) levels, but rather mirrors a structural relationship.
To identify the causal effect of investment in education on parental fertility, we follow Becker et al. (2010a) to exploit exogenous variation in enrollment rates induced by landownership inequality. Landownership inequality is expected to hinder human capital accumulation as noble landowners had little interest in public schooling because of low complementarities between agriculture and education (Melton, 1988; Galor et al., 2009). Indeed, we find that the effect of educational investment on fertility is causal.
1
As counties constitute our units of observation, we also address the issue of spatial autocorrelation. We find that the child-woman ratio indeed reveals substantial positive spatial autocorrelation. Yet, estimating spatial lag models and spatial error models confirms the significant negative effect of educational investment on fertility. Thus, the findings of this paper add to the evidence on the existence of a quantity-quality trade-off of children before the onset of the demographic transition and prior to the increase in the demand for education induced by technological development.
The internal consistency of the data sources and methodologies between this paper for 1816 and the previous work of Becker et al. (2010a) for 1849 also allows speculating about how the relationship between educational investment and fertility changed during the first half of the nineteenth century. Thus, we can provide evidence on influential evolutionary models such as Galor and Moav (2002) which stress the cultural evolution in the attitude toward child quality.2 The comparative analysis suggests that preferences for quality to the detriment of quantity of children increased over the first half of the nineteenth century. While somewhat speculative, this finding is consistent with the theoretical model of Galor and Moav (2002) which argues that the impact of the increase in the demand for human capital on fertility decline may have been reinforced by cultural evolution in the attitude toward child quality (Galor and Moav, 2005, p. 501).3
The remainder of the paper is structured as follows. Section 2 describes the dataset and presents descriptive statistics of the variables of interest. Section 3 presents the empirical model and our regression analysis, discussing ordinary least squares and instrumental variables estimates. Section 4 performs a spatial regression analysis estimating two spatial models. Section 5 compares our results with existing estimates for 1849. Section 6 concludes.
2
See also Clark (2007) for a controversial evolutionary explanation of why England was the first to industrialize.
3
2. A county-level database for Prussia in 1816
Our data originate from the 1816, 1819, and 1821 censuses conducted by the Prussian Statistical Office, which was founded in 1805 (see also Becker and Woessmann, 2008, 2010; Becker et al., 2010c). All the information is provided at the county level. The Population census in 1816 and 1821 provide information on demography, education, religion, and livestock. The 1819 census provides data on establishments and means of production. The 1819 and 1821 censuses are reported for the 330 counties as constructed by an administrative reform in 1812. At the time of the 1816 census, however, the reform had not yet been established in the original Eastern part of Prussia, where the old structure with larger counties was still in effect. The 1816 census is thus reported for 289 units of observation, and these will also be our units of analysis. Due to some missing information on landownership, our final regression sample consists of 262 observations.4
We use two measures of fertility: the child-woman ratio in 1816 and the average annual fertility rate for the period 1816-21. The child-woman ratio is constructed as the number of children aged 0-7 over the number of women in the age-group 15-45 in 1816. The population census also provides information about the cumulative number of births that occurred in the period 1816-21. A complication is introduced in the cumulative birth counts by the change in county borders between 1816 and 1821 mostly in East Prussia where, according to our data, 96 counties were divided into smaller units. In fact, birth counts are reported for counties under the old and new borders. Therefore, to compute annual fertility rates consistent with the variables for 1816, we had to take into account the exact year in which the county changed its borders. Based on this, we computed the average annual fertility rate dividing the annual
4 Additionally, we drop two observations, namely the counties of Adenau and Stadtkreis Trier, because of
number of legitimate births by the number of women older than 14 in wedlock or still unmarried in 1816.
Figure 1 plots the correlation between the child-woman ratio in 1816 and the annual fertility rates for the subsequent period 1816-21. The figure shows clear persistence in fertility levels: Counties with a high child-woman ratio in 1816 also have relatively high subsequent annual fertility rates.
The other variable of interest, namely education, is constructed as the ratio of children enrolled in public primary schools5 over the total number of children aged 6-14 in 1816.
Further variables used in the regression analysis are: (i) a proxy for the level of proto-industrialization constructed as the number of looms per capita, (ii) a measure for the opportunity cost of women specified as the number of women employed in agriculture over the total number of women aged 15-60, (iii) the level of urbanization, (iv) population density, (v) the share of Protestants, (vi) the share of married women, (vii) the average annual infant mortality rate for the period 1816-21, (viii) a measure for landownership inequality, (ix) the number of schools per 1,000 people, and (x) a proxy for the age at marriage for the period 1816-21.
Table 1 reports descriptive statistics of the variables used in our analysis. The level of primary school enrolment rates in Prussia is high already in 1816: about 60 percent of the children aged 6-14 are enrolled in school. Yet, there is a fair amount of variation as enrolment rates range from a minimum of about 3 percent to a maximum of 95 percent across the counties. There are several possible explanations for such variation, including for example the opposition of noble landlords, differences in attitudes towards education between Protestant and Catholic regions, and the insufficient number of schools (or teachers) in rural areas. In some cases, parents may also have seen compulsory schooling as an unbearable financial
5 We consider as primary schools both elementary schools (Elementarschulen) and middle schools
burden (Melton, 1988). Below, we will exploit the opposition of noble landlords to the compulsory schooling reform in order to identify the causal effect of investment in children’s education on parental fertility.
3. Regression analysis
3.1 Theoretical background and empirical model
The theoretical framework of our analysis is provided by an economic maximization setup (see Galor, 2005b for a formal depiction). Consider a household that derives utility from its own consumption, the number of surviving children, and the quality (education) of each child. Households choose the number of children and their quality in the face of a constraint on the total amount of time that can be devoted to child rearing and labor-market activities. The level of human capital of each child is assumed to be an increasing function of the parental investment in education and a decreasing function of the rate of technological process.6 In such a model, the optimal level of investment in child education increases with changes in the technological environment, with parents’ preferences for education, and with the cost of raising a child (regardless of quality) and decreases with the cost of educating a child.
A testable hypothesis generated by the theory is that exogenous variation in the price of education will have effects on parental fertility. In particular, we shall test to what extent changes in enrolment rates due to higher land concentration, which raises the cost of education, affected household optimal number of children.
Based on this theoretical framework, we estimate the following empirical model:
1 1 1
k
i i i i
fertility = + ⋅α β education +X γ +e (1)
6
where the superscript k refers to our two measures of fertility (child-woman ratio 1816 and average annual fertility rate 1816-21) for county i. Education is represented by the enrolment rate in public primary school in 1816. The coefficient β is our parameter of interest and X is the vector of control variables. As a first approach, we estimate equation (1) using ordinary least squares (OLS). Subsequently, we estimate the causal effect of education on fertility adopting an instrumental variables approach (IV).
3.2 Ordinary least squares estimation
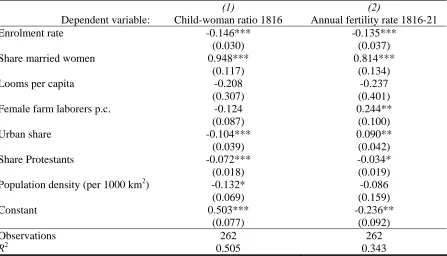
Table 2 reports ordinary least squares estimates of the association between fertility and education. We compare the effect of 1816 education on contemporaneous fertility (column 1) and on the average annual fertility rates of the subsequent six years, 1816-21 (column 2). Both specifications intend to investigate to which extent the current level of investment in children’s education is correlated with current and future levels of parental fertility.
The significant negative correlation between education and both measures of fertility is consistent with the existence of a child quantity-quality trade-off several decades before the demographic transition. This result shows that the cross-sectional relationship between educational investment and fertility is not due to some random fluctuations in the levels, but rather to a structural relationship. In terms of magnitude of the association, an increase in the enrolment rate by one standard deviation is associated with a 0.23 standard deviations decrease in the child-woman ratio. The corresponding negative effect on subsequent annual fertility rates is of the same magnitude.
industry was a large employer of women, in those counties with a higher number of looms per capita the opportunity cost of a child was higher, which made child-rearing more costly.
Several studies on the determinants of the demographic transition showed that the fertility decline was more accentuated in urban environments, presumably due to higher female labor force participation (Galloway et al., 1998). Similarly, we find that counties with larger towns had a lower child-woman ratio, although the coefficient turns positive when using the average annual fertility rate 1816-21 as dependent variable.
3.3 Instrumental variables approach
While depicting the significant descriptive association, the coefficient β estimated by OLS is likely to be a biased estimate of the causal effect of education on fertility. Standard economic theory models fertility behavior and choice of children’s education as simultaneous actions, so that simple OLS estimates of equation (1) are subject to endogeneity bias. Furthermore, the association between education and fertility may be affected by omitted variables, which implies that the error term ε is correlated with the independent variable. To overcome issues
of reverse causality and omitted variable bias, we adopt an instrumental variables (IV) approach which uses exogenous variation in enrolment rates to estimate their causal effect on fertility.
the construction of rural schools or did not make controls to enforce school attendance (Melton, 1988). The 1816 census provides information on the number of land holdings grouped in three categories: 0-15, 15-300, or greater than 300 Morgen.7
That allows us to construct an index of landownership inequality as the ratio of the largest land holdings over the total number of holdings.8
The exclusion restriction is that landownership inequality in 1816 is not directly related to fertility outcomes. Bengtsson and Dribe (2006) show that total marital fertility, as well as age-specific marital fertility, are very similar across socioeconomic groups with different landownership characteristics in pre-transition Sweden. On the contrary, Brown and Guinnane (2002) find that in rural Bavaria, farm size is negatively correlated with marital fertility. However, whereas both studies analyze the effect of farm size, they do not investigate the role of inequality in the distribution of land, which is the relevant point of our identification strategy.
In our case, whereas it is likely that the landed nobility could influence decisions regarding marriages, it seems unlikely that, once given the concession to marry, the nobility could decide about the level of marital fertility. We argue that, to the extent that we control for the share of married couples and for average age at marriage, the exclusion restriction is satisfied.
Regarding age at marriage, the census provides information on the flow of marriages that were formed between 1816 and 1821. We will use this control variable for the regression of the mean annual fertility rate 1816-21. The number of marriages is provided in three categories: women younger than 30 years of age, between 30 and 45, and older than 45. Our
7 A Prussian Morgen was equal to about 0.25 hectares. 8
measure for age at marriage is constructed as the share of women who married when older than 30 years of age. The variable is thus bounded between zero and one. Between 1816 and 1821, on average, 24 percent of marriages involved women older than 30 years of age.
Table 3 reports IV estimates for both dependent variables. The first-stage estimates confirm the relevance of our instrument. Landownership inequality is significantly negatively correlated with enrolment rates in both specifications. The first-stage partial F-statistics are high, discarding issues of weak instrument. The second-stage estimates show that the negative effect of educational investment on fertility is indeed causal. The effect of educational investment on the average annual fertility rate 1816-21 (column 4) is smaller (and less significant) compared to the effect on the child-woman ratio (column 2). This difference may be due to the strong negative effect of age at marriage on fertility, as later marriage reduces the period in which it is possible to produce offspring.
The effects estimated through IV are larger than the corresponding OLS estimates (Table 2). The direction of the bias is consistent with income being an omitted variable. In fact, in our case, income is only imperfectly proxied by urbanization and the numbers of looms per capita. As a pure income effect is positively related to both education and fertility, the omitted variables bias is likely to bias OLS estimates towards less negative estimates.
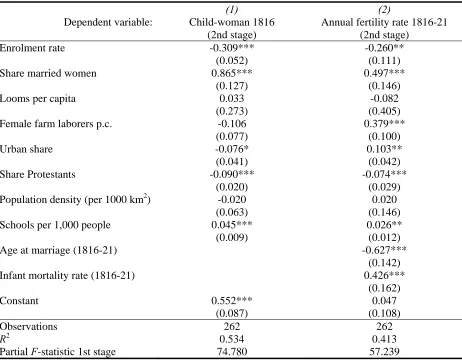
fertility. The estimates of Table 4 show that infant mortality is strongly positively associated with fertility. Yet, the effect of educational investment on fertility keeps its magnitude and, in the case of the average annual fertility rate, it also improves its statistical significance. The same holds true when controlling for the number of school per capita, which is positively related to fertility.
4. Accounting for spatial autocorrelation
When dealing with geographical units of observation, spatial correlation is a potentially important issue. Spatial correlation refers to any systematic pattern in the spatial distribution of a variable. With positive spatial autocorrelation, high or low values of a variable tend to cluster in space; with negative spatial autocorrelation, locations tend to be surrounded by neighbors with very different values (Chi and Zhu, 2008). The standard linear regression model depicted in equation (1) assumes that the error term is independently, identically, and normally distributed. In the presence of spatial correlation, however, the estimated standard errors will be biased, undermining econometric inference (Anselin, 1988).
To account for spatial autocorrelation, the neighborhood structure of each county needs to be established. Using GIS applications, we have geo-referenced the Prussian counties, assigning latitude and longitude coordinates corresponding to county centroids. After assigning a distance threshold value, we obtained a spatial weight matrix W whose elements
ij
w express the extent of spatial interaction between each pair of observations (Anselin and
Hudak, 1992).9
In this section, we estimate two popular models that incorporate different spatial effects: the spatial lag model and the spatial error model. The spatial lag model is specified as follows:
9
u X WF
F =ρ + β+ (2)
where F is fertility, X includes all explanatory variables, ρ denotes the spatial autoregressive parameter, W is the spatial weight matrix, WF the spatially lagged dependent variable, and u denotes the vector of error terms that are independent but not necessarily identically distributed. In spatial lag models, spatial autocorrelation is thus modeled by a linear relation between the dependent variable and the associated spatially lagged variable.
Alternatively, the spatial error model is specified as follows:
ν ε λ ε ε
β+ = +
= X W
F , (3)
where λ denotes the spatial autoregressive parameter and ν denotes a vector of homoskedastic
and uncorrelated errors. In this case, spatial autocorrelation is modeled by an error term and its spatially lagged term. Spatial autocorrelation in errors (i.e. a significant λ) may indicate
that relevant explanatory variables are not included in the model.
Tests of spatial dependence indicate the presence of global spatial autocorrelation both in the form of spatial lag and spatial error.10 Figure 2 shows the Moran scatter plot, which illustrates the relationship between the child-woman ratio 1816 and its corresponding spatially lagged variable.11 Observations are overrepresented in the upper-right and lower-left quadrants of the Moran scatter plot, indicating positive spatial autocorrelation on average: counties with high fertility levels surrounded by high-fertility counties and counties with low fertility levels surrounded by low-fertility counties. Moran’s I, represented by the slope of the regression line, equals 0.486, indicating positive spatial autocorrelation.
10
Detailed results of the tests of spatial dependence are available upon request.
11
Table 5 reports estimation results that account for this spatial autocorrelation, based on the spatial lag model (column 2) and the spatial error model (column 3). For comparison, column 1 replicates the previous OLS estimates. For both models, the null hypotheses (H0: ρ = 0 and
H0: λ= 0, respectively) are rejected, confirming the existence of both forms of spatial
autocorrelation in the regression framework. In particular, the significance of the coefficient λ
suggests the issue of omitted variables, confirming the conclusion of our IV results.
Yet, the results of the spatial regression analyses confirm the qualitative results presented above. There is a statistically significant negative relationship between investment in education and parental fertility, although the magnitude of the association is reduced when accounting for spatial autocorrelation.12
5. Comparison of results between 1816 and 1849
The internal consistency of the data sources and methodologies used in this paper and in the previous work of Becker et al. (2010a) allows us to speculate whether—and to what extent— fertility choices in response to exogenous changes in the cost of education evolved over time. In a specification similar to our IV model, Becker et al. (2010a) found an effect of school enrollment rates on the child-woman ratio in 1849 of -0.557, which exceeds our estimate in 1816 by more than a half. This increase in the estimated effect between 1816 and 1849 might suggest that, ceteris paribus, preferences for offspring quality increased over time.13
Such an interpretation would be consistent with the evolutionary model of Galor and Moav (2002) who argue that the impact of the increase in the demand for human capital on the decline in the number of surviving offspring may have been magnified by cultural evolution in the attitude toward child quality (Galor and Moav, 2005, p. 501).
12
When increasing the distance threshold value, results obtained through OLS and spatial regressions tend to converge.
13 The ceteris paribus condition includes the assumption that the cost of raising a child (regardless of quality)
Economic forces may have acted to reinforce this process. As the fraction of individuals with high valuation for quality increased, technological progress intensified, raising the rate of return to human capital and setting the stage for a more rapid decline in fertility. This increase in preferences for education might have expressed itself with longer stay in school and therefore with higher average years of education, consistent with an increase in average school enrollment visible in the data (Becker et al. 2010c).
Of course, alternative explanations for the difference in the results between 1816 and 1849 could also be relevant. For example, a smaller coefficient in 1816 could also be due to larger measurement error in the 1816 enrolment data. In addition, there is a slight difference in the definition of the dependent variables, with the numerator of the 1849 child-woman ratio being the number of children of ages 0-5, compared to children of ages 0-7 in our 1816 data. More importantly, an increase in the opportunity cost of raising a child would also result in a stronger effect for 1849. Thus, the consistence of the intertemporal comparison with evolutionary models should only be taken as suggestive, rather than definitive. More conclusive empirical evidence on the change of preferences for quality is left to future research.
6. Conclusion
In this paper, we extend the literature on the child quantity-quality trade-off before the demographic transition by analyzing the relationship between educational investment and parental fertility in 1816 Prussia. This study, together with the work of Becker et al. (2010a), falls within a project aimed at testing crucial assumptions of influential unified growth theories and at identifying the economic determinants of fertility in the pre-demographic transition era.14
14
We find that the negative relationship between investment in children’s education and parental fertility is statistically and economically significant already in 1816. The fact that education in 1816 is similarly correlated also with subsequent fertility rates (1816-21) shows that the effect is not due to some random fluctuations in fertility levels but rather mirrors a persistent structural relationship.
Instrumental variables estimates using educational variation deriving from differences in landownership inequality suggest that the effect of educational investments on parental fertility is causal. The IV results also indicate that OLS estimates may be biased towards less negative estimates, probably due to poor income proxies. Furthermore, we found fertility to be spatially autocorrelated. Yet, accounting for spatial autocorrelation both in the form of spatial lag models and spatial error models does not change our qualitative results. The significant negative effect of educational investment on fertility is confirmed, though at a somewhat smaller magnitude.
References
ANSELIN, L. (1988): Spatial Econometrics: Methods and Models, Kluwer Academic
Publishers.
ANSELIN,L. AND S. HUDAK (1992): “Spatial Econometrics in Practice: A Review of Software
Options,” Regional Science and Urban Economics, 22, 509–536.
BECKER, S. O., F. CINNIRELLA, AND L. WOESSMANN (2010a): “The Trade-off between
Fertility and Education: Evidence from before the Demographic Transition,” Journal of Economic Growth, 15, 177–204.
——— (2010b): “Does Parental Education Affect Fertility? Evidence from Pre-Demographic Transition Prussia,” mimeo.
BECKER,S. O.,E. HORNUNG, AND L. WOESSMANN (2010c): “Education and Catch Up in the Industrial Revolution,” American Economic Journal: Macroeconomics, forthcoming.
BECKER,S. O. AND L. WOESSMANN (2008): “Luther and the Girls: Religious Denomination
and the Female Education Gap in 19th Century Prussia,” Scandinavian Journal of Economics, 110, 777–805.
BECKER,S. O. AND L. WOESSMANN (2009): “Was Weber Wrong? A Human Capital Theory
of Protestant Economic History,” Quarterly Journal of Economics, 124, 531–596.
BECKER,S. O. AND L. WOESSMANN (2010): “The Effect of Protestantism on Education before
the Industrialization: Evidence from 1816 Prussia,” Economics Letters, 107, 224–228. BENGTSSON,T. AND M. DRIBE (2006): “Deliberate Control in a Natural Fertility Population:
Southern Sweden, 1766-1864,” Demography, 43, 727–746.
BLEAKLEY, H. AND F. LANGE (2009): “Chronic Disease Burden and the Interaction of
Education, Fertility, and Growth,” Review of Economics and Statistics, 91, 52–65.
BOYER, G. R. AND J. G. WILLIAMSON (1989): “A Quantitative Assessment of the Fertility
BROWN, J. C. AND T. W. GUINNANE (2002): “Fertility Transition in a Rural, Catholic Population: Bavaria, 1880-1910,” Population Studies, 56, 35–49.
——— (2007): “Regions and Time in the European Fertility Transition: Problems in the Princeton Project’s Statistical Methodology,” Economic History Review, 60, 574–595. CERVELLATI,M. AND U. SUNDE (2005): “Human Capital Formation, Life Expectancy, and the
Process of Development,” American Economic Review, 95, 1653–1672.
——— (2007): “Human Capital, Mortality and Fertility: A Unified Theory of the Economic and Demographic Transition,” CEPR Discussion Paper 6384.
CHI, G. AND J. ZHU (2008): “Spatial Regression Models for Demographic Analysis,”
Population Research and Policy Review, 27, 17–42.
CLARK, G. (2007): A Farewell to Alms: A Brief Economic History of the World, Princeton
University Press.
COALE, A. J. AND S. C. WATKINS (1986): The Decline of Fertility in Europe, Princeton
University Press.
CRAFTS, N. F. R. (1989): “Duration of Marriage, Fertility and Women’s Employment
Opportunities in England and Wales in 1911,” Population Studies, 43, 325–335.
DOEPKE,M. (2005): “Child Mortality and Fertility Decline: Does the Barro-Becker Model Fit
the Facts? ” Journal of Population Economics, 18, 337–366.
GALLOWAY,P. R.,E. A.HAMMEL, AND R. D.LEE (1994): “Fertility Decline in Prussia,
1875-1910: A Pooled Cross-Section Time Series Analysis,” Population Studies, 48, 135–158. GALLOWAY,PATRICK,R.,D. LEE,RONALD, AND E. A.HAMMEL (1998): “Urban versus Rural:
Fertility Decline in the Cities and Rural Districts of Prussia, 1875 to 1910,” European Journal of Population, 14, 209–264.
GALOR,O. (2005a): “The Demographic Transition and the Emergence of Sustained Economic
——— (2005b): “From Stagnation to Growth: Unified Growth Theory,” in Handbook of Economic Growth, Volume 1A, Elsevier.
GALOR,O. AND O. MOAV (2002): “Natural Selection and the Origin of Economic Growth,”
Quarterly Journal of Economics, 117, 1133–1191.
——— (2005): “Natural Selection and the Evolution of Life Expectancy,” CEPR Discussion Paper 5373.
GALOR, O., O. MOAV, AND D. VOLLRATH (2009): “Inequality in Land Ownership, the
Emergence of Human-Capital Promoting Institutions and the Great Divergence,” Review of Economic Studies, 76, 143–179.
GALOR, O. AND D. N. WEIL (1999): “From Malthusian Stagnation to Modern Growth,”
American Economic Review, 89, 150–154.
KLEMP, M. P. B. AND J. L. WEISDORF (2010): “The Child Quantity-Quality Trade-Off:
Evidence from the Population History of England”, University of Copenhagen, mimeo. KNODEL,J. E. (1974): The Decline of Fertility in Germany, 1871-1939, Princeton University
Press.
LEE, R. (2003): “The Demographic Transition: Three Centuries of Fundamental Change,”
Journal of Economic Perspectives, 17, 167–190.
MELTON, J. V. H. (1988): Absolutism and the Eighteenth-Century Origins of Compulsory
Schooling in Prussia and Austria, Cambridge University Press.
Tables and Figures
Table 1: Summary statistics
(1) (2) (3) (4)
Mean Std. Dev. Min. Max.
Child-woman ratio 0.882 0.124 0.512 1.365
Annual fertility rate (1816-21) 0.202 0.112 0.050 0.558
Enrolment rate 0.605 0.195 0.027 0.954
Share married women 0.598 0.059 0.362 0.773
Looms per capita 0.009 0.021 0 0.233
Female farm laborers p.c. 0.161 0.061 0.034 0.400
Urban share 0.245 0.158 0 1
Share Protestants 0.610 0.400 0 1
Population density (per km2) 56.199 70.573 10.007 719.297 Landownership inequality 0.017 0.021 0 0.148
Age at marriage (1816-21) 0.241 0.056 0.117 0.416 Schools per 1,000 people 2.028 0.950 0.098 4.862 Infant mortality rate (1816-21) 0.170 0.042 0.107 0.364
Table 2: The association between education and fertility
(1) (2)
Dependent variable: Child-woman ratio 1816 Annual fertility rate 1816-21
Enrolment rate -0.146*** -0.135***
(0.030) (0.037)
Share married women 0.948*** 0.814***
(0.117) (0.134)
Looms per capita -0.208 -0.237
(0.307) (0.401)
Female farm laborers p.c. -0.124 0.244**
(0.087) (0.100)
Urban share -0.104*** 0.090**
(0.039) (0.042)
Share Protestants -0.072*** -0.034*
(0.018) (0.019)
Population density (per 1000 km2) -0.132* -0.086
(0.069) (0.159)
Constant 0.503*** -0.236**
(0.077) (0.092)
Observations 262 262
R2
0.505 0.343
Table 3: The effect of education on fertility—IV approach
(1) (2) (3) (4)
Dependent variable: Enrolment rate 1816 Child-woman 1816 Enrolment rate 1816 Annual fertility rate 1816-21 (1st stage) (2nd stage) (1st stage) (2nd stage)
Enrolment rate -0.340*** -0.220*
(0.079) (0.118)
Landownership inequality -3.495*** -3.371***
(0.450) (0.455)
Share married women -0.942*** 0.742*** -0.831*** 0.489***
(0.187) (0.150) (0.192) (0.162)
Looms per capita -0.743** -0.220 -0.741** -0.198
(0.344) (0.301) (0.356) (0.359)
Female farm laborers p.c. 0.194 -0.120 0.128 0.366***
(0.172) (0.093) (0.167) (0.105)
Urban share -0.197*** -0.164*** -0.201*** 0.063
(0.075) (0.047) (0.075) (0.052)
Share Protestants 0.314*** -0.020 0.330*** -0.048
(0.028) (0.027) (0.032) (0.041)
Population density (per 1000 km2) 0.169 -0.092 0.121 0.030
(0.267) (0.080) (0.280) (0.150)
Age at marriage (1816-21) 0.324 -0.655***
(0.239) (0.145)
Constant 1.052*** 0.723*** 0.909*** 0.156
(0.117) (0.118) (0.151) (0.135)
Observations 262 262 262 262
R2
0.439 0.442 0.444 0.389
Partial F-statistic 1st stage 60.284 54.995
Table 4: The effect of education on fertility—Robustness checks
(1) (2)
Dependent variable: Child-woman 1816 Annual fertility rate 1816-21 (2nd stage) (2nd stage)
Enrolment rate -0.309*** -0.260**
(0.052) (0.111)
Share married women 0.865*** 0.497***
(0.127) (0.146)
Looms per capita 0.033 -0.082
(0.273) (0.405)
Female farm laborers p.c. -0.106 0.379***
(0.077) (0.100)
Urban share -0.076* 0.103**
(0.041) (0.042)
Share Protestants -0.090*** -0.074***
(0.020) (0.029)
Population density (per 1000 km2) -0.020 0.020
(0.063) (0.146)
Schools per 1,000 people 0.045*** 0.026**
(0.009) (0.012)
Age at marriage (1816-21) -0.627***
(0.142)
Infant mortality rate (1816-21) 0.426***
(0.162)
Constant 0.552*** 0.047
(0.087) (0.108)
Observations 262 262
R2
0.534 0.413
Partial F-statistic 1st stage 74.780 57.239
Notes: 2nd stage of 2SLS regressions. Robust standard errors in parentheses. *** p<0.01, ** p<0.05, *
Table 5: Spatial regression analysis
(1) (2) (3)
Model: OLS Spatial lag model Spatial error model
Enrolment rate -0.146*** -0.069** -0.093**
(0.030) (0.027) (0.037)
Share married women 0.948*** 0.689*** 0.795***
(0.117) (0.108) (0.128)
Looms per capita -0.208 0.153 0.126
(0.307) (0.186) (0.174)
Female farm laborers p.c. -0.124 -0.131* -0.110
(0.087) (0.071) (0.086)
Urban share -0.104*** -0.118*** -0.134***
(0.039) (0.033) (0.033)
Share Protestants -0.072*** -0.028* -0.013
(0.018) (0.015) (0.022)
Population density (per 1000 km2) -0.132* -0.157 -0.135*
(0.069) (0.096) (0.076)
Constant 0.503*** 0.054 0.519***
(0.077) (0.086) (0.082)
Rho 0.603***
(0.072)
Lambda 0.786***
(0.070)
Observations 262 262 262
Figure 1: The relationship between child-woman ratio 1816 and annual fertility rate 1816-21
.4
.6
.8
1
1.
2
1.
4
Ch
ild-w
o
m
a
n r
a
ti
o
1
8
1
6
0 .2 .4 .6
Annual fertility rate (1816-21)
Child-woman ratio Fitted values
Figure 2: Moran scatter plot of the child-woman ratio 1816
-2
-1
0
1
2
3
-3 -2 -1 0 1 2 3 4
z
Observed Fitted values
Wz
Child-woman ratio
Moran scatterplot (Moran's I = 0.486)