Optimization of the inbound process at Wavin NL
Dealing with variability from dock to stock
Author: Ing. B. Boeve
Supervisors: Dr. P.C. Schuur Dr. ir. J.M.J. Schutten W. Pranger MBA BSc.
II Author: Ing. B. (Bas) Boeve
University: University of Twente Drienerloolaan 5 7752 NB Enschede
Master program: Industrial Engineering and Management
Specialization: Production and Logistics Management
University supervisors: Dr. P.C. (Peter) Schuur
Faculty of Behavioural Management and Social Sciences
Department Industrial Engineering and Business Information Systems University of Twente
Dr. ir. J.M.J. (Marco) Schutten
Faculty of Behavioural Management and Social Sciences
Department Industrial Engineering and Business Information Systems University of Twente
Company: Wavin Netherlands
J.C. Kellerlaan 3 7772 SG Hardenberg
III
“The most damaging phrase in the language is:
‘we have always done it this way.’”
V
Preface
This thesis is written as final part of the master programme Industrial Engineering and Management, with a specialization in Production and Logistics management at the University of Twente. The subject of the thesis is the optimization of the inbound process at the distribution centre of Wavin, located in Hardenberg.
I thank my supervisors Peter Schuur and Marco Schutten from the University of Twente for their critical feedback during the discussion sessions.
I also thank the employees of Wavin for their information and efforts during the research project. Especially, I thank my supervisor Wim Pranger for giving me the opportunity to do this research project.
Finally, I thank my family for their support during the entire master programme.
Bas Boeve,
VII
Summary
Introduction
Wavin, a manufacturer that produces plastic pipes and fittings, wants to optimize the inbound process at the distribution centre in Hardenberg. When suppliers come to the company in Hardenberg to unload their trucks, the products must be stored in the destined location as soon as possible. Also finished products from Wavin’s factories in Hardenberg need to be in stock quickly. This is essential to survive in today’s competitive market. Delays in the inbound process have consequences on the whole chain. If products are not in stock, orders cannot be picked and trucks cannot be loaded. The transport carrier cannot deliver the products to customers, which leads to a lower service level. This has impact on the turnover of Wavin. This research project provides solutions that help to optimize the inbound process.
Goals and methodology
The goals of this research are to analyse the current performance and to provide improvements that result in an optimization of the inbound process. The main research question is:
How can the inbound process at Wavin be optimized, taking into account staff capacity and available space?
To answer this question and achieve the goals, we first perform a literature review about inbound processes. Through the use of literature we find scientific support about efficient inbound processes, and we find indicators to measure the performance of inbound processes. Besides that, we describe the current situation of the inbound process and we analyse the current performance. After we have identified the problems that result in underperformance of the inbound process, we test several interventions in practice. Moreover, we construct a simulation model to analyse the impact of scheduled deliveries. We use the outcomes of the experiment in practice and the simulation model to give recommendations about improvements that result in an optimization of the inbound process.
Current situation and performance
We divide the inbound process into three main activities: receive, check, and put away. The inbound process begins when trucks arrive at the distribution centre. Trucks are unloaded and products are stored in the receive area. When products are ready to be checked, they are moved to the check area. In the check area products are registered in the ERP-system and checked on quality and quantity. After that, the put away activity starts. The put away activity, and thus also the inbound process, ends when the products are available for order picking.
We focus on the following flows of goods receipt for inside storage, where the numbers in parentheses represent the percentage of the flow:
Finished goods from the production departments in Hardenberg (12%).
Products from other factories of Wavin throughout Europe (52%).
Trade items from external suppliers (23%).
VIII We identify six different problems that result in underperformance of the inbound process:
Problem 1 - Performance monitoring:
There is only one performance indicator that is directly related to the inbound process. This results in a lack of visibility.
Problem 2 - Staff capacity:
There is insufficient staff capacity to perform the inbound process efficiently. Moreover, the capacity of the goods receipt team is not related to the number of incoming products and there is no flexible workforce during peak hours.
Problem 3 - Available space:
There is insufficient space to store all products efficiently before the products are available for order picking. Pallets are moved frequently within the warehouse, resulting in a lot of traffic with forklifts in a confined area. Besides that, inbound deliveries are frequently stored on staging areas, resulting in interaction with outbound deliveries.
Problem 4 - Quality and checking:
The check activity is the most labour intensive activity of the inbound process. Lots of products must be repacked on other pallets due to the warehouse design. Besides that, operators work in the sequence of the order list and this results in much walking time by searching for products.
Problem 5 - From checked to stored:
93% of the products are first stored on an interim storage place after the check activity. Operators have more priority for picking outbound delivery than pallet retrieval. 40% of the products are confirmed on their destined location between 7:00-10:00 PM and this results in long put away times.
Problem 6 - Planning of incoming deliveries:
Although procurement planners try to create a constant workflow for the goods receipt team, the planning of incoming deliveries is not efficient. The deliveries are not based on historical data, or in accordance with the goods receipt team.
Conclusions and recommendations
IX
Number Recommendation Responsibility Already performed?
1 Add one extra operator for the receive activity
Unit leader warehouse Yes
2 Make all operators at the man-up forklifts responsible for the put away activity
Unit leader warehouse
in cooperation with the team leaders
In progress
3 Train operators Unit leader warehouse
in cooperation with the team leaders
In progress
4 Use of performance indicators Logistics manager
in cooperation with IT department
No
5 Reschedule the division of incoming deliveries
Logistics manager in cooperation with Demand & Supply manager
[image:9.595.75.528.71.288.2]No
Table I – Overview of the recommendations
Recommendation 1 - Add one extra operator for the receive activity from 7:30 to 4:00 PM:
The result of this recommendation is that the operators at the check activity do not have to unload trucks anymore and thus handle products faster.An experiment in practice shows that the average number of working days ago that the current batch at the check activity is unloaded, reduced from 2 working days to 1 working day. Besides that, the operators make fewer mistakes when checking products because the operators can focus on one activity.
Recommendation 2 - Make all operators at the man-up forklifts responsible for the put away activity: The result of this recommendation is that the put away time reduced from 5:30:33 to 3:24:49 working hours, a reduction of 2:05:44 working hours. Also, the average ratio of occupied space in the interim storage zone is reduced from 64% to 35%.
Recommendation 3 - Train operators:
The result of this recommendation is that warehouse operators are more flexible in performing warehouse activities. Besides that, the trained operators can replace operators in case of illness/holidays. Trained operators can also help during peak hours or with overwork on Saturday.
Recommendation 4 - Use of performance indicators:
The result of this recommendation is that the inbound process is continuously monitored and the employees can act upon these indicators when problems arise. It is useful for the logistics manager but also for the warehouse operators that are involved with the inbound process.
Recommendation 5 - Reschedule the division of incoming deliveries:
XI
Table of contents
Preface ... V Summary ... VII List of abbreviations ... XV
Introduction ... 1
1 1.1 Background information... 1
1.2 Motivation of the research ... 2
1.3 Scope of the project ... 3
1.4 Research questions... 4
1.5 Research approach ... 5
1.6 Deliverables ... 6
Literature review ... 7
2 2.1 Operations of inbound processes ... 7
2.1.1 Receive ... 8
2.1.2 Check ... 8
2.1.3 Put away ... 9
2.2 Measures of inbound processes ... 10
2.3 Designs of inbound processes ... 11
2.4 Conclusion ... 12
Current situation ... 15
3 3.1 Logistics process and stakeholders ... 15
3.1.1 Demand & Supply department ... 15
3.1.2 Sales & Marketing department ... 16
3.1.3 Logistics department ... 16
3.2 Activities of the goods receipt team ... 19
3.2.1 Receive ... 19
3.2.2 Check ... 19
3.2.3 Put away ... 20
3.3 Largest suppliers ... 22
3.3.1 Internal suppliers ... 23
3.3.2 External suppliers ... 24
3.3.3 Returns ... 24
3.3.4 Own production ... 25
XII
Current performance ... 27
4 4.1 Performance indicators ... 27
4.2 Problems of the inbound process ... 28
4.2.1 Performance monitoring ... 29
4.2.2 Planning of incoming deliveries ... 30
4.2.3 Staff capacity ... 33
4.2.4 Available space ... 34
4.2.5 Quality and checking ... 35
4.2.6 From checked to stored... 36
4.3 Conclusion ... 39
Improvements ... 43
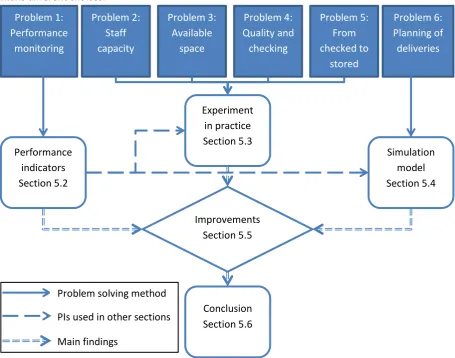
5 5.1 Introduction ... 43
5.2 Performance indicators ... 45
5.2.1 Time indicators ... 46
5.2.2 Productivity indicators... 47
5.2.3 Quality indicators ... 47
5.2.4 Utilization indicators ... 48
5.3 Experiment in practice ... 49
5.3.1 Experimental set-up ... 49
5.3.2 Measurement ... 50
5.3.3 Results of the experiment ... 52
5.4 Simulation model ... 55
5.4.1 Results of the simulation ... 57
5.5 Solving the problems ... 60
5.6 Conclusion ... 66
Conclusions and recommendations ... 69
6 6.1 Conclusions ... 69
6.2 Recommendations... 71
6.3 Further research ... 73
XV
List of abbreviations
Definition Meaning
AS/RS Automated Storage/Retrieval System BPMN Business Process Model, and Notation DFD Data Flow Diagram
DRP Distribution Resource Planning EPC Event-based Process Control ERP Enterprise Resource Planning FIFO First In First Out
MFC Material Flow Control PI Performance Indicator
RFID Radio Frequency IDentification RGA Return Goods Authorization SAP Systems, Applications, and Products
TO Transport Order
UML Unified Modelling Language VAL Value Added Logistics VLM Vertical Lift Module
1
Introduction
1
To obtain a master’s degree in Industrial Engineering and Management at the University of Twente, students have to perform a graduation project. This master thesis describes a graduation project done at the company Wavin in Hardenberg. The research topic is optimization of the inbound process. This chapter introduces the graduation project. First, Section 1.1 describes relevant background information about the company. In Section 1.2 we give the motivation of the research. Section 1.3 describes the scope of the project and in Section 1.4 we provide the research questions. Section 1.5 presents the research approach. Then, we describe the deliverables of the project in Section 1.6.
1.1
Background information
Wavin is a, from origin Dutch, manufacturer that produces plastic pipes and fittings. The name Wavin is derived from the combination WAter and VINyl. The first products that were made by Wavin are Poly Vinyl Chloride (PVC) pipes used for the transportation of water. Wavin is the leading supplier in the field of plastic pipe systems in Europe. The company is founded in the 1950s and has more than 5,000 employees, located in over 25 European countries with annual revenues of around €1.2 billion. Since 2012 the company is part of the Mexichem Group. As part of the Mexichem Group, Wavin maintains an international network beyond Europe. Wavin has a network of approximately 120 agents, licensees, and distributors with representation all over the world (Wavin, 2015).
Wavin Hardenberg, where the graduation project takes place, has around 350 employees. The company in Hardenberg has three different factories:
Injection moulding factory, for example to produce couplers.
Extrusion factory, to produce plastic pipes.
Special products factory, to produce customer specific products such as manholes.
Besides products from the factories in Hardenberg, Wavin completes its portfolio with products from other plants of Wavin (internal suppliers) and trade items from external suppliers throughout Europe. The products are stored either outside or inside the distribution centre in Hardenberg. The largest products such as pipes and manholes are stored outside. These products are resistant to weather conditions.
Other products, mostly small products packed in boxes, are stored inside the building. The warehouse is divided in three different storage locations: a full pallet (bulk) area, a box area, and a piece picking area. A part of the bulk area is fully automated. The bulk area is used to pick full pallets, or for replenishment of the box area and the piece picking area. The box area is used to pick boxes or for replenishment of the piece picking area. The piece picking area is used to pick small quantities.
2
1.2
Motivation of the research
When suppliers come to the company in Hardenberg to unload their trucks, the products must be stored in the destined location as soon as possible. Also finished products from Wavin’s factories in Hardenberg need to be in stock quickly. This is essential to survive in today’s competitive market. Delays in the inbound process have consequences on the whole chain. If products are not in stock, orders cannot be picked and trucks cannot be loaded. The transport carrier cannot deliver the products to customers, which leads to a lower service level. This has impact on the turnover of Wavin.
Wavin indicates different problems in the current inbound process that need to be optimized. Wavin identifies the inbound process as: the process from unloading of the products to confirmed arrival in the destined storage location. This means that the product is available for order picking.
The logistics manager of Wavin states that “with the available process and equipment the goods receipt team is not capable to meet today’s requirements and standards”. He specifies several indicators that can be optimized in the inbound process:
Safety
Within the inbound process there is a lot of traffic in a confined area. The incoming products (mostly pallets) are handled with forklift trucks and are often moved before the products are stored in their destined location. At the same time operators are working on checking, sorting and posting of goods. This is a considerable risk in terms of safety and can lead to accidents with severe injury. Wavin’s sick leave target rate is a maximum of 5% and that is indirectly related to the risk of accidents.
Customer satisfaction
The majority of Wavin’s revenue comes from products of Wavin’s own factories throughout Europe. Wavin completes its portfolio with products from a wide range of vendors. These items are not branded and do not carry a Wavin identification. Customers regard this as a shortcoming. Products without Wavin’s article number can lead to longer lead times because checking, sorting, and posting of goods are more time consuming. This can result in lower service levels.
Productivity and stability of lead times
The lack of flow and control leads to losses such as searching for goods, double handling, long lead times, and mistakes that again result in dissatisfaction of customers. The target for productivity of 8 “picks” per man-hour cannot be reached by the goods receipt team. One pick means a unique product with a given quantity that gets its own destination in one of the storage types. For example: one product stacked on two pallets, results in two picks. Besides the problem of reaching the productivity target, there is a lot of fluctuation in the lead times from dock to stock.
3
1.3
Scope of the project
The project focuses on the inbound operations: receive, check, and put away. The inbound process ends when the products are available for order picking. The pick and pack operations as well as shipping to the customers, are out of scope. Figure 1.1 gives an overview of the different warehouse operations.
Figure 1.1 – Overview of the different warehouse operations
The scope of the research project is the inbound process of products for inside storage, from product arrival to availability for order picking. According to the logistics manager of Wavin, the scope of the research project contains about 80% of the inbound process at Wavin. We analyse the following flows of goods receipt for inside storage that are handled by the goods receipt team:
Finished goods from the production departments in Hardenberg.
Products from factories of Wavin throughout Europe (internal suppliers).
Trade items from external suppliers.
Returns from customers and from depots.
The following flows are out of scope:
Goods receipt of materials such as office supplies and raw materials. Although these materials are handled by the goods receipt team, we do not analyse this flow because these materials are not part of the product portfolio of Wavin.
Finished goods from the injection moulding factory that need to be packed at the packaging line within the goods receipt building. We do not analyse this flow because these finished goods are not handled by the goods receipt team.
The inbound process of products for outside storage. These products are resistant to weather conditions. Most of the products that are stored outside are finished goods from the production departments in Hardenberg. These finished goods are put in stock directly after production and thus do not follow the general inbound process.
Focus
Inbound process Outbound process
4
1.4
Research questions
Based on the indicated problems, the main research question of this project is:
How can the inbound process at Wavin be optimized, taking into account staff capacity and available space?
To answer the main research question we formulate the following sub questions:
1. What has been written in the literature about inbound processes? 1.1. What has been written about operations of inbound processes?
1.2. What has been written about performance indicators for inbound processes? 1.3. What has been written about logistical designs for inbound processes?
2. What is the current situation of the inbound process?
2.1. How is the logistics process organized, and what are the stakeholders? 2.2. What are the activities of the goods receipt team?
2.3. What are the largest suppliers?
3. What is the current performance of the inbound process?
3.1. Which performance indicators are currently in place and measured? 3.2. What are the problems of the inbound process?
4. What can be done to improve the performance of the inbound process? 4.1. Which indicators can be used to measure the performance? 4.2. What can be done to solve the indicated problems?
Figure 1.2 shows the structure of the thesis. The first two sub questions can be executed in parallel and gives a good starting point for answering the third research question: describing the current performance of the inbound process. After that, we describe the improvements. The final chapter gives the conclusions and recommendations.
Figure 1.2 - Structure of the thesis Conclusions &
recommendations Chapter 6
Literature review Chapter 2 Question 1
Current situation Chapter 3 Question 2
Current performance Chapter 4 Question 3
Improvements Chapter 5 Question 4 Introduction
5
1.5
Research approach
There are different strategies and data collection techniques that we use to answer the research questions. Table 1.1 gives an overview of the methods that are used per research question.
Research Question Chapter Monitoring Interviews & conversations
Literature Data analysis
Own ideas
1. Literature review 2 X
2. Current situation 3 X X X
3. Current performance 4 X X X
4. Improvements 5 X X X X X
Table 1.1 – Research framework
Monitoring
It is important to know how the current inbound process is organized. Cooperation with the team on the floor and observations are useful to get knowledge about the process, and helps to indicate problems. Time-laps or process maps are useful to get an overview of the current situation. Previous research and other relevant documentation the inbound process is analysed to gain an overview of the knowledge that is already in place. Besides that, an experiment in practice or a simulation model can be used to monitor interventions.
Interviews & conversations
Interviews with employees that are involved in the project are necessary to specify which problems the different stakeholders have with the current situation. The stakeholder can be the supervisor or employees from the logistics department but also employees from purchasing, planning, or sales. Moreover, input from people who are working on the floor is essential in succeeding the project. Conversations with employees that influence the inbound process direct or indirect are useful to provide improvement steps.
Literature
The aim of the literature review is to find relevant information about inbound processes. Theoretical knowledge is obtained with the use of literature such as books, papers, websites, and previous essays from other students. In this way, the final recommendations have a theoretical argumentation leading to a higher quality of the research.
Data analysis
An in-depth analysis of the available data from the ERP-system is done in this stage. Think of terms such as forecasting, lead times, waiting times, errors, allocation of products, largest suppliers. Through the use of programs such as Excel, Minitab or SPSS several analyses can be done. We analyse also the performance indicators that are currently in place and measured.
Own ideas
6
1.6
Deliverables
This research project provides several deliverables:
Literature review about inbound processes.
Analysis of the current inbound process at the distribution centre of Wavin NL.
Overview with problems that result in underperformance of the inbound process.
Overview with possible improvements.
Recommendations on how to implement the improvements.
Recommendations on performance indicators that can be used.
Recommendations on the division of incoming deliveries.
7
Literature review
2
Chapter 1 describes the motivation of the research and it presents the research questions. This chapter provides relevant literature about inbound processes. Section 2.1 describes literature about the operations of inbound processes. We present different indicators to measure the performance in Section 2.2. We describe available designs of inbound processes in Section 2.3. Section 2.4 provides the conclusions of this chapter.
2.1
Operations of inbound processes
Warehouses are an essential component in almost every supply chain. Inbound operations within warehouses begin with unloading and checking of inbound trailers. When the products are checked, the products can be stored in the warehouse. The outbound operations begin when the products are retrieved, based on a customer order, and assembled for shipment. The final operation is dispatching the goods onto outbound trailers (Buijs, Vis & Carlo, 2014).
Tompkins and Smith (1998) compare the warehouse operations with military life. ‘Hurry up and wait’ is an old army expression that also applies to warehouses. Warehouse managers have to deal with peak conditions and this requires a detailed scheduling of the different activities. The manager must ensure a predictable and even workflow and avoid the ‘hurry up and wait’ scenario. This scenario leads to waste of man-hours and equipment.
Material handling is one of the key factors within warehouses. Goor, Van Amstel, and Van Amstel (1989) define material handling as the internal transport, movement, or the physically shift of materials. Materials could be raw materials, semi-finished products, or finished products. Material handling of raw materials is excluded in this project. Objectives of material handling are:
Maximizing space utilization
Minimizing intern travel distances
Elimination of unnecessary handling
Realizing an efficient flow of goods
Keeping flexibility to deal with changes in the material flow
Minimizing investment costs
New management philosophies such as Just-In-Time and Lean Six Sigma can be useful to achieve shorter response time, better inventory control, and helps to deal with more product variety in warehouse systems. Moreover, the enormous growth of technologies such as radio frequency communications, Warehouse Management Systems (WMS), and bar coding provides possibilities to improve warehouse operations (Gu, Goetschalckx & McGinnis, 2007). It is a challenge for companies to use all this generated data in an efficient way (Khabbazi, Hasan, Sulaiman, Shapi’i & Eskandari, 2013).
8 Gu et al. (2007) categorize the papers about operational warehouse problems within the following topics: receiving and shipping (4), storage (53), and order picking (67), where the numbers in parentheses represent the number of papers as reviewed by Gu et al. (2007). Golovatova and Zhou (2009) conclude that “an enormous gap is still existing between theoretical research and practical operations of incoming goods processes”. One of the reasons that research is mainly focused on storage and order picking is because it has the largest impact on the performance of warehouses.
We divide the inbound operations into three different activities: receive, check, and put away. In Sections 2.1.1, 2.1.2, and 2.1.3 we discuss these activities.
2.1.1 Receive
The receive process is the first activity within warehouse operations and involves an orderly receipt of all materials entering the warehouse. The orderly receipt contains several handlings. Products are unloaded at the dock, and if the delivery is complete the operator signs a transportation document. The operator counts the goods and registers it into the WMS.
Van Den Berg (2007) specifies four order types for incoming goods. Goods ordered from different external suppliers are listed on a purchase order. Finished goods from the production plant are specified on a production order. Goods that are received from another distribution centre or another production plant within the same company are listed on a transfer order. The last source of incoming goods is customer returns. Customer returns is an time-consuming variation of goods receipt that has many potential problems. The first thing is to check if the customer is allowed to return the goods due to the warranty terms and warranty period. In general customers have to apply for a Return Goods Authorization (RGA). If the RGA is approved, the customer receives a RGA number that is registered in the ERP-system (Van Den Berg, 2007). Table 2.1 describes the different order types and the relation with this project.
Order type Source Source within this project (Wavin)
Purchase order Supplier External suppliers
Production order Production plant Extrusion
Injection moulding Special products Transfer order Distribution centre Internal suppliers
Return Goods Authorization (RGA) Customer Returns from customers and depots Table 2.1 - Order types per source
2.1.2 Check
9 Therefore the WMS knows beforehand which orders and deliveries are expected. If the WMS contains this information, the operator can compare the received quantities to the purchase order or receipt advice. Goods arrival without any formal agreement is called a surprise receipt (Frazelle & Frazelle, 2002; Van Den Berg, 2007).
Efficient storage and order picking can only be done when the receive activity and the check activity are managed quite well. A poor inbound process leads to problems in further stages as it is the setup for all other warehouse activities. One of the problems is acceptance of damage. Poor control of damage on incoming products can lead to high expenses. Allowing damaged or incorrect inbound deliveries can lead to damaged or incorrect outbound deliveries. This results in customer dissatisfaction. Quality inspections can be done to avoid these pitfalls. Operators must register an error when products are damaged, missing or do not meet other requirements. Deliveries are usually warranted for a certain period. During this period, e.g. one week, errors in the goods receipt can be claimed from the sender. Clear agreements with suppliers are very important to deal with certain situations. Another difficulty in inbound processes is the variety in pallet sizes and pallet types such as pallets with collars or mesh box pallets. Repacking or restacking of products, or restacking of products onto other pallets is also time-consuming. (Frazelle & Frazelle, 2002; Tompkins & Smith, 1998; Van Den Berg, 2007; Van Vliet, 1998).
Another important task is checking of returns. This must be done structurally. The first checking issue is whether the product is still saleable. Operators must consider if the product can be put in stock again. Products can be incomplete or might be damaged. Mostly, customers send products back to the supplier in reused boxes or with own packaging material. If the product is saleable, the second issue is to determine what additional steps are needed to make them saleable again. Reconditioning can be an example of such an additional step. In the worst case the products must be thrown away. Returns require more handling than other receipts, and the inbound process must include both time and space to handle these returns (Tompkins & Smith, 1998).
2.1.3 Put away
During the put away activity, products are moved to their destined storage location. This can be a bulk area or a piece picking area. A bulk area, also called reserve area, typically contains full pallets. It is customary to pick full pallets or for replenishment of the piece picking area. A piece picking area, also called forward area, contains individual cases and pieces. As the name suggests, the piece picking area is used to pick small quantities.
10
2.2
Measures of inbound processes
The pressure on warehouse operations is to continuously increase productivity and accuracy while reducing costs and inventories, and improve the customer service level (Richards, 2014). Maximizing customer value is the objective of continuous improvement. It is important to first determine what customers define as value. If this is known, maximizing customer value can be done by reducing waste (Malta & Cunha, 2011). Different indicators can be used to identify waste and to measure the performance of inbound processes:
Time
The lead time of the inbound process can be used as a time measure. This is the average lead time from product arrival to availability for picking, also called the dock to stock time (Staudt, Di Mascolo, Alpan & Rodriguez, 2014). The receive, check, and put away activity can also be measured individually to encounter specific problems. The dock to stock time can be calculated as follows. If the sum of the time between the arrival up to product storage is 1000 hours and the number of pallets unloaded is 200, the average dock to stock time is:
1,000 ℎ𝑜𝑢𝑟𝑠
200 𝑝𝑎𝑙𝑙𝑒𝑡𝑠 = 5 ℎ𝑜𝑢𝑟𝑠 𝑝𝑒𝑟 𝑝𝑎𝑙𝑙𝑒𝑡
Productivity
Another useful indicator can be productivity, measured in the number of handled ‘picks’ per man-hour. One pick can be a full pallet or an individual piece that gets its own destination in one of the storage types. The measure of picks per man-hour can also be split up into receive, check, and put away to identify problems in the process. If, in a certain period there are 10,000 picks and 2,000 man-hours involved in the inbound process the average picks per man-hour is:
10,000 𝑝𝑖𝑐𝑘𝑠
2,000 𝑚𝑎𝑛_ℎ𝑜𝑢𝑟𝑠= 5 𝑝𝑖𝑐𝑘𝑠 𝑝𝑒𝑟 𝑚𝑎𝑛_ℎ𝑜𝑢𝑟
Costs
A measure to identify the costs of the inbound process is to multiply the hourly wage by the total man-hours and divide this with the total picks or order lines. Van Vliet (1998) states that the number of order lines is useful because it is more detailed than the number of incoming orders. So if the hourly wage is €35.00 and using the same numbers as the productivity example the result is:
€35.00/𝑚𝑎𝑛_ℎ𝑜𝑢𝑟
5 𝑝𝑖𝑐𝑘𝑠/𝑚𝑎𝑛_ℎ𝑜𝑢𝑟= €7.00 𝑝𝑒𝑟 𝑝𝑖𝑐𝑘
Quality
One of the indicators to measure quality is the percentage of order lines that is handled correctly. Correct could be in the right amount or in the right time if there are appointments about the maximum handling time of checking products.
𝑁𝑢𝑚𝑏𝑒𝑟 𝑜𝑓 𝑖𝑛𝑐𝑜𝑚𝑖𝑛𝑔 𝑜𝑟𝑑𝑒𝑟 𝑙𝑖𝑛𝑒𝑠 ℎ𝑎𝑛𝑑𝑙𝑒𝑑 𝑐𝑜𝑟𝑟𝑒𝑐𝑡𝑙𝑦
11 Another measure is the percentage of delivered goods at the agreed delivery date. With this measure every supplier can be measured on their service rate. Through the use of unique identification labels, scanning pallets is sufficient instead of identifying, counting, and registering the received goods. The frequency of quality checks can be based on the service rate of the supplier. Thus, a supplier with a low service rate is always checked, and a supplier with a high service rate can be checked at random (van den Berg, 2007).
Utilization
Another indicator is a space density factor. This is the percentage of utilized space. This measure can be used for the receive area, check area, or interim storage area to check if additional space is needed (Bozarth & Vilarinho, 2010).
𝑈𝑡𝑖𝑙𝑖𝑧𝑒𝑑 𝑠𝑝𝑎𝑐𝑒 𝑖𝑛 𝑠𝑞𝑢𝑎𝑟𝑒 𝑚𝑒𝑡𝑒𝑟𝑠
𝐴𝑙𝑙𝑜𝑐𝑎𝑡𝑒𝑑 𝑠𝑝𝑎𝑐𝑒 𝑖𝑛 𝑠𝑞𝑢𝑎𝑟𝑒 𝑚𝑒𝑡𝑒𝑟𝑠∗ 100%
Flexibility
The workload of the inbound process usually fluctuates a lot. The way in which these fluctuations are handled is a measure of flexibility. The difference between the average man-hours and the maximum man-hours spent per week in a certain period could be an indicator. Another example could be the percentage of man-hours performed by temporary staff relative to the total man-hours spent in the inbound process (Van Vliet, 1998).
𝑀𝑎𝑛_ℎ𝑜𝑢𝑟𝑠 𝑝𝑒𝑟𝑓𝑜𝑟𝑚𝑒𝑑 𝑏𝑦 𝑡𝑒𝑚𝑝𝑜𝑟𝑎𝑟𝑦 𝑠𝑡𝑎𝑓𝑓
𝑇𝑜𝑡𝑎𝑙 𝑚𝑎𝑛_ℎ𝑜𝑢𝑟𝑠 𝑠𝑝𝑒𝑛𝑡 𝑖𝑛 𝑡ℎ𝑒 𝑖𝑛𝑏𝑜𝑢𝑛𝑑 𝑝𝑟𝑜𝑐𝑒𝑠𝑠∗ 100%
2.3
Designs of inbound processes
The increasing trend of more product variety and short response times leads to pressure on logistics operations. Therefore smooth and efficient logistics operations are needed to deal with this trend. Since logistics costs are an important part of overall production costs, efficient logistics operations plays a role in the competitiveness of a company (Rouwenhorst et al., 2000). The design of inbound processes is part of the logistics operations. The layout of the goods receipt area must be designed efficient to handle goods fast (Goor et al., 1989).
12 Khabbazi, Hasan, Sulaiman, and Shapi’i (2014) check the suitability of the material workflow modelling tools Data Flow Diagram (DFD), Event-based Process Control (EPC), Business Process Model and Notation (BPMN), and Unified Modelling Language (UML) activity diagrams. A workflow of receiving purchased goods in inbound logistics systems is examined. With each modelling tool a process-based workflow model is developed and a UML activity diagram is demonstrated as the best one.
Another thing that is related to logistical designs of inbound processes is the design of the receive area. The design is based on the sequence of handling incoming deliveries in the check activity. Gorter (2015) describes different options to make the delivery day of products that are already unloaded visible. One of them is to put a sticker on the delivery that changes colour after a certain period. This indicates which products should be processed first, based on the preference of the company. When the company decides to handle products on a First In First Out (FIFO) rule an option could be to use FIFO-lanes. This means that deliveries are checked in the sequence of their delivery day. A design of the receive area could be to use two different areas to place products. One area for products that arrived yesterday or earlier, and one area for products that arrive on the present day. The yesterday area must always be empty before processing products from the today area. Drawback of this approach is that at the end of the working day, products that are not handled yet must be moved to the yesterday area. Another option is scanning the tracking number on the waybill of the delivery. This can be used in the WMS to compare the time between a product arrives and the time a product is processed. Companies can use this data to show which products should be processed first.
The characteristics of incoming products such as amount, volume, quality, and packaging material usually change over time. Therefore Golovatova and Zhou (2009) state that the inbound process should be reorganized and restructured timely in order to efficient control the inbound process. Tools such as systematic layout planning or systematic warehouse planning can be used to redesign the layout.
2.4
Conclusion
This section provides short answers on the formulated research questions.
1. What has been written in the literature about inbound processes?
13 1.1. What has been written about operations of inbound processes?
The operations of inbound processes can be divided into three main activities: receive, check, and put away. Larbi et al. (2011) state that companies have “much less information and control on the inbound transportation than on the outbound transportation”. Therefore it is difficult to schedule the staff capacity for inbound operations.
Another thing found in literature is to avoid the ‘hurry up and wait’ scenario: in general warehouses have to deal with high fluctuations in their daily activities (Tompkins & Smith, 1998). This fluctuation must be avoided as much as possible to create a predictable and even workflow, and be able to schedule the capacity of the staff efficiently.
1.2. What has been written about performance indicators for inbound processes?
There are different indicators to measure the performance of the inbound process. The indicators can be divided in the dimensions time, productivity, costs, quality, utilization, and flexibility.
1.3. What has been written about logistical designs for inbound processes?
There is almost no literature available about useful (re)designs of inbound processes. Larbi et al. (2011) provide three transhipment scheduling policies for cross-docking operations under different levels of information of incoming transport: full information, partial information, or no information on the order of arrivals and the contents of inbound trucks. Golovatova and Zhou (2009) state that the inbound process should be reorganized and restructured timely to be able to deal with changes on inbound deliveries.
15
Current situation
3
Chapter 2 describes relevant literature about inbound processes. This chapter describes the current situation of the inbound process at the distribution centre of Wavin. Section 3.1 discusses the logistics processes at Wavin with the different stakeholders that are involved with the inbound process. In Section 3.2 we describe the different activities of the inbound process. Section 3.3 analyses the largest suppliers and Section 3.4 provides the conclusions of this chapter.
3.1
Logistics process and stakeholders
Logistics is an important part within the supply chain of Wavin. Goldsby and Martichenko (2005) state that “there seem to be as many definitions of ‘logistics’ as there are logisticians”. The aim of the logistics department is to serve customers efficiently. Customers want the ordered products in the right time, in the correct quantity, at the right place against the lowest costs (Richards, 2014). The logistics department uses logistics processes to achieve this. The logistics processes are supported by a Warehouse Management System (WMS) that is integrated with the ERP-system SAP. Every movement of a product within the warehouse is monitored in SAP. Scanners and other digital equipment are used to collect this data. The data is used to control the logistics processes and to measure the different performance indicators.
We discuss the logistics process in further detail per stakeholder in Sections 3.1.1, 3.1.2, and 3.1.3. Different stakeholders are involved in the inbound process: Demand & Supply, Sales & Marketing and Logistics. The names of the stakeholders are based on organizational charts of Wavin.
3.1.1 Demand & Supply department
The Demand & Supply department is one of the stakeholders of this project and has different responsibilities (see Figure 3.1). The department is headed by the Demand & Supply manager. Procurement planners use Distribution Resource Planning (DRP) to purchase products. DRP is a method for the planning of orders within a supply chain. Maintaining master data and making detailed schedules for the factories are also tasks of the Demand & Supply department.
Figure 3.1 – Overview of the Demand & Supply department
The team leader of the procurement planners at the Wavin plant in Hardenberg, states that other factories of Wavin schedule deliveries to each other based on a push system. For example: the Wavin company in Poland generates a stock movement to the Netherlands based on different control parameters such as safety stocks. Some of the Wavin factories throughout Europe deliver products to Hardenberg daily. Wavin completes its portfolio with trade items from about 250 external suppliers and a few of them have fixed delivery days. One of the goals of the fixed delivery days is to create a constant workflow for the goods receipt team.
Demand & Supply manager
Procurement planning
Master data management
Detailed scheduling
16 Supplier selection and price negotiations are done by strategic buyers in cooperation with product managers. Strategic buyers and product managers are not under supervision of the Demand & Supply manager.
The relation of the Demand & Supply department with this project is that the department influence the incoming deliveries. If, for example, the minimum stock level of Stock Keeping Units (SKUs) is incremented, deliveries are scheduled to fulfill this change. Therefore it is important to discuss possible changes of deliveries with the goods receipt team, in order to schedule the capacity of the goods receipt team and trying to create a constant workflow.
3.1.2 Sales & Marketing department
This department is supervised by the director of Sales & Marketing. Wavin sells their products in different segments that are divided in: Civil & Infra and Building & Installation. The department coordinates the sales in the different depots and is responsible for marketing within the Netherlands. Figure 3.2 shows the different units of the Sales & Marketing department.
Figure 3.2 – Overview of the Sales & Marketing department
The relation with the project is clear: products must be in stock to sell them. The sales department makes agreements with customers about delivery dates. The sales department assumes that the incoming products are available for picking within 48 hours after arrival at the distribution centre. The back office manager noticed that it is sometimes difficult that products cannot be sent to customers before the products are confirmed on the destined storage location in the warehouse. Employees can make a sales order for products that are already received, but if a material is not confirmed on the destined location yet, the products cannot be sent to the customer. Cross-docking is currently not used at the distribution centre of Wavin.
3.1.3 Logistics department
The logistics department is the main stakeholder of the project and is supervised by the logistics manager. Figure 3.3 shows the organizational chart of the logistics department. After the figure we describe the following four units:
Inside warehouse
Outside warehouse
Process optimization and system support
Distribution planning
The goods receipt team that we describe in this research project is supervised by two team leaders of the inside warehouse.
Director Sales & Marketing
Unit Civil & Infra
Unit Building
17 Figure 3.3 - Overview of the logistics department
Inside warehouse
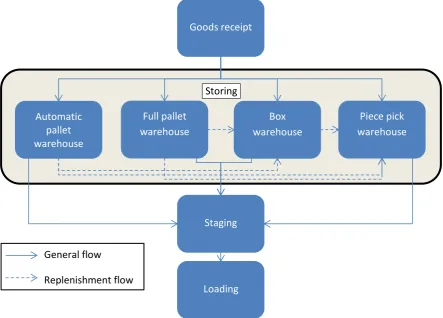
The operators of the inside warehouse are responsible for the distribution of all the products that are stored inside the warehouse. The general steps that a product follows can be divided into: goods receipt, storing, staging, and loading (see Figure 3.4). Section 3.2 discusses the specific activities of the goods receipt step.
Figure 3.4 - Process flow inside warehouse
Logistics manager
Unit leader warehouse
Team leaders inside warehouse
(Goods receipt) Operators
Team leaders outside warehouse
(Goods receipt) Operators
Process optimization
& system support
Distribution planning
Automatic pallet warehouse
Full pallet warehouse
Piece pick warehouse Box
warehouse
Staging
Loading
General flow Replenishment flow
Goods receipt
[image:33.595.78.522.435.753.2]18 Outside warehouse
The process flow for the outside warehouse is almost the same as for the inside warehouse. The main difference is that the products have more volume. The largest surface of the company is used to store these products. This can be manholes, fittings, roles, pipes wound on steel drums, or pipes with a length up to 24 meter. The products are handled by cranes or forklifts. The relation with the project is that some of the products for the outside warehouse are received by the staff of the inside warehouse, mostly products stacked on pallets.
Process optimization and system support
As the name suggests this unit supports the logistics department. The employees of this unit keep track of efficient warehouse processes. They try to develop solutions when operators encounter problems in the logistics processes. Logistics specialists have in-depth knowledge of the process and work on continuous improvement, such as new warehouse layouts, rack designs, and pick strategies. Data analysis, master data management, and keeping track of the different performance indicators are also part of their daily activities.
Distribution planning
The distribution planning unit schedules the transport of goods and prepares work for the warehouse staff in order to efficiently execute the staging and loading step (see Figure 3.4). There are three different delivery types, namely the two days flow, one day flow, and the distribution flow. Orders for the two days flow must be posted before 2:00 PM on working day 1 and are delivered on working day 3 between 7:00 AM and 5:00 PM. Orders for the one day flow must be posted before 11:00 AM and are delivered the next working day. Orders for the distribution flow must be placed before 5:00 PM and will also be delivered the next working day. The distribution flow consists of products with low volumes. Figure 3.5 shows the timeline of the different delivery types. The transportation of the different types is outsourced to third-party logistics providers and the distribution planners are responsible for the contact with these providers. Distribution planners also coordinate the paperwork for the outbound deliveries.
Figure 3.5 - Timeline different outbound deliveries One day flow
Two days flow Distribution flow
Working day 1 (posting day) Working day 2 (delivery day) Working day 3 (delivery day)
19
3.2
Activities of the goods receipt team
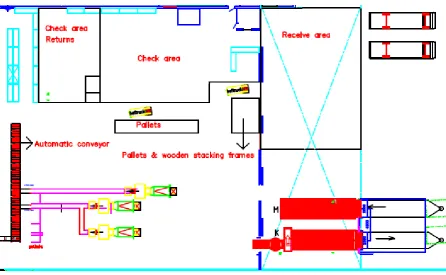
[image:35.595.69.525.186.459.2]The activities of the goods receipt team can be divided into three activities: receive, check, and put away. Figure 3.6 gives an overview of the activities and Appendix A shows the floor map of the inside warehouse. We describe the different activities in Sections 3.2.1, 3.2.2, and 3.2.3. The descriptions are based on observations and describe the general way of working without exceptions. Returns are excluded in order to give a clear description of the activities. Section 3.3.3 describes the handling of returns.
Figure 3.6 - Overview of the different activities
3.2.1 Receive
When trucks come to the company to unload their goods the inbound process begins. The truck driver must have a packing list that must be presented to one of the goods receipt operators. The operator writes the day of delivery on the packing list and stores the packing lists per day. The operator can begin with unloading the truck when the paperwork is right. Unloading of the truck is done by using a forklift. Products are stored on an interim storage place under a shelter roof. The products are most of the time sorted in sequence of unloading. The last unloaded pallet of the delivery is the first pallet that is handled in the check activity. The date of delivery is noted on this last unloaded pallet to get some visibility on the arrival dates.
3.2.2 Check
20 Sometimes there are priority cases due to out of stocks or delayed delivery of products. Also products from own production are checked directly. Based on the order number of the delivery the operator prints a list with information about the ordered products. This list (called GETI-list in SAP) contains information about the delivery such as article numbers, number of products, destined storage types, and storage units. Together with the packing list the GETI-list is used to check the order. Most of the products are packed in boxes and stacked on pallets. There is a lot of variety in pallet sizes and pallet types such as pallets with collars or mesh box pallets. If a pallet is sealed, the plastic is removed for several reasons.
One of the reasons is that products must be repacked on special pallets due to the design of the pallet racking system. This four way entry pallet has a dimension of 800x1,200 millimetres. It is non reversible and open boarded. The difference with a EURO-pallet is that the so called ‘Wavin Hardenberg’ pallet has only bottom deck boards at the short sides of the pallet (see Figure 3.7). EURO-pallets have bottom deck boards at the long sides. Man-up forklifts within the aisles of the warehouse cannot handle these EURO-pallets due to the warehouse design. Pallets are stored in the length and the man-up forklifts can only pick pallets at the pallet opening, the side without bottom deck boards. Unsealing of pallets is also done to check the quality and the number of products. Another reason is that unsealing in this part of the process is the most efficient. It is easier to unseal products on the floor than to unseal it at high rack storage places. Sometimes a pallet collar or tape is needed for stability and safety.
Figure 3.7 - Four way entry pallet with bottom deck boards at the short sides of the pallet
During the check activity the operator also enters data in the ERP-system. The operator enters the date of delivery in the ERP-system that is noted on the packing list. First, the operators perform a “MIGO” booking (goods receipt in the ERP-system) in which the products get a new destination in the data. This is an interim storage location. Based on the information on the GETI-list the operator decides in which storage type the products must be located. Every handling in the ERP-system is called a Transport Order (TO). Some pallets from other factories of Wavin (mostly from Buk Poland) already have a Wavin label that can be scanned. This saves time because most of the data do not have to be entered manually in the ERP-system. If all the data is right, new labels can be printed. These labels are used to transport the products to their destined location. Labels are attached on both short sides of the pallet. A truck lift driver knows to which interim storage place these pallets must be transported. This is the beginning of the put away activity. When the delivery is completely checked, the packing list and the GETI-list are archived and sorted by supplier.
3.2.3 Put away
21 Automatic pallet warehouse (storage type number 150)
The automatic pallet warehouse has 4,231 storage locations and consists of three aisles. A pallet that must be stored in the automatic pallet warehouse is moved from the check area to an automatic conveyer by a fork lift driver. At this point the put away activity is finalized for the operators. The automatic conveyor transports the pallet to the Automated Storage/Retrieval System (AS/RS). The AS/RS picks the pallet and moves it to the destined storage location. Confirmation on location is done automatically. The whole system is connected with the ERP-system by a Material Flow Control (MFC) system.
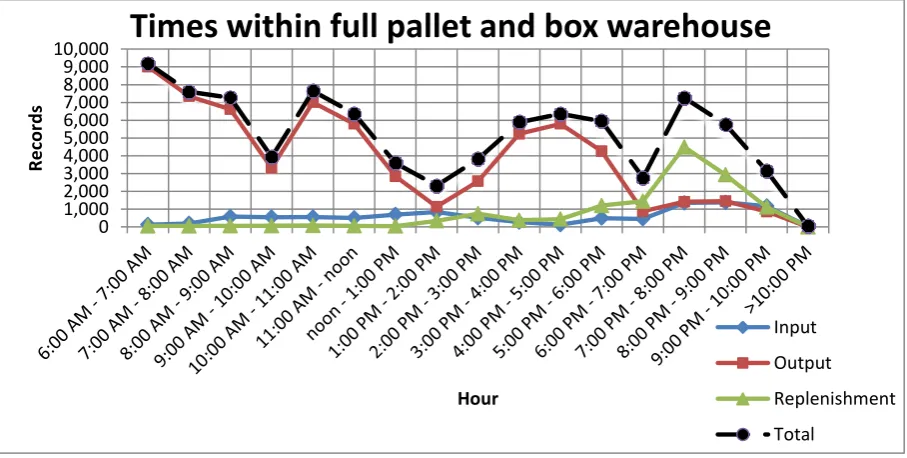
Full pallet warehouse (storage number 152) and box warehouse (storage number 350)
The full pallet warehouse has four aisles and 3,167 storage locations. The box warehouse has ten aisles and 6,147 storage locations. Both storage locations contains of pallet racks. Pallets that must be stored in one of these storage types are moved to an interim storage location. An operator moves the pallet from the check area to this interim storage space with a forklift. The forklift has long forks to move a maximum of 3 pallets in one time. Another warehouse operator brings the pallets to a pick/drop location at the front-end of the right aisle. This movement is more or less done at random because these operators also have other tasks regarding to outbound deliveries.
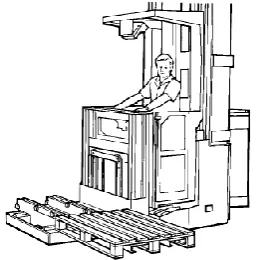
A driver of a man-up forklift picks up the pallet from the pick/drop location and scans the label. The digital equipment shows the destined location of the pallet and the driver moves to this location within the aisle. The driver puts the pallet in place and confirms with a scanner that the pallet is stored on location. The step from the pick/drop point to the destined storage location also involves some randomness. Operators at the man-up forklifts are also responsible for picking products for outbound deliveries. Outbound picking can have more priority than pallet retrieval, resulting in longer lead times of the inbound process. The put away activity is finalized when the products are available for order picking.
Figure 3.8 shows a man-up forklift. The operator’s cab of the man-up forklift is elevated with the forks to improve visibility. The forklifts are able to travel horizontally and vertically simultaneously to a storage location. With the use of these man-up forklifts, aisles can be very narrow because the man-up forklifts do not have to turn in the aisle. Recall that the pallets are stored in the length instead of the width. Narrow aisle racking makes excellent use of floor space and maximizes the height at which products can be stacked.
[image:37.595.71.204.605.735.2]22 Piece pick warehouse (storage number 452)
The piece pick warehouse contains about 4,500 storage locations. Products that must be stored in the piece pick warehouse are moved to an interim storage space. Most of the time, different items are collected on one pallet and an operator moves this pallet from the check area to this interim storage space with a forklift. Products that must be stored in the Vertical Lift Module (VLM) are directly stored by the operator that executes the check activity. An operator of the piece pick warehouse picks up the pallet with a pallet jack and moves the pallet to the piece picking area. The operator scans the barcode of the product and the destination location appears on the screen of the scanner. The operator puts the products in the shelf rack and scans the barcode of the location to confirm that the products are in place. With this confirmation the put away activity is ended.
3.3
Largest suppliers
This section analyses the number of incoming products for a period of three months. The obtained data is used to find the largest suppliers. The analysed period contains 65 working days, 13 full weeks (week 36-48) from Monday 31 August until Sunday 29 November 2015. The period can be seen as a reliable set of data and is confirmed by logistics specialists. The demand in this period is stable without fluctuations due to summer holiday and other non-working days such as Christmas.
The following flows are analysed:
Finished goods from the production departments in Hardenberg except the packaging line of the injection moulding department.
Products from other factories of Wavin throughout Europe (internal suppliers).
Trade items from external suppliers.
Returns from customers and from depots.
The analysis is done for products that go to one of the four inside storage locations:
Automatic pallet warehouse (storage number 150)
Full pallet warehouse (storage number 152)
Box warehouse (storage number 350)
Piece pick warehouse (storage number 452)
The goods receipt team has some other tasks that are not included in this analysis. The goods receipt team checks a part of the orders that must be stored outside, mostly products stacked on pallets. The goods receipt team also handles other incoming goods such as raw materials and office supplies. Sometimes there are trucks that must be sent to other departments. The packaging line is also excluded.
General results
23 Figure 3.9 - Percentages of incoming deliveries
Figure 3.10 shows the percentages of the different storage types. Only 7% of the products that are handled by the goods receipt team are stored in the automatic pallet warehouse. This percentage is low because all the products from the packaging line are stored in this warehouse type. Another reason is the stability of the delivered products. Only pallets stacked with stable products can be stored in the automatic warehouse due to errors in the automatic handling. Half of all records are stored in the box warehouse and 23% of the records in the full pallet warehouse. Thus, 73% of the records (full pallet and box warehouse) are stored on the same interim storage location.
Figure 3.10 – Percentages of storage locations
Sections 3.3.1 to 3.3.4 describe the different incoming flows.
3.3.1 Internal suppliers
52% of the records from the analysis comes from other factories of Wavin throughout Europe. This is a huge number of stock movements under the Wavin flag. The largest internal supplier is the factory in Poland (46% of the records from internal suppliers). Thus, almost a quarter (0.52x0.46x100% = 23.92%) of the records in this analysis comes from one supplier.
52%
23% 13%
12%
Incoming flows
Internal suppliers
External suppliers
Returns
Own production
7%
23%
50% 20%
Storage locations
Automatic pallet warehouse (150)
Full pallet warehouse (152)
Box warehouse (350)
24 Figure 3.11 shows the five largest internal suppliers that deliver the most products to the distribution centre.
Figure 3.11 - Percentage of incoming records from internal suppliers of Wavin
3.3.2 External suppliers
[image:40.595.160.304.489.642.2]23% of the total incoming records comes from external suppliers. In the analysed period, 78 external suppliers have delivered products at least once. Five external suppliers are responsible for 49% of all records from external suppliers (see Figure 3.12). The records from Larcom are outsourced production. It is a Value Added Logistics (VAL) service of own production.
Figure 3.12 - Percentage of incoming records from external suppliers
3.3.3 Returns
Returns can be seen as a different flow of incoming products (13% of all incoming records). Most of the returns are treated by one operator (8 man-hours per day). Checking returns is a labour intensive activity since all returns must be checked on quality. 58% of all returns are actually stock movements from the different depots of Wavin in the Netherlands. Depots sent for example slow movers back.
46%
24% 12%
6% 4%
8%
Largest internal suppliers
Poland (Buk)
Germany (Twist)
Denmark (Hammel)
Italy (Occhiobello)
France (Varennes-sur-Allier)
Others
17%
8%
8%
8%
8% 51%
Largest external suppliers
Nyloplast Europe
AVK Netherlands
Dyka
Larcom (outsourced production)
Akatherm
25 There is some interaction between the goods receipt team and the person that handles the returns. They help each other when it is needed and forklift handlings are intertwined. This operator also handles the returns for a part of the outside warehouse. An important thing to notice is that 61% of the returns get a destination in the piece pick warehouse (see Figure 3.13). The reason is that a return mostly consists of small quantities.
Figure 3.13 – Percentage of storage locations of returns
3.3.4 Own production
12% of all records are finished goods from own production. Recall that most of the finished goods from own production are stored outside and that the packaging line is excluded. This explains the low percentage of 12. Finished products from own production are most of the time checked directly when they arrive at the goods receipt building and thus do not follow the FIFO-rule. This is done because products from own production have short check times.
3.4
Conclusion
This section provides short answers on the formulated research questions.
2. What is the current situation of the inbound process?
There are four different flows of incoming products: finished goods from the production departments in Hardenberg, products from other factories of Wavin throughout Europe, trade items from external suppliers, and returns from customers & depots. The inbound process begins when trucks arrive at the distribution centre. Trucks are unloaded and products are stored in the receive area. When products are ready to be checked, the products are moved from the receive area to the check area. In the check area, products are registered in the ERP-system and checked on quality and quantity. After that, products are moved to their storage destination. The inbound process ends when the products are available for order picking.
2.1. How is the logistics process organized, and what are the stakeholders?
Different stakeholders of the project are: Demand & Supply department, Sales & Marketing department, and the Logistics department. The Demand & Supply department influences the incoming deliveries. Sales & Marketing make agreements about delivery dates with customers and therefore products must be in stock as soon as possible.
61% 38%
1% 0%
Storage locations of returns
Piece pick warehouse (452)
Box warehouse (350)
Full pallet warehouse (152)
26 The Logistics department is the main stakeholder of the project. The general steps that a product follows in the distribution centre are: goods receipt, storing, staging, and loading.
2.2. What are the activities of the goods receipt team?
The activities of the goods receipt team can be divided into three main activities: receive, check, and put away. The goods receipt team is not fully responsible for the put away activity since the products are put in stock by the warehouse team.
2.3. What are the largest suppliers?
Based on an analysis of 13 weeks, week 36-48 in 2015, we conclude the following things for the incoming products of the inside warehouse (recall that the packaging line is excluded in this analysis):
The largest number of incoming products (52%) comes from other factories of Wavin throughout Europe.
23% comes from external suppliers. In total, 78 different external suppliers delivered products in the analysed period.
13% are returns from customers and stock movements from depots.
12% comes from the own production plants in Hardenberg.
The storage locations are: 50% is stored in the box warehouse, 23% in the full pallet warehouse, 20% in the piece pick warehouse, and 7% is stored in the automatic pallet warehouse.