ISSN Online: 2160-889X ISSN Print: 2160-8881
DOI: 10.4236/opj.2019.911015 Nov. 4, 2019 165 Optics and Photonics Journal
Effect of the Illuminating Point Spread Function
and Roughness on the Speckle Correlation Field
Mohamed Mansour El-Nicklawy
1, Amin Fahim Hassan
1, Adel Ebrahim Elmahdy
1*,
Afaf Mahmoud Abd-Rabou
1, Ezzulddin Abdoulsahib Eesee
1,21Department of Physics, Faculty of Science, Helwan University, Cairo, Egypt 2Department of Science, Open Educational College, Baghdad, Iraq
Abstract
Under conditions differing from those subjected for central limit theorem, the spatial autocorrelation function of speckle pattern resulting from illumi-nated rough surface is investigated. Its dependence on different illuminating apertures and the average of the roughness heights is presented theoretically and experimentally. The experiments were carried out using a set of circular and square apertures having different sizes. The results indicate that, increas-ing the size of the illuminatincreas-ing aperture leads to a decrease in the width of the main lobe of the spatial autocorrelation function.
Keywords
Speckle Pattern, Autocorrelation Function, Rough Surface
1. Introduction
As a result of illuminating a rough surface with coherent or partially coherent light, interference between reflected or transmitted waves occurs. Due to the random roughness heights of the surface, the interfering beams are of random phases. This leads to intensities of random values with random spatial distribu-tion called speckle patterns [1] [2] [3]. The statistical properties of laser speckle patterns are of great importance in speckle metrology techniques. These tech-niques are used for solving numerous problems in industry, for example strain measurement, velocity measurement and surface roughness measurement. The speckle correlation is the most important statistical property of the speckle pat-tern. It gives important information about the surface quality of materials and the spatial structure of the surface heights [4] [5] [6] [7]. Many researchers in-How to cite this paper: El-Nicklawy, M.M.,
Hassan, A.F., Elmahdy, A.E., Abd-Rabou, A.M. and Eesee, E.A. (2019) Effect of the Illuminating Point Spread Function and Roughness on the Speckle Correlation Field. Optics and Photonics Journal, 9, 165-177.
https://doi.org/10.4236/opj.2019.911015
Received: September 26, 2019 Accepted: November 1, 2019 Published: November 4, 2019
Copyright © 2019 by author(s) and Scientific Research Publishing Inc. This work is licensed under the Creative Commons Attribution International License (CC BY 4.0).
http://creativecommons.org/licenses/by/4.0/
DOI: 10.4236/opj.2019.911015 166 Optics and Photonics Journal
vestigated the statistical optical properties of fully developed speckle pattern. They considered the random phases of the interfering waves are uniformly dis-tributed in the range from −π to +π and the number of the interfering waves contributing to any point of the observation plane is large enough [1] [8] [9] [10] [11] [12]. N. Yu. Mysina et al. [13] have investigated the optical statistical proper-ties of the speckle fields at two points in the Fraunhofer diffraction region with four different shapes of the scatters apertures. The apertures were square, annular square, triangle and annular triangle. They have shown that the region of the field correlation has considerably larger limits when using annular shape specially the square one. Uno et al. [14] have observed clustering or snake-like appearance when using a ring-slit illuminating a rough surface. In addition, long and ringing tails of the intensity correlation function of the speckle pattern have been ob-served. Asakura et al. [15] have investigated the intensity correlation of the speckle patterns produced by different structure apertures. They were circular, ring-slit, half segment, two-quarter segments, three-sixth segments and four-eighth seg-ments apertures. The results have shown that the spatial distribution of the speckle and its directionality were affected by the structure of the used aperture. Maack et al. [16] have investigated the effect of a reference beam on the spatial frequency spectrum of the speckle field when a rough object is illuminated with a circular aperture. They have found that the ratio of the speckle and the reference intensities control the accuracy of the measurement of the experimental setup.
The majority of the publications in this respect rely on the central limit theo-rem which considers limited conditions on the statistics of the roughness. Under such conditions, the speckle correlation and contrast do not depend on the sta-tistical characteristics of the roughness heights. The present work deals with studying the theoretical and experimental dependence of the statistical proper-ties of laser speckle mainly the autocorrelation function of the speckle fields on the aperture illuminating shape and its dimension as well as the roughness root mean square beyond the conditions of the central limit theorem.
2. Theoretical Background
2.1. Correlation of the Speckle Field
The autocorrelation function between two intensities of speckle fields located at positions r1 and r2 on the observation plane is given from the ensemble average of I(r1) and I(r2) as [1]
(
1, 2)
( ) ( )
1 2I
R r r = I r I r ,
(1)
where denotes the ensemble average.
Under the statistical conditions of the central limit theorem, the autocorrela-tion funcautocorrela-tion according to Goodman [1] can be written as
(
)
( ) ( )
2( ) ( )
2*
1, 2 1 2 1 2
I s
R r r = I r I r = I + A r A r . (2)
DOI: 10.4236/opj.2019.911015 167 Optics and Photonics Journal
r2, respectively. The asterisk denotes the conjugate complex. Considering
( )
1( )
2 sI r = I r = I and
(
)
( ) ( )
*1 2
1, 2
A
s
A r A r r r
I
µ
= , (3)where µA
(
r r1, 2)
is the complex coherence factor of the speckle field, thenEqu-ation (2) can be written as [1] [16]
(
)
2(
(
)
2)
1, 2 1 1, 2
I s A
R r r = I +
µ
r r . (4)In fact µA is the Fourier transform of the intensity distribution of the object
and Is is the average intensity of the speckle pattern.
It is worth noting that Is in Equation (4) obeys according to Goodman [1], the central limit theorem.
Maack et al. [16] restricted his study of speckle correlation on the effect of the illuminating point spread function. It is by considering Is is a constant
number does not depend on the statistical characteristics of the rough surface. To achieve the aim of the present work, the dependence of RI on the root mean square of the roughness heights, we have to consider a formula for Is
depending on such statistical parameters. According to [3], Is is given by
(
)
(
2 2)
1 s
I = +N N N− x +y
γ
,(5)
( )
( ) ( )
(
2)
cos cos d e px 2
x= ϕ =
∫
−∞∞ ϕ P ϕ ϕ= −σϕ ,and y= sin
( )
ϕ =∫
−∞∞sin( ) ( )
ϕ P ϕ ϕd =0.where N is the number of the interfering beams and γ is the mutual degree of
the temporal coherence between the interfering beams. γ tends to one when using monochromatic light. P
( )
ϕ is a Gaussian phase probability densitydis-tribution with zero mean value and σϕ is the root mean square of the random phase (ϕ). It is to be noted that, the statistical conditions of formula (5) do not
obey the limited statistical conditions of the central limit theorem. For formula (4) to be still valid, formula (5) of Is is modified such that it verifies as nearly
as possible the statistical conditions of the central limit theorem. It follows: 1) Is is normalized through dividing it by N
2.
2) let N tends to infinity which is one of the conditions of the central limit theorem.
3) consider σϕ to be of large values which is a second condition of the cen-tral limit theorem.
Noting that a Gaussian distribution of large σϕ approaches to a uniform distribution which is one of the limited conditions. Under such modification we get:
( )
2exp s
I = −
σ
ϕ .DOI: 10.4236/opj.2019.911015 168 Optics and Photonics Journal s
I , RI
(
r r1, 2)
is given by(
)
(
2)
(
(
)
2)
1, 2 exp 2 1 1, 2I A
R r r = −
σ
ϕ +µ
r r(6)
Equation (6) holds only for large values of σϕ. It indicates that, the correla-tion of the speckle field decreases with increasing σϕ.
2.2. Circular and Square Illuminating Apertures
To investigate the effect of the illuminating point spread function, circular and square apertures of various dimensions are chosen. The correlation (RI) of the
speckle field produced when using a circular aperture is given by [14]
(
)
(
)
2 2 1 1 2 2 , 1 I sJ kar f
R r r I
kar f
= +
.
(7)
where 2 2
r= x +y and a is the radius of the aperture, and J1 is the Bessel function of the first kind of order one.
The correlation at the speckle field produced when using a square aperture is given by [13]
(
)
2 2 21 2
sin sin
, 1
I s
R r r I α β
α β
= +
, (8)
where
2
kLx f
α = and
2
kLy f
β = , L is the side length of the square aperture.
(
)
21
2J kar f
kar f and
2 2
sinα sinβ
α β
arise from the diffraction phenomena
of a circular and square apertures, respectively. They are called the intensity point spread functions of the illuminating apertures.
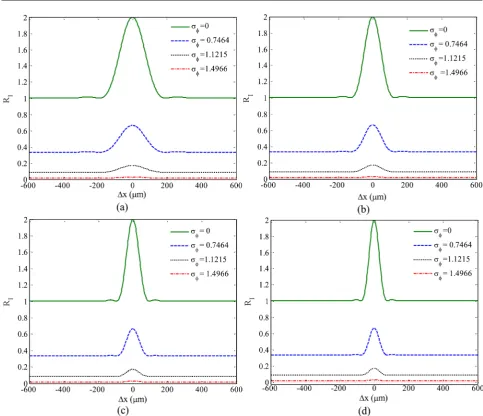
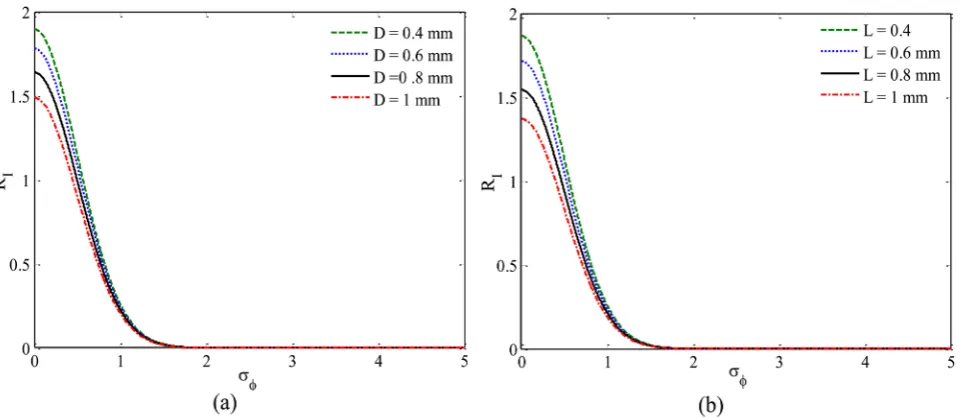
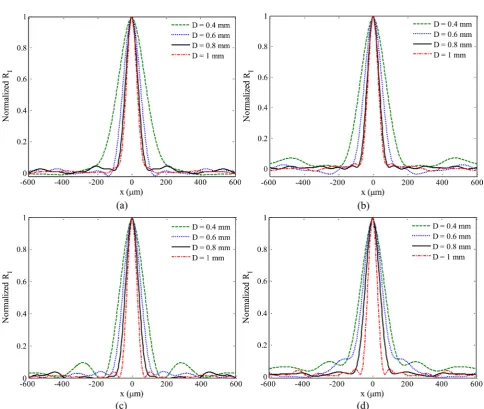
Figures 1(a)-(d) and Figures 2(a)-(d) show the behavior of the speckle cor-relation with the speckle separated distance Δx for circular and square illumi-nating apertures, respectively. The figures are evaluated numerically, for differ-ent values of σϕ, through the theoretical formula given by Equation (6). The figures indicate that the speckle correlation function decreases with increasing both of Δx and σϕ which is directly proportional to the square root of the av-erage of the square heights of the roughness. This is due to the fact that by in-creasing σϕ the phase randomization of the scattered interfering waves in-creases leading to a decrease in the spatial autocorrelation function of the speckle. Figures 3(a)-(d) show the decaying of the speckle correlation at arbi-trary point x = 33 μm on the speckle pattern plane, with increasing σϕ for cir-cular and square illuminating apertures, respectively.
3. Experimental Work
Experimental Setup
DOI: 10.4236/opj.2019.911015 169 Optics and Photonics Journal
DOI: 10.4236/opj.2019.911015 170 Optics and Photonics Journal
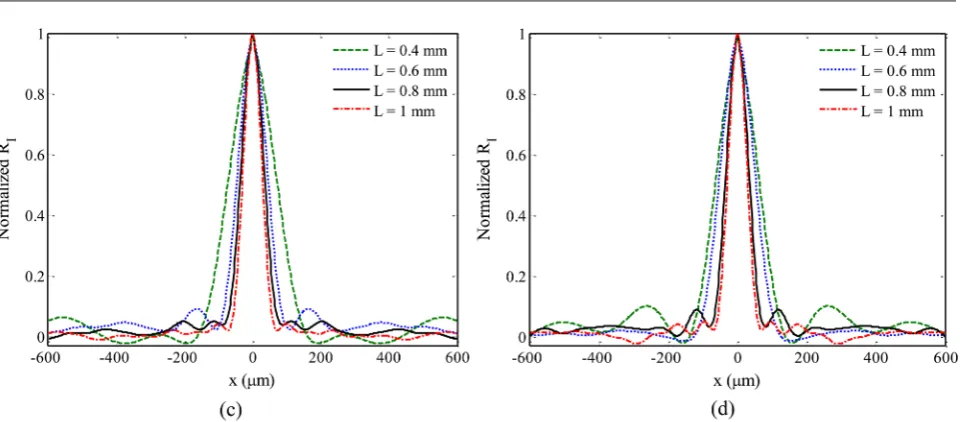
[image:6.595.62.543.312.521.2]Figure 2. The dependence of the autocorrelation function on the separation Δx computed for a square aperture of (a) L = 0.4 mm, (b) L = 0.6 mm, (c) L = 0.8 mm and (d) L = 1 mm.
Figure 3. The dependence of the autocorrelation function on σϕ computed for (a) circular aperture and (b) square aperture
having different dimensions.
[image:6.595.142.449.566.680.2]DOI: 10.4236/opj.2019.911015 171 Optics and Photonics Journal
A He-Ne laser was expanded and collimated by the use of a spatial filter (SF) and a lens (L1). The object consists of a combination of an aperture and different transparent diffusers. Circular and square apertures having different dimensions are used. To obtain an optical Fourier transform, the object has to be located at the front focal plane of the imaging lens (L2) and the CCD Camera is located at the back focal plane of (L2). Speckle patterns are recorded on the CCD Camera (1920 × 2560 pixels, 2.2 μm pixel size, 8 bit).
4. Results
With the aid of the optical setup shown in Figure 4, the speckle interferograms are recorded for different types and dimensions of the illuminating apertures. The autocorrelation function of the field is numerically evaluated according to Winner-Kinchine theory [14] by applying the Fourier transform twice on the speckle recorded intensity.
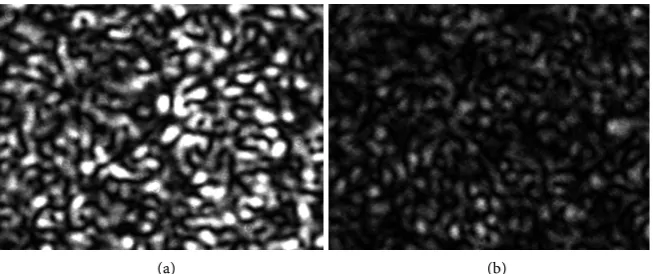
Figure 5(a) & Figure 5(b) represent the speckle patterns for a circular illu-minating aperture of diameter 0.4 mm for transparent rough surface of average roughness heights 1.98 μm and 7.6 μm, respectively. While Figure 6(a) & Figure 6(b) represent the speckle patterns for illuminating aperture of diameter 1 mm for the same rough surfaces.
[image:7.595.212.539.371.508.2](a) (b)
Figure 5. Speckle patterns for circular aperture of diameter 0.4 mm and roughness; (a) Ra = 1.98 μm and (b) Ra = 7.6 μm.
(a) (b)
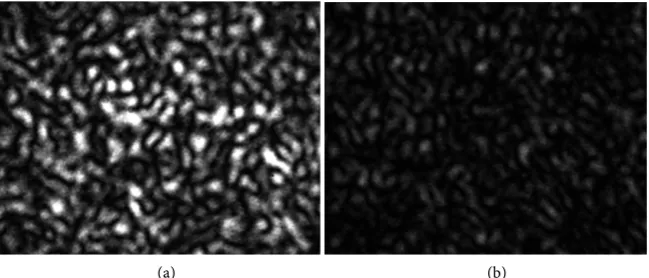
[image:7.595.209.537.551.689.2]DOI: 10.4236/opj.2019.911015 172 Optics and Photonics Journal Figure 7(a) & Figure 7(b) and Figure 8(a) & Figure 8(b) show the speckle patterns for a square aperture of 0.4 and 1 mm side lengths, respectively.
Figures 9(a)-(d) and Figures 10(a)-(d) represent a section profile of the normalized autocorrelation function maps that numerically evaluated through the Fourier transform of the recorded intensities of the speckle patterns when using circular and square apertures, respectively. Each figure is for particular roughness with the dimension of the illuminating aperture as a parameter. The considered average roughness heights are 1.98 μm, 3.8 μm, 5 μm and 7.6 μm and the apertures dimensions are 0.4 mm, 0.6 mm, 0.8 mm and 1mm.
The figures show as expected that the speckle size decrease as the dimension of the aperture increases.
The apparent crowding of the RI curves as the aperture tends to 1 mm is due
to the nonlinear behavior of the Bessel function as well as the Sinc function. Moreover, it is observed that the crowding density increases with increasing the roughness by keeping the dimension of the aperture unchanged. This behavior is due to the relatively greater aperture area that leads to shrinking the illuminating point spread function and thus to RI. This behavior is more pronounced as the
square aperture is considered because of the greater area of the square aperture in comparison with the circular aperture of the same dimension.
[image:8.595.212.537.367.506.2](a) (b)
Figure 7. Speckle patterns for square aperture of side length 0.4 mm and roughness; (a) Ra = 1.98 μm and (b) Ra = 7.6 μm.
[image:8.595.208.537.549.688.2](a) (b)
DOI: 10.4236/opj.2019.911015 173 Optics and Photonics Journal
[image:9.595.56.541.58.467.2]DOI: 10.4236/opj.2019.911015 174 Optics and Photonics Journal
Figure 10. The normalized autocorrelation functions of the experimentally recorded speckle patterns when the rough surface masked with a square aperture with different dimensions for surfaces of average roughness Ra: (a) 1.98 μm, (b) 3.8 μm, (c) 5 μm, (d) 7.6 μm.
Figure 11. The normalized autocorrelation of speckles as a function of (a) the circular aperture diameter D and (b) the square aperture side length L for a fixed separation distance x = 33 μm for different Ra.
As a result, the behavior of the speckle correlation function obtained experi-mentally agrees with that numerically obtained through the theoretical formula given by Equation (6). An important general result indicated theoretically and experimentally is the speckle correlation decreases with increasing the speckle spacing (x).
[image:10.595.59.541.322.512.2]nor-DOI: 10.4236/opj.2019.911015 175 Optics and Photonics Journal
malized autocorrelation function decreases with increasing the aperture sizes and is practically independent of the surface roughness Ra.
5. Discussion
Speckle pattern is a result of two optical phenomena namely interference be-tween scattered waves acquired random phases from a rough surface and dif-fraction due to the illuminating aperture. Thus the speckle intensity arises from spatial intensity of interference pattern modulated by spatial intensity of diffrac-tion pattern.
The correlation between the speckle intensities is basically attributed to those two optical phenomena. The characteristics of the produced random spatial in-terference pattern are referred to the statistical physical conditions of the rough surface, while the modulated factor of the diffraction is attributed to the condi-tions of the imaging system including the shape and dimensions of the illumi-nating aperture. These physical bases of arising speckle correlation lead us to consider the speckle correlation function as a convolution of the two spatial in-tensity distributions of interference and diffraction phenomena. The effect of one of them on the behavior of the speckle correlation function can overcome the effect of the second one depending on the following factors:
1) The phase probability density distribution which is acquired by the scatter-ing waves.
2) The phase correlation function of the roughness and its correlation length. 3) The shape and dimensions of the illuminating aperture and in turn the re-sulting illuminating point spread function of the imaging system.
In general, the correlation between the speckle patterns mainly arises from the correlation between the interfering waves which causing the speckle pattern.
6. Conclusion
DOI: 10.4236/opj.2019.911015 176 Optics and Photonics Journal
Conflicts of Interest
The authors declare no conflicts of interest regarding the publication of this paper.
References
[1] Goodman, J.W. (1975) Statistical Properties of Laser Speckle Patterns. In: Dainty, J.C., Ed., Laser Speckle and Related Phenomena, Springer Verlag, Berlin, 9-74.
https://doi.org/10.1007/BFb0111436
[2] Moustafa, N.A., El-Nicklawy, M.M., Hassan, A.F. and Ibrahim, A.K. (2013) Effect of Partially Coherent Light on the Contrast of Speckle Patterns Obtained Using Digital Image Processing of Speckle Photography. Optics and Photonics Journal, 3, 324-329.
https://doi.org/10.4236/opj.2013.35050
[3] El-Nicklawy, M.M., Abd-Rabou, A.M. and Elmahdy, A.E. (2018) New Analytical Expression for Speckle Contrast of Spectral Light Broadening. Journal of Optics, 20, Article ID: 015602.https://doi.org/10.1088/2040-8986/aa9a1d
[4] Ruffing, B. (1986) Application of Speckle-Correlation Methods to Surface-Roughness Measurement: A Theoretical Study. Journal of the Optical Society of America A, 3, 1297-304.https://doi.org/10.1364/JOSAA.3.001297
[5] Leger, D. and Perrin, J.C. (1976) Real-Time Measurement of Surface Roughness by Correlation of Speckle Patterns. Journal of the Optical Society of America, 66, 1210-1217.https://doi.org/10.1364/JOSA.66.001210
[6] Ruffing, B. and Fleischer, J. (1985) Spectral Correlation of Partially or Fully Devel-oped Speckle Patterns Generated by Rough Surfaces. Journal of the Optical Society of America A, 2, 1637-1643.https://doi.org/10.1364/JOSAA.2.001637
[7] Léger, D., Mathieu, E. and Perrin, J.C. (1975) Optical Surface Roughness Determi-nation Using Speckle Correlation Technique. Applied Optics, 14, 872-877.
https://doi.org/10.1364/AO.14.000872
[8] Ohtsubo, J. and Asakura, T. (1976) Statistical Properties of Speckle Patterns Pro-duced by Coherent Light at the Image and Defocus Planes. Optik, 45, 65-72. [9] Xiang, J.N., Wu, Z.S., Hua, X.X. and Wang, M.J. (2013) Speckle Statistical
Proper-ties of Gaussian Beam from a Semi-Rough Target in the Atmospheric Turbulence. Optik, 124, 6760-6764.https://doi.org/10.1016/j.ijleo.2013.05.081
[10] Wang, Q. (2011) Theoretical Study on the Statistical Properties of Phase Difference between Two Interfering Speckle Fields. Optics Communications, 284, 5233-5239.
https://doi.org/10.1016/j.optcom.2011.07.014
[11] Hinsch, K.D., Fricke-Begemann, T., Gülker, G. and Wolff, K. (2000) Speckle Corre-lation for the Analysis of Random Processes at Rough Surfaces. Optics and Lasers in Engineering, 33, 87-105.https://doi.org/10.1016/S0143-8166(00)00035-X
[12] Freud, I. and Kessler, D.A. (2008) Singularities in Speckled Speckle: Statistics. Op-tics Communications, 281, 5954-5967.
https://doi.org/10.1016/j.optcom.2008.09.029
[13] Mysina, N.Y., Maksimova, L.A., Gorbatenko, B.B. and Ryabukho, V.P. (2015) Spa-tial Correlation and Probability Density Function of the Phase Difference in a De-veloped Speckle-Field: Numerical and Natural Experiments. Quentum Electronics, 45, 979-988.https://doi.org/10.1070/QE2015v045n10ABEH015560
DOI: 10.4236/opj.2019.911015 177 Optics and Photonics Journal
[15] Ibrahim, M., Uozumi, J. and Asakura, T. (1997) On the Generation of Clustered Speckles Due to Ring-Slit Illumination. Optik, 106, 33-41.
[16] Maack, T., Kowarschik, R. and Notni, G. (1998) Effect of the Reference Beam in Speckle Interferometry. Optics Communications,154, 137-144.
https://doi.org/10.1016/S0030-4018(98)00238-7
[17] Ibrahim, M., Uozumi, J. and Asakur, T. (1998) Longitudinal Correlation Properties of Speckles Produced by Ring-Slit Illumination. Optical Review, 5, 129-137.