DOES CEO CULTURAL HERITAGE AFFECT
PERFORMANCE UNDER COMPETITIVE PRESSURE?
*Duc Duy Nguyen
University of St Andrews, The Gateway, St Andrews, KY16 9RJ, UK
Jens Hagendorff
Cardiff University, Aberconway Building, Cardiff, CF10 3EU, UK
Arman Eshraghi
University of Edinburgh, 29 Buccleuch Place, Edinburgh, EH8 9JS, UK
This version: 17 December 2016
Abstract
We exploit variation in cultural heritage across CEOs who are the children or grandchildren of immigrants to demonstrate that the cultural origins of CEOs matter for corporate outcomes. Following shocks to industry competition, firms led by CEOs who are second- or third-generation immigrants are associated with a 6.2% higher profitability than the average firm. This effect weakens over successive immigrant generations and cannot be detected for top executives other than the CEO. Additional analysis attributes this effect to various cultural values that prevail in a CEO’s ancestral country of origin.
JEL Classifications: G30, M14, Z1
Key words: CEOs, Cultural values, Competition, Performance, Corporate investments
Do the cultural values we inherit from our ancestors affect our decision-making in the
present time? A growing literature demonstrates how various characteristics of chief executive
officers (CEO) shape firm outcomes (Bernile, Bhagwat and Rau, 2016; Cronqvist and Yu, 2016;
Dittmar and Duchin, 2016; Schoar and Zuo, 2016). However, this literature faces measurement
challenges when it comes to identifying the impact of a CEO’s cultural heritage. The impact of
culture—irrespective of how defined or measured—is easily confounded with economic and
other institutional factors that, much like culture, can vary across nations.
The empirical setting we use in this paper addresses this measurement challenge. We
hand-collect a novel dataset that tracks the family trees of US CEOs and focus on CEOs who are
the children or grandchildren of immigrants (henceforth Gen2-3 CEOs). While Gen2-3 CEOs are
exposed to the same legal, social and institutional influences as other US-born CEOs, they
possess a cultural heritage that is different from those of other CEOs. Specifically, the cultural
preferences and beliefs of Gen2-3 CEOs are likely to bear the cultural mark of the countries that
their parents or grandparents have emigrated from. In this paper, we test whether the cultural
values prevailing in the country that a Gen2-3 CEO’s ancestors originate from shape firm policy
choices and performance in a changing industry environment.
To study the impact of culture on economic outcomes, it is central to understand how a
person’s cultural values are formed and transmitted. Some studies posit that cultural attitudes
adapt quickly to changes in economic incentives and opportunities. For instance, Gruber and
Hungerman (2008) show that when the opportunity costs of religious participation increase,
church attendance and donations drop sharply. Others argue that cultural values are deeply
rooted and slow moving (Glazer and Moynihan, 1963). For instance, several studies document
subsequent generations (e.g., Fernandez and Fogli, 2009; Giavazzi, Petkov and Schiantarelli,
2015; Guiso, Sapienza and Zingales, 2006). In line with the latter view, our paper documents
distinct behavior among Gen2-3 CEOs and offers an explanation based on cultural heritage.
To identify a CEO’s cultural heritage, we hand-collect data on the country of origin of a
CEO’s ancestors from ancestry.com – the world’s largest genealogy database with access to
almost 17 billion family histories. Our main approach, as described in detail in Section 1.1, maps
out a CEO’s family tree. Specifically, we search for a CEO’s family records to identify
information about their parents which we then use to identify their ancestors. We search census
records, birth and marriage certificates and other publicly available information to accurately
track a CEO’s ancestral history as well as whether s/he is a Gen2-3 CEO. This fine-grained
dataset enables us to construct precise tests of the role of CEO cultural heritage on firm
outcomes.
To identify the effect of CEO’s cultural heritage on firm outcomes, we employ a
methodology similar in spirit to Opler and Titman (1994) and Yonker (2016). Our research
design exploits competitive shocks at industry-level that are unanticipated by both the CEO and
the firm. This allows us to circumvent ambiguity over whether CEOs imprint their preferences
on a firm or whether CEOs and firms match on unobserved factors. The basic idea is that an
industry shock forces the CEO to make decisions to navigate the firm through a changing
industry environment. The ensuing decisions are likely to be complex, non-routine and
unstructured and CEO characteristics therefore likely to be salient in how CEOs respond. If the
cultural heritage of a CEO maters to corporate outcomes, we should observe systematic
post-shock differences across firms led by CEOs with different ancestry.1
Since the banking industry experiences a series of profound shocks to competition in the
1990s, our study focuses on banks. We use the Interstate Banking and Branching Efficiency Act
(IBBEA) of 1994 that legalizes interstate branching across the US and markedly increases
competitive pressures in some US states (see Cornaggia et al., 2015; Rice and Strahan, 2010).
Our identification relies on the staggered (and unanticipated) deregulation of interstate branching
applicable to banks in individual US states. IBBEA therefore introduces substantial variation in
industry competition along both geographical and temporal dimensions.
Our analysis of how a CEO’s cultural heritage shapes firm policy choices and
performance under competitive pressure rests on three main parts. First, we document a
detectable performance effect linked to Gen2-3 CEOs, implying that these CEOs behave
differently from the population of CEOs. Specifically, when competition intensifies, banks led
by Gen2-3 CEOs are associated with a 6.2% higher return on assets compared to an average
bank. Intriguingly, when examining the different generations of immigrants that a CEO belongs
to, we observe a monotonic reduction in bank performance under competitive pressure as we
move from CEOs who are second-generation descendants of immigrants to later generations.
Further, the Gen2-3 effect we document is uniquely linked to the CEO and cannot be detected
for other senior executives, such as the chief financial officer (CFO) or other members of a
bank’s top management team.
Second, we demonstrate that the descendants-of-immigrants effect is rooted in culture
(rather than other characteristics shared by Gen2-3 CEOs). To do so, we trace the performance
effect linked to Gen2-3 CEOs to cultural values that prevail in the country of a CEOs’ ancestors.
Using a broad range of 16 cultural values from Hofstede, Hofstede, and Minkov (2010),
Schwartz (2007), the GLOBE Project, and the World Value Survey (WVS), we find that most
cultural dimensions explain competitive performance.
The cultural values that enter significantly broadly contrast group- vs. self-oriented
cultures and how comfortable members of a culture are with uncertain future outcomes.
Specifically, we find that competitive performance is positively related to the cultural
dimensions Restraint, Long-term Orientation, Uncertainty Avoidance, and Harmony and is
negatively related to Individualism, Performance-orientation, Importance of Freedom,
Intellectual Autonomy, Importance of Selflessness, and Patriotism. Our findings are consistent
with the leadership literature which considers group-mindedness and foresight desirable
managerial traits (e.g., Den Hartog et al., 1999) and links short-termism to unsustainable
investment behavior and poor long-term prospects (e.g., Marginson and McAulay, 2008; Porter,
1992).2 Interestingly, the economic effects that most cultural variables have on competitive
performance are substantially larger than the descendants-of-immigrants effect (Gen2-3). This
confirms our interpretation that culture is the key driver behind the Gen2-3 effects.
In contrast, the cultural dimensions Importance of Income Equality, Humane-orientation,
Trust in Others, Power Distance, and Masculinity do not explain competitive performance.
These dimensions mainly revolve around values reflecting a culture’s attitude towards hierarchy
2 Given the large number of cultural dimensions we examine, interpreting the effects of each individual dimension
vs equality which, intuitively, should be less relevant to strategic decision-making and firm
outcomes (see Judge et al. (2002) for an overview of the traits of effective corporate leaders).
The final set of tests offers direct evidence on the culture-performance nexus. We show
that a CEO’s cultural heritage links to specific bank policy choices. Specifically, we find that
when competition intensifies, banks led by CEOs whose ancestral origins lie in cultures that
emphasize restraint, group-mindedness, uncertainty avoidance and long-term orientation (i)
engage in fewer acquisitions, (ii) realize higher acquisition announcement returns, (iii) display
lower risk, and (iv) are more cost efficient. Since our analysis traces the cultural heritage effects
to more granular policy choices, it further explains why culture matters to performance.
We rule out several alternative interpretations for our findings. First, we address
identification concerns related to endogenous CEO-bank matching. Unobserved firm
heterogeneity may simultaneously explain the matching between banks and Gen2-3 CEOs as
well as bank policies. Our IBBEA identification already partially mitigates this issue. Since
banks will not know ex-ante whether and when a state opens to interstate competition3, they
cannot plausibly appoint CEOs in anticipation of this event. We present two additional tests to
show that endogenous CEO-bank matching is unlikely to drive our results. We first compare
CEOs who assume office at least three years before a state opens for deregulation (these
appointments are plausibly exogenous to performance post-deregulation) with CEOs who
assume office within three years of deregulation. We do not find any difference in the effect of
CEOs on performance depending on how long before IBBEA CEOs were appointed. We then
use a set of exogenous CEO turnovers (arising from CEO death, illness or long-planned
retirements) and confirm that Gen2-3 are linked to an increase in competitive performance.
3 We construct several validation tests to ensure that the IBBEA shock is indeed unforeseen by banks and CEOs. For
Second, deregulation may not affect all banks within the same state uniformly. For
instance, out-of-state banks may be more likely to open new branches in local areas with the
most growth potential, and if banks located in these areas were headed by Gen4+ CEOs, our
results may simply reflect the fact that these banks face stiffer competition. We address this by
showing that our results are robust to controlling for county-year fixed effects. This set-up allows
us to compare banks in the same county and year (which are likely to share the same customer
base, face the same investment cycle and local competition) that are led by CEOs of different
ancestral backgrounds.
Finally, we address concerns that omitted variables at the level of the CEO, bank location
or a CEO’s country of origin explain our results. In additional tests, we control for various CEO
characteristics (including demographic, career history and pay incentives), county-level variables
(population, labor force, income per capita, and religiosity) and institutional and economic
variables in a CEO’s ancestral country of origin (GDP per capita, life expectancy and the legal
system). Our results remain robust to including these controls.
Our paper contributes to several active research areas. First, our paper is related to the
growing literature that studies the impact of CEO attributes on corporate outcomes. Bertrand and
Schoar (2003) identify significant time-invariant ‘managerial styles’ in a range of policy choices.
Various studies have subsequently attempted to explain heterogeneity in managerial styles with
reference to a manager’s physiology (Adams, Keloharju and Knüpfer, 2016), life experiences
(Bernile, Bhagwat and Rau, 2016; Cronqvist and Yu, 2016), or career experience (Custodio and
Metzger, 2013; Dittmar and Duchin, 2016; Schoar and Zuo, 2016). Our findings make an
important contribution to this line of research, because they can be interpreted as evidence
Second, our findings are consistent with the hypothesis that culture is slow moving and
that the effects of cultural heritage are more pervasive than previously reported in a literature that
links cultural heritage to personal choices such as labor force participation or family planning
(e.g., Fernández and Fogli, 2009; Giavazzi, Petkov and Schiantarelli, 2015; Giuliano, 2007). Our
study implies that the effects of cultural heritage go beyond personal decisions and affect entire
organizations through their effects on various firm-level policies.4
Finally, we document distinct behavior among CEOs who are second- and
third-generation immigrants, offer an explanation for this based on cultural heritage and show that this
effect fades away over successive generations. Collectively, our paper therefore offers novel
insights into the formation and persistence of an individual’s cultural preferences (e.g., Bisin and
Verdier, 2000, 2001; Robalino and Robson, 2013).
1. Data and identification
1.1 Bank sample and CEO ancestry information
Our paper studies how a CEO’s cultural heritage shapes the way banks react to the staggered
liberalization of interstate branching since the 1990s. We build a sample of publicly listed US
banks from 1994-2006 by matching data on commercial banks and bank holding company call
reports (forms FFIEC 031/041 and FR Y-9C) with market data from the Center for Research in
Securities Price (CRSP). We choose this sampling period because 1994 is the first year in which
US states were allowed to introduce regulatory barriers to interstate branching and 2006 is one
year after the last regulatory change was enacted. We then complement this sample with data
4 In a related study, Pan, Siegel and Wang (2016) find that uncertainty avoiding CEOs are less likely to undertake
from ExecuComp, BoardEx and Edgar DEF14A forms to retrieve a range of demographic
information on CEOs. This yields a sample of 939 CEOs serving 726 US banks.
To obtain data on the ancestry of CEOs, we proceed as follows. Our main source of
ancestry information are Census Bureau records accessed via ancestry.com, the world’s largest
genealogy database. The exact approach we use to identify ancestral information depends on
when a CEO was born.
Since the latest publicly available Census Bureau records stem from the 1940 census5, we
can retrieve ancestry information for all 209 CEOs born before 1940 directly from census
records. Census records contain detailed demographic information on all members of a
household (including names, birth dates and places of birth). We start by locating a CEO’s
census records to obtain information on their parents (and their respective places of birth). If both
parents are born outside the US, we classify a CEO as a second-generation immigrant from the
country in which their parents were born. If either parent is born in the US, we continue to locate
earlier census records of a CEO’s parents to identify the CEO’s grandparents. If the CEO’s
grandparents are born outside the US, the CEO is classified as a third-generation immigrant from
the country in which his/her grandfather is born. Otherwise, we continue our search using earlier
census records as far back as data availability permits, usually to the mid-19th century.
For the 730 CEOs born after 1940 (about 78% of the sample), we use two approaches to
collect ancestry information. The first approach relies on the fact that since all the parents of
sample CEOs are born before 1940, their census records are accessible. If we know the names of
a CEO’s parents (via ancestry.com or other public sources), we can map out the parents’ family
tree and locate their ancestors using the same technique we use for CEOs born before 1940. To
do this, we search ancestry.com for a CEO’s birth and marriage certificates that occasionally list
the names of parents.6 If we cannot identify a CEOs parents this way, we search a CEO’s
biographies, interviews, or obituaries for information on their parents.
When we cannot identify the parents of a CEO, we use a second approach that lets us
infer ancestry information where this information cannot be directly sourced from census
records. Specifically, we can infer a CEO’s heritage if all families with the same surname as the
CEO and live in the birth county of the CEO have immigrated to the US from the same country
and the same number of generations ago.
The following example illustrates this approach. Say, we search for ancestors of a CEO
with the surname Pantilione who is born in 1945 in Cumberland County, New Jersey7. To do
this, we search Census records for all Pantilione families that live in Cumberland County in
1940. Census records indicate that two families with the surname Pantilione live in Cumberland
County in 1940 and that both families emigrated from Italy at about the same time. Therefore, it
is reasonable to assume that the CEO will be born to one of these two families in 1945 and is of
Italian ancestry.8 Crucially, if we were to discover inconsistencies regarding a CEO’s origins
(e.g., one Pantilione family emigrated from Italy and one from Poland or the families arrived in
the US a different number of generations ago), we remove that CEO from the sample. This way,
we maintain a high level of precision when identifying the cultural heritage of CEOs.
In total, we are able to find ancestry information for 406 out of 730 CEOs born after
1940. Combined with the 209 CEOs born before 1940, this gives us a sample of 615 CEOs. In
6 The level of detail in birth or marriage certificates varies significantly across counties and states.
7 We identify a CEO’s birthplace from various sources, including ancestry.com’s School Yearbooks, Marquis Who’s
Who, NNDB.com, LinkedIn, or through extensive Google searches.
8 This strategy relies on some assumptions. First, the CEO’s family does not move house between 1940 and 1945.
subsequent sections, we expand this detailed collection of ancestry data to other senior
executives to test whether the cultural heritage effects extend to senior executives other than the
CEO.
Throughout the paper, we restrict our sample to CEOs where the paternal and maternal
ancestors originate from the same country and migrate to the US the same number of generations
ago. This ensures that the cultural heritage of CEOs is clearly identifiable. CEOs of mixed
ancestry may have inherited values from either or from both cultures, depending on cultural and
personal factors we cannot observe. Fortunately for our analysis, cross-cultural intermarriages
were not common amongst 20th century immigrants (e.g., Kalmijn, 1999; Pagnini and Morgan,
1990). Fewer than 15% of CEOs are classed as mixed ancestry. In unreported tests, we find that
mixed-ancestry CEOs do not outperform under competitive pressure, consistent with the notion
that these CEOs do not inherit a cultural heritage that is distinct from the CEO population.
A major advantage of our approach is that it provides precise information on the
immigrant generation and origin of a CEO’s ancestors. Several contemporaneous studies (e.g.,
Du, Yu and Yu, 2016; Pan, Siegel and Wang, 2016) rely on surnames to infer ancestral origin
which is a noisier approach. For instance, a person with the surname Welch could come from
Britain, Ireland or Germany. The drawback of targeting such a high level of accuracy in
determining a CEO’s cultural heritage is that we lose 44% post-1940 CEOs whose heritage we
cannot identify precisely. To account for potential self-selection, we base all our regression
models on a standard Heckman two-step procedure (1979). This procedure ensures that our
conclusions regarding CEO heritage and other factors that drive bank performance are not driven
by unobservable factors that make sample inclusion more likely.9
1.2 Identification: Competitive pressures in the US banking sector
To study how a CEO’s cultural heritage effects firm outcomes, we employ a methodology
similar to Opler and Titman (1994) and Yonker (2016). The basic idea is that causality is
identified through a series of unexpected shocks at industry-level that force a CEO to act. Since
the ensuing decisions are non-routine, complex and unstructured, CEO characteristics such as
cultural heritage are likely to be salient in shaping how firms respond to a changing industry
environment.
We use the staggered liberalization of interstate branching in the 1990s, which introduces
an unexpected and significant increase in industry competition at the level of individual states as
shocks that are unanticipated by banks (see Cornaggia et al., 2015). The Interstate Banking and
Branching Efficiency Act (IBBEA) of 1994 allows unrestricted interstate banking and interstate
branching across the US from 1997. IBBEA leads to an exponential growth of banking activities
across state borders. While there are only 64 out-of-state banks in 1994, this number increases to
24,000 by 2005 (Johnson and Rice, 2008).
Our identification strategy relies on a unique feature of IBBEA: the ability of individual
US states to block competition by adopting barriers against deregulation any time between the
passage of IBBEA in September 1994 and its effective date in July 1997. Further, some US
states continue to revise their barriers to interstate branching until 2005, providing further
variation in competitive pressures. The key advantage of our identification is that different states
enact the roadblocks at different points in time thus giving us multiple competitive shocks that
vary across states and time. Further, decisions on interstate branching are made at state level and
cannot be anticipated by individual banks or the CEO. Therefore, IBBEA offers an experimental
setting to gauge how CEOs react to changes in competitive pressures that are exogenous to the
bank that they work for (Rice and Strahan, 2010).
Specifically, IBBEA grants US states the option to: (1) impose a minimum age of three
years on target institutions of interstate acquirers; (2) not to permit de novo interstate branching;
(3) not to permit the acquisition of individual branches by an out-of-state bank; and (4) block
out-of-state banks from acquiring an in-state bank that holds more than 30% of the deposits in
that state. We define a state as competitive if it chooses not to adopt either (3) or (4). This is
because banks can easily circumvent the restrictions on age and de novo interstate branching or
their effects are subsumed to those of (3) and (4) (Johnson and Rice, 2008).10 Appendix 1 lists
changes to interstate branching rules by state and year.
2. Empirical results
2.1 Difference-in-Differences test: Baseline specification
Our empirical strategy adopts a difference-in-differences (DiD) method to analyze how a CEO’s
cultural heritage affects a bank’s reaction to a shock in industry competition. This approach
exploits (1) within-state variation in a CEO’s cultural heritage across banks and (2) across- and
within-state variation in competitive pressures across time.11 The latter is exogenously created by
the adoption of roadblocks to interstate competition permitted under IBBEA (Cornaggia et al.,
2015; Rice and Strahan, 2010). Our main outcome variable is Return on Assets (ROA).12
The following example illustrates our empirical approach. Consider two identical banks –
Bank 1 and Bank 2 – both headquartered in New York in 1996. Bank 1 has a Gen2-3 CEO while
Bank 2 has a Generation4+ CEO. The state of New York decided against adopting roadblocks to
interstate branching on 6 January 1997 exposing both banks to a sudden increase in industry
competition. This allows us to relate post-shock performance differences across these banks to
the cultural heritage of a CEO. In addition, our identification also utilizes Bank 3 and Bank 4,
which are both headquartered in California, one with a Gen2-3 CEO and one with a
Generation4+ CEO. Crucially, California does not experience an increase in competition in
1997. Therefore, Banks 3 and 4 absorb the general economic conditions as well as differences
that are specific to banks led by CEOs of a certain cultural heritage.
We control for several bank and CEO characteristics. First, we control for the size of the
bank using the natural logarithm of the book value of total assets. Since the size distribution of
US banks is highly skewed, we also include its square term, Ln (asset)2, to account for possible
non-linearity between the bank size and performance(see, Ellul and Yerramilli (2013)). Further,
we control for heterogeneity in banks’ balance sheets using the ratios Deposits/Assets,
Loans/Assets and Liabilities/Assets. We use stock volatility to control for bank risk and the
Herfindahl-Hirschman index (HHI) of deposits by state and year to control for state-level
concentration of banking activities. Finally, we control for CEO characteristics by including the
natural logarithm of the CEO age and tenure, as well as their square terms. This is to account for
the non-linearity between CEO career horizons and his/her behavior (see, for instance, Custodio
12 Several recent studies (e.g., Ellul and Yerramilli, 2013) use ROA as a proxy for bank performance. Our results are
and Metzger (2013)). Our result is robust to controlling for several additional measures of CEO
unobserved and observed heterogeneity. Table 1 reports the summary statistics.
[Tables 1 & 2 around here]
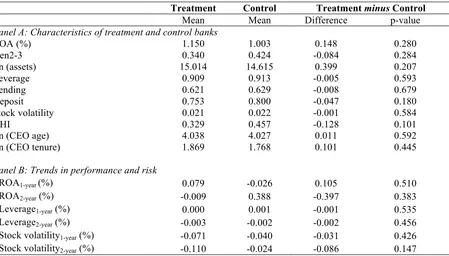
Before conducting our multivariate analysis, we confirm that the assignment of banks to
competitive and non-competitive states is random (as indicated by the two groups not being
significantly different). We compare the characteristics of the treatment group (banks located in
states that eventually liberalize interstate branching) to the control group (banks located in
non-competitive states) in the fiscal year before treatment takes place (i.e. a state liberalizes interstate
branching). Panel A of Table 2 shows that there are no statistically significant differences in
bank performance (ROA), bank risk (measured by stock volatility and leverage) or the
distribution of Gen2-3 CEOs across treatment and control banks. Further, treatment and control
banks are also similar in terms of other key control variables (size, lending, deposit, CEO age
and tenure).
Next, we check whether the parallel assumption holds in our sample of treatment and
control banks. The parallel assumption states that in the absence of treatment (deregulation), the
coefficient on the DiD estimator is zero. Thus, it requires a similar pre-event trend for both
treatment and control groups. Panel B of Table 2 calculates the growth rates in bank profitability
(ROA) and bank risk (leverage and stock volatility) one- and two-years prior to shocks and find
no statistically significant differences between treatment and control banks. This suggests that
the parallel trend assumption is likely to hold. In the multivariate regressions, we further control
2.2 Multivariate results
Next, we perform DiD tests in a multivariate framework. We estimate the following model:
ROAitk = α + β1Gen2-3 CEOit*Competitive statetk + β2Gen2-3 CEOit + β3Competitive statetk + Controls + Fixed effects + εitk (1)
where t indexes time, i indexes banks and k indexes US states. The dependent variable is ROA.
Competitive state is a dummy that equals 1 if the state does not block key dimensions of
interstate branching between 1994 and 2005 under powers granted following the passage of
IBBEA (see Section 1.2 for more details on those powers). Our coefficient of interest is the
interaction term β1 that tells us how the profitability of banks with Gen2-3 and Gen4+ CEOs differs under the two different competitive regimes.
Our controls include bank and CEO characteristics as described in Section 2.1. We also
control for Gen1 (i.e., foreign-born) CEO to ensure that the coefficients on Gen2-3 estimate the
performance difference of second and third generation immigrants relative to later generation
immigrants. Various types of fixed effects are included in the models (such as firm, state-year
trends, and county-year fixed effects). We also account for the interactive effects of regulatory
changes on bank performance by including interaction terms between competitive state and all
controls in our model.13 Standard errors are double-clustered by bank and year to account for
temporal and cross-sectional correlation (Petersen, 2009).
Table 3 indicates that Gen2-3 CEOs exert a detectable performance difference relative to
other CEOs, implying that these CEOs behave differently from the CEO population. The
interaction term between Gen2-3 CEO and competitive state is positive and statistically
significant at the 1% level. When competition increases, banks led by CEOs who are the children
or grandchildren of immigrants exhibit a 6.2% increase in ROA compared to an average CEO.
The magnitude of Gen2-3 is therefore higher than that of important controls such as deposit
funding or state-level (HHI) competition (each about 3%). Further, the economic magnitudes
become even more pronounced when we link specific cultural dimensions directly to
performance in the sections below.
[Table 3 around here]
In contrast, the coefficient on Gen2-3 is negative and significant. While an F-test in Panel
B confirms that the net effect of Gen2-3 CEOs under competitive pressure is indeed positive and
statistically significant, our results suggest that the qualities of Gen2-3 CEOs that link to superior
performance when state-level competition increases also link to underperformance under less
competitive market conditions. We revisit this finding later and explain it based on the cultural
values that prevail in the CEO’s ancestral country of origin.
Our findings hold under different fixed effect models. We sequentially add: state and year
fixed effects (column 1), state-year fixed effects (column 2) to absorb all variables that do not
vary across banks within a given state and year (e.g., investment opportunities or business
cycles), state-year trend fixed effects (column 3) to control for pre-trends in the data, county-year
fixed effects (column 4) to control for within-state omitted factors, and firm fixed effects
(column 5) to control for time-invariant firm-specific factors. Finally, column (6) replicates the
model in column (1) but excludes the inverse Mills ratio.
2.3 Inter-generational transmission of culture
We next analyze whether the effect that CEOs have on performance varies according to how
the values of successive generations of immigrants slowly converge to US values (see, for
example, Giavazzi, Petkov and Schiantarelli, 2015). This suggests that the effects we document
above should be stronger for more recent generations of immigrants compared with earlier
generations immigrants. Table 4 reports the results.
[Table 4 around here]
In line with this expectation, we observe a monotonic decline in the magnitude of the
effect that CEOs have on performance when moving from first-generation to fourth-generation
immigrant CEOs. While Gen1, Gen2, and Gen3 CEOs are associated with a significant and
positive performance under pressure, the coefficient estimate for Gen1 CEOs is larger than that
of Gen2, which in turn is larger than that of Gen3 CEOs.14 This positive performance effect
disappears when we examine Gen4 CEOs. Thus, distinct ancestry effects are only detectable for
CEOs for up to three generations.
2.4 The cultural heritage of non-CEO top executives
In this section, we examine whether the performance effect linked to Gen2-3 CEOs extends
beyond the CEO. Recent studies show that top executives other than the CEO matter for some
firm outcomes. For instance, Dittmar and Duchin (2016) find that the professional experience of
the CEO and the CFO each have distinct effects on a firm’s financial policies. Pan, Siegel and
Wang (2016) document commonalities in the risk attitudes of a firm’s top management team and
show that risk attitudes within the top management team shape a firm’s risk taking.
14 We are cautious when interpreting the positive coefficient on Gen1 CEOs as capturing cultural heritage. Since
To test whether the cultural heritage of non-CEO top executives explains how banks react
to an increase in competition, we collect data on the cultural heritage of the four highest paid
non-CEO executives across all banks.We obtain the name, age, tenure and total compensation
from ExecuComp (for S&P 1500 banks) and from Edgar DEF14A forms (for smaller banks).15
To identify the ancestral heritage of non-CEO top executives, we employ the same data
collection approach we use for CEOs (see Section 1.1). In total, we are able to locate ancestry
information for 2,462 out of 3,416 executives who are in office between 1994 and 2006.
[Table 5 around here]
Our regression specifications focus on three groups of non-CEO executives: (1) The
second-highest paid executive; (2) the CFO, and (3) the team of the four most highly paid
non-CEO executives. We use the same DiD approach with identical controls as in equation (1). Table
5 reports the results. Columns (1)-(3) control for ancestry information on non-CEO executives,
while columns (4)-(6) control for ancestry information on CEOs and non-CEO executives
simultaneously.
As shown in Table 5, the interaction terms between Gen2-3 and any of the groups of
non-CEO executives we analyze do not enter significantly. Crucially, Gen2-3 non-CEOs continue to be
significantly associated with higher competitive performance after we control for the ancestry
information of non-CEO executives. Overall, our results buttress the view that because CEOs are
the most important decision-maker in a bank, their cultural heritage exerts a detectable effect on
bank performance in how banks respond to a changing industry environment. No such effects are
detectable for other senior executives.16
3. The impact of CEO cultural values on firm performance
The previous sections show that Gen2-3 CEOs behave differently from the general population of
CEOs and that this effect varies across immigrant generations. To demonstrate that the
descendants-of-immigrants effects are due to culture, rather than other characteristics shared by
Gen2-3 CEOs, this section traces the performance effect linked to Gen2-3 CEOs back to specific
cultural values that prevail in the country of a CEOs’ ancestors.
3.1 Cultural values
We obtain cultural variables from four prominent cultural databases: Hofstede, Schwartz, the
GLOBE Project, and the World Value Survey. In total, we collect data for 16 cultural variables.
Arguably, any selection of individual cultural variables remains arbitrary to some extent.
However, our approach of collecting a relatively large number of cultural variables from
different sources is designed to minimize the effects that arbitrary choices linked to any
individual cultural index may have on our conclusions.
We start with the cultural variables identified by Geert Hofstede, because this framework
has been widely applied across many disciplines. We use all six Hofstede dimensions: Power
Distance indicates the importance of hierarchy in a culture, Individualism vs Collectivism reflects
the integration of individuals in groups, Uncertainty Avoidance is the extent to which individuals
are not comfortable with unpredictability and ambiguity, Masculinity vs Femininity describes
16 Our findings do not rule out that the cultural heritage of non-CEO executives may shape decision-making in their
‘tough versus tender’ cultures, Long-term vs Short-term Orientation is related to (short term)
normative versus (long term) pragmatic cultures, and Restraint vs Indulgence reflects the extent
to which members of a society try to control their desires and impulses.
Despite its popularity, Hofstede’s framework faces criticisms notably for its reliance on
theoretical reasoning to construct a relatively low number of cultural dimensions (see Karolyi
(2016) for a critical review of the key databases used to proxy cultural values). Therefore, we
complement Hofstede’s cultural dimensions with additional cultural variables not captured in
Hofstede’s framework.17
We first consider the cultural variables developed by Schwartz (2007) who derives three
broad measures of societal traits based on extensive interviews conducted between 1988 and
2004. While many of the Schwartz spectra are similar to Hofstede’s dimensions, two Schwartz
variables capture additional cultural attributes which we include in our analysis: Intellectual
Autonomy vs Embeddedness reflects the freedom to pursue one’s own thoughts and ideas, and
Harmony vs Mastery captures the degree to which members of a society are uncomfortable with
confrontation and assertiveness.
We then add cultural variables from GLOBE.18 Since seven out of nine of GLOBE’s
cultural dimensions overlap with dimensions already included, we add the two dimensions that
capture additional cultural attributes: Humane-orientation, which reflects the extent to which a
society encourages individuals to be altruistic, generous and kind to others, and
Performance-orientation, which reflects the extent to which a society encourages and rewards performance.
17 In unreported tests, we also contrast cultural dimensions where Hofstede and other dimensions directly overlap
Our final source of cultural variables is the World Value Survey (WVS). There are six
waves of surveys since 1981, and the most recent 2012 survey includes 258 items on various
topics including perceptions of life, work, politics and society. Given the comprehensive nature
of the survey, we start with the 14 WVS items that Karolyi (2016) identifies as particularly
relevant for finance research and select six items that capture attributes not already captured by
other cultural dimensions in our analysis: Trust in Others, Importance of Freedom, Importance
of Selflessness, Importance of Income Equality, Importance of Self-respect, and Patriotism.
3.2 Cultural values and competitive performance
To examine how the 16 cultural dimensions we collect explain competitive performance, we first
scale each dimension to a range between 0 and 1. We then assign cultural values to CEOs
according to their ancestral background.19 We sequentially relate each cultural dimension to bank
performance under competitive pressure by running the following model:
ROAitk = α + β1Cultural dimensionit*Competitive statetk + β2Cultural dimensionit + β3 Competitive statetk + Controls + Fixed effects + εitk (2)
where i indexes bank, t indexes time and k indexes US states. We include similar controls to
those in equation (1) and use State-year fixed effects in all specifications.
Table 6 displays the results for each of the 16 cultural dimensions. Each row presents the
results of a regression based on a different cultural dimension. For ease of presentation, we only
show the coefficients on the interaction between the cultural dimension and the state-level
competition indicator (β1) and its constituent variables (β2, β3). Our main coefficient of interest is
19 For example, if a CEO has ancestors coming from Germany, s/he will be assigned a Power Distance score of 0.35,
β1 which tells us how the profitability of banks led by CEOs with different cultural values differs by competitive regime.
[Table 6 around here]
The results show that most (10 out of 16) of the cultural variables significantly affect
competitive performance. On a broad level, this confirms our interpretation that the performance
effect linked to Gen2-3 CEOs is indeed rooted in culture. More specifically, we find that
competitive performance is positively related to the dimensions of Restraint, Long-term
Orientation, Uncertainty Avoidance, and Harmony. In contrast, performance is negatively related
to the dimensions of Individualism, Performance-orientation, Importance of Freedom,
Intellectual Autonomy, Importance of Selflessness and Patriotism.
In general terms, the cultural values that enter significantly appear to broadly contrast
group- vs. self-oriented cultures and cultures reflecting how comfortable one is with uncertain
future outcomes. Specifically, CEOs whose ancestral origins lie in cultures that emphasize
restraint, group-mindedness, uncertainty avoidance, and long-term orientation are associated
with positive performance effects while a cultural heritage that values personal achievements,
self-reliance and believes success is down to individual ability is linked to underperformance
following a competitive shock.
These findings are broadly in line with the leadership and strategy literature. For instance,
Den Hartog et al. (1999) conduct a large multi-country survey of middle managers to describe
leader attributes and behavior that is linked to effective leadership. Their results show that
managerial attributes such as group-mindedness and foresight are widely endorsed as
managerial attribute that is linked to unsustainable investment behavior and poor long-term
prospects (e.g., Marginson and McAulay, 2008; Porter, 1992).
The cultural dimensions that do not explain competitive performance are Importance of
Income Equality, Importance of Self-respect, Humane-orientation, Trust in Others, Power
Distance, and Masculinity. These dimensions mainly revolve around values that reflect a
culture’s attitudes towards hierarchy vs equality which, intuitively, should be less relevant to
strategic decision-making and, by extension, firm outcomes. Consistent with this, Judge et al.
(2002) conduct an extensive qualitative review and a meta-analysis of research into the
personality traits of outstanding corporate leaders and do not list attitudes towards hierarchy
amongst the traits of effective leaders.
The effects of individual cultural values on performance are economically meaningful.
For instance, a one-standard deviation increase in Uncertainty Avoidance increases competitive
performance by 9.4%, while a one-standard deviation increase in Individualism decreases
competitive performance by 18.3%. Interestingly, the economic magnitudes of most cultural
variables are substantially larger than the descendants-of-immigrants effect (Gen2-3 CEOs) on
competitive performance. This confirms our interpretation that culture is the key driver behind
the Gen2-3 effects.
In Section 4 below, we analyze how a CEO’s cultural heritage affects firm policies under
competitive pressure.However, given the large number of cultural variables and firm policies we
analyze, demonstrating how each dimension affects a particular policy becomes a complex
undertaking. Furthermore, the results in Table 6 suggest that some individual cultural dimensions
cluster around more general characteristics of national cultures (e.g., whether a culture is group-
more general sets of cultural characteristics and analyze which sets of cultural characteristics are
relevant for performance and firm policy choices.
3.3. Factor analysis: CEO factor scores and performance
Factor analysis is a popular approach to summarize multifaceted personal characteristics such as
abilities or skills (e.g., Adams, Akyol and Verwijmeren, 2016; Kaplan, Klebanov, and Sorenson,
2012; Kaplan and Sorenson, 2016). Factor analysis captures the variability among the 16 cultural
variables and reduces them to a lower number of factors that describe characteristics that tend to
vary together.
[Table 7 around here]
Our analysis extracts three main factors.20 Panel A of Table 7 shows the three factors and
how they load on individual cultural variables. Factor 1 captures most (54%) of the variation in
cultural values. Factor 1 shows high positive loadings on Individualism,
Performance-orientation, and Importance of Freedom and high negative loadings on Restraint, Long-term
Orientation, Uncertainty Avoidance, and Harmony.21 Factor 1 therefore describes a person who
values personal achievements, self-reliance and believes success is down to individual ability (in
contrast to a person who emphasizes restraint, group-mindedness, uncertainty avoidance and a
long-term orientation).
The second and third factors have significantly lower explanatory power and account for
17% and 9% of the variation in the cultural dimensions, respectively. Factor 2 loads positively
on Importance of Income Equality, Humane-orientation, and Trust in Others and negatively on
Power Distance. As such, Factor 2 seems to contrast equality with hierarchical values. Finally,
Factor 3 loads positively on Masculinity and Intellectual Autonomy. Factor 3, thus, combines
assertiveness and autonomy of thought.
Before proceeding with our analysis of how culture affects firm policies in Section 4, we
first confirm that the three factors explain competitive performance in a way that is broadly
consistent with the previous results based on the 16 individual cultural dimensions (Table 6). We
obtain the scores for each factor22 and then regress these on ROA using our previous DiD
approach with identical controls as in equation (1).
Panel B of Table 7 shows that Factor 1 is negatively related to performance under
competitive pressure.That is, banks led by CEOs whose ancestral origins lie in cultures that
value self-reliance and individual achievement are associated with lower performance. By the
same token, this implies that CEOs whose ancestral origins lie in cultures that emphasize
restraint, group-mindedness, uncertainty avoidance, and long-term orientation are associated
with positive performance effects. This is broadly consistent with the results on the individual
dimensions reported in Table 6.23 In contrast, Factors 2 and 3 are not related to competitive
performance. This is also consistent with the results in Table 6 which show that many of the
cultural variables embedded in Factors 2 and 3 (e.g., Masculinity, Power Distance, etc.) do not
have measurable performance effects.
22 Component scores are calculated using all the cultural variables with their weights based on the component
loadings.
23Interestingly, the coefficient on Factor 1 is positive and significant. This indicates that the set of cultural values
Between them, the three factors therefore identify performance-relevant sets of cultural
values. In the next section, we use the three factors to study how the cultural value sets affect a
firm’s policy choices.
4. Why cultural heritage affects performance: CEO factor scores and firm policy choices
This section sheds light on the economic mechanisms underlying our results by studying how a
CEO’s cultural heritage affects firm policies under competitive pressure.We regress the three
factors estimated above on specific bank policies in the same DiD setting as before.We focus on
three bank policies into which CEOs have major input and which parsimoniously capture some
of the key challenges faced by banks during an episode of deregulation: expansion via
acquisitions, risk-taking, and cost-efficiency.
First, we examine how a CEO’s cultural heritage affects a bank’s propensity to engage in
acquisitions as well as the expected performance effects of these acquisitions. For instance,
banks may react to increased competition by acquiring competitors, and many of these deals may
turn out to be value-destroying for shareholders of the acquiring bank (e.g., Schoenberg and
Reeves, 1999). We study a bank’s acquisition propensity by running a regression on the number
of deals announced in a given year. We study acquisition performance by estimating the
cumulative abnormal returns (CARs) over a 5-day [-2, +2] event window surrounding the merger
announcement.24
Second, the ability of banks to manage portfolio and financing risks effectively is an
important driver of their performance. Particularly during periods of deregulation, some CEOs
24 We focus on M&A deals that are publicly announced between 1994 and 2006 by US banks. We obtain data on
may pursue overly risky strategies that could lead to underperformance. We use stock return
volatility as a proxy for bank risk-taking. Finally, some banks may enjoy a higher level of
profitability because they cut costs when competition intensifies. To proxy for cost-efficiency,
we measure a bank’s total expenses scaled by income. Lower values of this ratio indicate more
economical use of expenses to produce a given level of income.
Table 8 reports our results. Panel A examines acquisition propensity, Panel B acquisition
performance, Panel C bank risk-taking, and Panel D cost-efficiency.
[Table 8 around here]
Our previous analysis shows that CEOs whose cultural heritage loads negatively on
Factor 1 (i.e., whose heritage emphasizes restraint, group-mindedness, uncertainty avoidance and
long-term orientation) are linked to higher performance under increased competition. Table 8
offers some evidence that explains this result. The results show that CEOs who load negatively
on Factor 1 are linked to banks that, following an increase in competitive pressures, (i) engage in
fewer acquisitions25, (ii) realize higher acquisition announcement returns, (iii) display lower
volatility, and (iv) are more cost efficient. Jointly, this offers an explanation for why CEOs
whose ancestral origins lie in cultures that place an emphasis on restraint, group-mindedness,
uncertainty avoidance and long-term orientation are linked to higher performance under
competitive pressure. Factors 2 and 3 do not exert a significant influence on any of the bank
policy choices we analyze, which is consistent with our analysis of cultural value sets on ROA
(where neither factor affects performance).
25 This finding is consistent with the literature showing that culture matters for acquisition outcomes. For instance,
5. Alternative explanations and robustness tests
5.1. Alternative explanations based on CEO-firm matching
CEOs and firms do not match randomly. CEOs with certain desired characteristics could be
strategically appointed to take firms in a direction determined by the board. If ancestry was a
criterion for the appointment of CEOs, endogenous matching between CEOs and firms could
bias our results. Our IBBEA identification partially mitigates concerns over CEO-firm matching,
because banks that do not know whether and when a state will open for interstate competition
cannot appoint CEOs in anticipation of this event.
To further alleviate concerns over CEO-firm matching, we conduct two additional tests.
First, we split our sample into two subsamples: The first subsample contains CEOs who assume
office at least three years before a state opens for competition (i.e. plausibly before changes in
competition could have informed CEO selection and therefore, CEO appointment is plausibly
exogenous to post-deregulation performance) and the second subsample contains CEOs who
assume office within three years of deregulation. If unobserved matching were to drive our
results, we would expect a stronger performance effect among recently hired CEOs. As shown in
Panel A of Appendix 4, the effect of CEO ancestry is similar irrespective of whether a CEO was
hired within three years of deregulation.
Second, we focus on exogenous CEO turnovers to identify banks that experience a shock
to the ancestry of their CEO.26 Following Dittmar and Duchin (2016), we define CEO turnover
events as exogenous if they meet one of the following conditions: the departing CEO dies,
departs due to health-related reasons, is at least 60 years old, or the departure is part of a firm’s
succession plan (with the date of departure announced in public at least six months prior to
departure). To identify exogenous turnovers, we read the financial press and the press releases
associated with a CEO turnover event. In total, 72% of CEO turnovers in our sample are
exogenous which is consistent 67% reported in Dittmar and Duchin (2016).
Panel B of Appendix 4 estimates (i) a firm fixed effects panel regression on ROA based
on banks that experience exogenous CEO turnover during the sample period; and (ii) difference
regressions that compare bank performance two years prior to CEO turnover and two years
afterwards (ΔROA, in percentages). This empirical design allows us to exploit cross-sectional variation within the subset of exogenous CEO turnovers. In both specifications, we exclude the
turnover year to mitigate the effects of potential volatility in performance surrounding the
turnover event. The results show that when a new Gen2-3 CEO is appointed, banks enjoy an
increase in performance after a competitive shock. These results hold across both regression
models which offers further support for a causal interpretation of our results.
5.2. Omitted location and CEO variables
Our Gen2-3 variable may correlate with omitted location or CEO variables. One example of an
omitted location variable is that immigrants tend to settle in populous areas. If banks located in
populous areas are more likely to recruit talented CEOs, our results may simply reflect CEO
talent. To address this, we control for additional location characteristics. Appendix 5 shows that
our results remain robust to controlling for various location variables at the county-level:27 Ln
(population), civilian labor force, Ln (personal income), and religiosity28.
27 Data on local religiosity is obtained from the Association of Religion Data Achieves (ARDA) and data on
population and labor are from the US Census Bureau.
28 Interestingly, our results show that banks located in more religious counties outperform under competitive
Further, omitted CEO characteristics could equally bias our results. For instance,
immigrant households tend to invest heavily in the education of their children (Portes and
Rumbaut, 2001), and our results could reflect the fact that Gen2-3 CEOs have more
qualifications than other CEOs. In Appendix 6, we control for various observable CEO
characteristics: whether a CEO graduated from an Ivy League university, holds an MBA degree,
has prior work experience as a top executive, or has lived through the Great Depression. We also
control for CEO incentives: CEO ownership (the fraction of shares held by the CEO), bonus
payments, and risk-taking incentives relative to pay-performance sensitivity (vega/delta)29. The
results in Appendix 6 show that controlling for these additional CEO characteristics does not
significantly alter the coefficients on Gen2-3 CEO suggesting that cultural heritage is orthogonal
to these factors.
5.3. Legal and institutional heterogeneity in the CEO’s country of origin
The key advantage of looking at Gen2-3 CEOs is that it allows us to hold constant the economic
and institutional factors that all CEOs face while exploiting variation in the cultural values
Gen2-3 inherit from their foreign-born ancestors. However, one could argue that the omitted
institutional and economic factors at the time when a CEO’s ancestors immigrate to the US could
drive our results. For instance, immigrants from the UK could belong to different socioeconomic
strata than those from Russia (Carroll, Rhee and Rhee, 1994). To rule this out, we collect data for
a CEO’s ancestral country of origin (in the year 1900) on GDP per capita, life expectancy and
29 The sensitivity of CEO wealth to bank risk (vega) measures changes in CEO wealth to stock return volatility. The
the legal system. As shown in Appendix 7, our results remain robust to the inclusion of the
country controls.
In unreported analyses, we confirm that CEOs with ancestry linked to countries with less
developed capital markets (Germany, Italy, Poland, Russia) have a largely similar profile with
those whose ancestry is linked to countries with more developed capital markets (UK and
Ireland). Specifically, there is no statistical difference in age, tenure, education or executive
experience between the two groups. Collectively, this confirms that our results are unlikely to be
driven by the differences among these two groups.
5.4. Additional robustness tests
This section presents additional robustness tests. First, we mitigate concerns that IBBEA can be
anticipated by examining the dynamics of bank performance surrounding deregulation.
Following Bertrand and Mullainathan (2003), we decompose Competitive state into five
dummies associated with five periods: up to and including two years before deregulation
(Before2+), one year before deregulation (Before1), the year of deregulation (Present), one year
post-deregulation (After1), and two years and after post-deregulation (After2+). As indicated in
Panel A of Appendix 8, the interaction terms with Before2+, Before1 and Gen2-3 CEOs are not
significant while interaction terms with Present, After1 After2 and Gen2-3 CEOs are significant.
This shows that the shock does not appear to have been anticipated by banks.
Second, there could be omitted factors, say macroeconomic conditions, coinciding with
the timing of the shock that also affect bank performance. We address this by conducting a
placebo test where we randomly (i.e., inaccurately) assign states to the groups of competitive and
significant results even under this random assignment. As shown in Panel B of Appendix 8, the
interaction term is statistically indistinguishable from zero.
Third, we study alternative outcome variables. We replace ROA with returns on equity
(ROE), Tobin’s Q and a bank’s exposure to market downturns (via Marginal Expected Shortfall,
MES)30. As shown in columns (1)-(3) of Appendix 9, when competition intensifies, Gen2-3
CEOs are associated with a higher ROE and Tobin’s Q and a lower exposure to market
downturns.
Fourth, we address concerns that our data collection process could be noisy. While we
retrieve the census records for all CEOs born before 1940, we need to infer the ancestry
information of some CEOs born after 1940 based on their surname and birthplace. We split the
sample into two groups: CEOs born before 1940 and those born after 1940 and show in columns
(4) and (5) of Appendix 9 that our results are not driven by either group of CEOs.
Fifth, we use an alternative definition of competitive state (#liberalizations), which takes
into account all four regulatory barriers (instead of just two as in the rest of the paper). As shown
in column (6) of Appendix 9, our results are robust to this alternative definition of competitive
pressures.
Sixth, we use an alternative DiD set-up. Instead of using both within- and across-state
variation, we restrict identification to within-state variation in CEO heritage. That is, we restrict
the sample to competitive states only and assign banks with Gen2-3 CEOs to the treatment group
and those with Gen4+ CEOs to the control group. Column (7) shows that the results are robust to
this alternative DiD set-up.
30 Following Acharya et al. (2016), we calculate MES as the average return for each bank on days when the returns
Seventh, we test whether our results are driven by the quality of board governance. We
include board size and the fraction of independent directors as additional controls. Board data are
from BoardEx, Riskmetrics and Edgar DEF14A forms. Column (8) displays qualitatively similar
results when we control for board governance.
Eighth, banks located in rural areas could face less competition. If rural banks were led
by Gen4+ CEOs, our results may simply reflect a drop in profitability when competition erodes
non-competitive rents for banks led by Gen4+ CEOs. We address this by controlling for bank
profitability in 1994 (the year before IBBEA becomes effective) and show in column (9) that our
key results remain robust.
Finally, one can argue that our measure of Gen2-3 CEOs could relate to a bank’s foreign
operations. Banks with a view to expand internationally could be more likely to recruit a Gen2-3
CEO. We control for a bank’s foreign operations using its share of foreign loans and foreign
deposits. As shown in column (10), our results remain robust.
6. Conclusions
This paper advances and tests a new hypothesis on the link between CEO cultural heritage, firm
policy choices and performance in a changing industry environment. To distinguish the effects of
culture from those of other institutional and economic factors, we focus on US-born CEOs who
are the children or grandchildren of immigrants. We use a quasi-natural experiment – the
staggered introduction of interstate branching (IBBEA) – as a source of exogenous variation to
industry competition. Our paper offers novel evidence on whether and how CEO cultural
We find that the cultural heritage of the CEO shapes the way a bank reacts to a changing
industry environment. Banks led by a CEO with immigrant parents or grandparents are
associated with higher profitability when competition intensifies. This effect is uniquely linked
to the CEO and not to other senior decision-makers. Further, this effect weakens over successive
immigrant generations and can be explained by specific cultural values that prevail in the country
of a CEO’s ancestry.
We show that banks led by CEOs whose cultural heritage emphasizing restraint,
group-mindedness and long-term orientation is safer, more cost-efficient and are associated with more
cautious acquisitions which, in turn, explains the outperformance. Overall, our work is consistent
with the hypothesis that the culture of a CEO’s ancestors influences his/her decision-making