Journal of Engineering and Applied Sciences 14 (Special Issue 9): 10758-10765, 2019 ISSN: 1816-949X
© Medwell Journals, 2019
Increase Residual Energy in Wireless Sensor Networks Based on
Fuzzy Logic Cluster Head Selection
Ahlam Alsudani
Department of Physics, Collage of Education for Pure Science (Ibn-Al-Haitham),
University of Baghdad, Baghdad, Iraq
Abstract: For remote sensing and observing tasks, Wireless Sensor Networks (WSNs) are very convenient. In WSNs protocols, Sensor nodes which limited with (battery operated devices in addition to restricted resources) possessed several challenges. For combating these issues, the researches continuously conducted. In WSNs, the distribution of the energy load for nodes is the aim of clustering and this done by evaluating several aggregator nodes or Cluster Heads (CHs). Ourpaperpresents a new criterion to select the cluster head CH. This criterion used concepts of node distance, residual energy and expected efficiency. Also in this study, we assumed all sensors installed in the network have unknown position and we use a localization algorithm to locate all positions of the sensors.Our approach named Modified Energy Efficient Fuzzy Logic Cluster Head (MEEFL-CH) which is a modified approach of an approach (EEFL-CH) created by. It shows the enhancement in term of the life time of the (WSNs) better than the existence routing approaches.
Key words: Cluster head, fuzzy logic, wireless sensor networks, energy-efficient, LEACH, EEFL-CH, routing
INTRODUCTION
The development in the wireless communication technology with a lower price makes it possible to improve more powerful micro-sensors (Sha and Shi, 2005; El Alami and Najid, 2016). When current wired sensor technology would fail such as military surveillance, habitat monitoring, unattended environment monitoring, military surveillance and others, the commercial micro sensors with wireless communication such as motes from Crossbow and Intel, enable interesting applications. Limited energy constraints are considered as the main characteristic of Wireless Sensors (WS) (Vijay and Singh, 2017) and this characteristic make designing routing protocols in front of the main challenge (Vhatkar
et al., 2016). Most WS small and battery-backed. The sensor physical constraints and the prohibitive costs to exchange the failed sensors in the network make energy a crucial consideration to design a long lifetime sensor network. In the research field of sensor network, how to expand the lifetime of a sensor network is a topic of a major interest (Wei-Xin et al., 2018). In this field, a clustering algorithm is one of the popular algorithms. In WS and based on the clustering algorithm, several routing protocols are suggested (Pahlavan et al., 2002). Cluster formation and Cluster Heads (CHs) selection are the functionality of these protocols. Therefore, we present below in the literature survey section some previous studies corresponding to the proposed algorithm.
We present a Modified Least Square (MLS) algorithm to locate all sensors within the network. The distances between all sensors and the base station is computed using Received Signal Strength (RSS). Also,
the cluster head is selected using a modi ed EEFL-CH. the modification is done by using the centers of Kernel Fuzzy C Mean clustering (KFCM) as initial cluster heads instead of using the initial cluster heads used in EEFL-CH. In the EEFL-CH approach, it is assumed that position of all sensor are known and the distance between the base station and all other sensors is computed based on received signal strength. But in our approach, we assume the position of most sensors installed in the network are unknown and we compute the position of these sensors based on an algorithm named Modified Least Square Indication (MLSI) created by Lin et al. (2017) and then were compute the distance between all sponsors and the base station. So, the resulted will be more accurately than the distance estimated directly by the received signal strength and therefore, we use the new computed distance as an input parameter of the three input parameters implemented in the EFFL-CH approach. Our approach extends the life time of the network more than, the conventional LEACH approach and EFFL-CH approach.
Literature review: By El Alami and Najid (2016), Hassan EL ALAMI, presented a routing protocol named (EEFL-CH) is a modified of LEACH protocol. Three fuzzy parameters are used to select a cluster head in this work are expected efficiency, distance to base station and residual energy. This approach showed the result is better than LEACH and LEACH-ERE routing.
J. Eng. Applied Sci., 14 (Special Issue 9): 10758-10765, 2019
Two routing protocols discussed by Vhatkar et al. (2016). First protocol the Equalized Cluster Head Election Routing Protocol (ECHERP) which utilized a clustering concept. It selects a cluster head using a Gaussian elimination algorithm. The second routing protocol is PEGASIS with Double Cluster Head (PDCH). In this protocol, to form a cluster it used a distance-based method and then, it chooses two cluster heads Master Cluster Head (MCH) and Secondary Cluster Head (SCH) in every cluster. PDCH protocol compared with ECHERP protocol and the result shows that PDCH has a better performance than ECHERP because PDCH routing protocol outperforms the ECHERP in terms of packet drop ratio, energy consuming, throughput and Delay (Vhatkar et al., 2016).
Wei-Xin et al. (2018), proposed a new algorithm combines velocity. Threshold based cluster head selection mechanism. The mobile nodes select cluster head regarding their current locations depending on the velocity threshold-based mechanism where high location could be set. The way in which this routine protocol select cluster head and classify them is according to their velocity by check the priorities of the quick moving node. Appropriate cluster head can be elected to build a network and transport data toward destination node from the origin node by obtaining a minimum delay. The factors of a heterogeneous sensor network have been enlightened and explored depending on the velocity and cluster head election where velocity based threshold scheme and routing protocol are presented to encounter the delay problem with heterogeneous levels. The three levels of velocity based threshold for selecting cluster head which is optimum to minimize the delay to obtain smooth delivery of data packets (Wei-Xin et al., 2018). In this study, a novel algorithm for selecting cluster heads of a communication network has moving sensors. The selected cluster heads should have an accurate positions and distances among all other sensors within the network and the base station of this network as well.
The proposed systemmodel: In our research, the basic system model is a Wireless Sensor (WS) network system having n sensors installed in the network. We used operation based on algorithm clustering. In this operation, the sensed data of every node sent to its cluster head then the sensed data collected and transmitted to the base station by the cluster head. In this section, we present all steps of the proposed algorithm which is a new routing protocol and using three fuzzy parameters; a distance to base station, expected efficiency and residual energy to reduction energy depletion in term of network lifespan addition. In this research, we assume all WS are distributed randomly in the network in an indoor environment and the position of these sensors are unknown.
Our algorithm is divided into two main stages, the sensor localization and cluster head selection for energy efficiency.
Sensor localization: The researchers of Pahlavan et al. (2002) realize the necessity for the essential study of the description of indoor radio dissemination besides its effect on these system’s accuracy. A framework is a requirement in system design and performance valuation for success and development this technology. Performance, cost and complexity, security and application requirements are four areas of challenges which are identified by Krishnamurthy (2002).
In this research, we are interested in the performance challenge because it is corresponding to the positioning accuracy and we explain it brie y in the text below. Error distance between estimated and actual mobile locations is called the accuracy of the position information which is the most important performance metric. Location precision is the confidence interval or percentage of successful location discovery which it should include in report accuracy. To obtain a precise position for sensors in an indoor environment, we should nd a suitable technology that may fit with the indoor environment and therefore we used sensors work with Ultra-Wideband UWB technology. UWB signal has several advantageous that allow the signal to be suitable for an indoor environment. UWB signal work perfectly in Line of Sight (LOS) propagation channel but suffers in anon-line of sight propagation channel (Anonymous, 2015; Albaidhani
et al., 2016). So, to obtain precise estimated distance, we implemented a Modi ed Least Square Iteration (MLSI) localization method to locate the sensor position and then, recomputed the estimated distance to obtain the third parameter of the inputs of the fuzzy logic approach as we mentioned above.
MATERIALS AND METHODS
Modified Least Square Iteration (MLSI) method: Different positioning algorithms are in the market to locate a sensor position such as Maximum likelihood estimation, fingure printing and Least Square (LS) methods. In this research, we implemented a modified LS (MLSI) created by Lin et al. (2017) because the positioning accuracy is higher than other mentioned methods. The MSLI is explained below. To locate a target (two dimensions) in 360° in a plane, we need for at least three anchor nodes with known position (and coordinates). So in this research, we assume there are n sensors (four sensors in this research) with known positions among number nodes installed in the network. Let assume the three anchor nodes coordinates as follows: C x1 and y1 the coordinates of anchor 1 (A1)
C x2 and y2 the coordinates of anchor 2 (A2) and
C x3 and y3 the coordinates of anchor 3 (A3). And the
coordinates of the unknown sensor
J. Eng. Applied Sci., 14 (Special Issue 9): 10758-10765, 2019
(1)
2
22
i i i
d x -x + y -y
The conventional LS method is a nonlinear estimation methods that needs for an initial guess of the unknown sensor position and iteration method to compute the position of a sensor in the network. In this research we use the linearized LS by implementing one anchornode as a reference node that will be subtracted from all other anchor nodes in the installed in the network to compute the position of every sensor as shown in Eq. 3 below. Let assume the reference node is the anchor node 1 and has x1 = 0 and y1 = 0. Then for i>1:
(2)
2
2
2 2 2 2
i 1 i i
d -d x -x + y -y - x +y
By modifying Eq. 3, we obtain Eq. 4 as written below: (3) 2 2 2 2
i i 1 i i i
x +y +d -d 2xx +2yy
Then, converting Eq. 3 to matrix notation, we can obtain: 2 2 2 2
2 2 1 2 2 2 2
2 2 2 2 3
3 3 3 3 1 3
2 2 2 2
n n n n 1 n n
x +y +d -d b 2x 2y
b 2x 2y x +y +d -d
A b
2x 2y x +y +d -d b
where, d1 denotes the real distance between the reference
node and mobile station and denotes the distance between mobile station and all nodes except the reference. Finally, the mobile station coordinates will be computed as shown in Eq. 5:
(4)
T
-1 Tx
p A A A b
y
In real life, we don’t have the real distance, so, we denote the measured distance by and apply the Modified LS (MLSI) created by Lin et al. (2017) to improve the localization of the sensors to be more accurately than using the conventional Linearized LS as shown below in Eq. 6.
The MLSI method has the same mathematical expression of the conventional LS (Eq. 5) with modifying the distance vector (b) by involving the average distance error to it as shown below. First, let 0(e1) and 0(ei) denote the average distance error between the MS and the reference node and the average distance error between the MS and the rest of the entire anchor nodes, respectively where i = 2, ..., then:
2 2 2 2
i i i 1 i 1 i
ˆb x +y +d -d + e - e
Or
2 2 2 2
2 2 1 2 1 2
2 2 2 2
3 3 1 3 1 3
2 2 2 2
n n 1 n 1 n
x +y +d -d e - e x +y +d -d + e - e ˆb
x +y +d -d + e - e
where,ˆbdenoted the estimated vector of the distance. And therefor, the estimated position of a sensorˆp is:
(5)
T
-1 Tx ˆ
ˆp A A A b y
After obtaining the position, we compute the enhanced distance between the sensors and base station using Eq. 1 above.
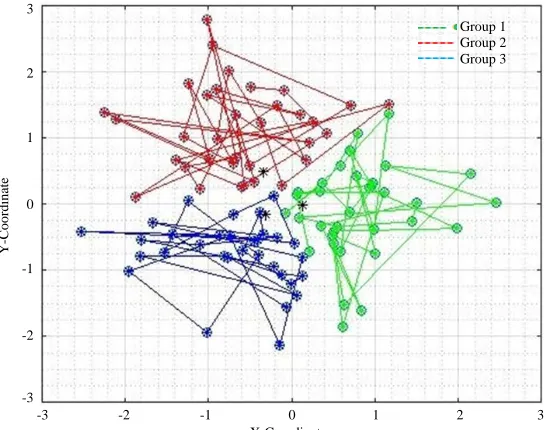
Conditions of cluster head selection: After obtaining the enhanced distance, we implemented the EEFL-CH algorithm created by El Alami and Najid (2016) to determine the cluster head of each group sensors in the network. In this study, first, we initially select the cluster head of each group using a Kernel Fuzzy C Mean (KFCM) technique instead of determine it randomly as presented in the EEFL-CH algorithm then using the EFFL-CH to update the selection of the cluster head in each iteration until the network life end. With cluster n sensors into three groups and in every iteration, we select the new cluster head within its cluster. Figure 1 presents the KFCM clustering algorithm. The three parameters used to be applied as inputs in fuzzy logic approach to specify the new cluster head for each group of sensors are the distance of the sensors to the base station, residual energy and expected efficiency. All these parameters are explained below.
Input of fuzzy logic approach: The distance of the sensors to the Base Station (BS). It means the distance between the node and BS. The distance is computed as we explained in above.
Residual energy: It defines as the variance between the exhausted energy and initial energy of every node. The radio model presented in is implemented to compute the energy dissipation. For transmitting an l-bit message over a distance d, the residual energywidened by the radio is given by the Eq. 6:
(6)
2
Tx elec fs 0
4
Tx elec mp 0
E I, d I E +I× d d<d E I, d I E +I× d d d
fs 0
mp d
J. Eng. Applied Sci., 14 (Special Issue 9): 10758-10765, 2019
Fig. 1: Kernel fuzzy C mean clustering Where:
d0 : The reference distance value
d : Distance between the transmitter receiver I : Size sensed packet
Eelec : The electronics energy of (receiver or
transmitter) circuitry 0fs and 0mp: Amplifiers model
For receiving this message, the radio expends:
(7)
x
R elec
E I I E
The Expected Efficiency (EE): The proportion between Expected Residual Energy (ERE) of every node and the Expected Average Energy (EAE) of the cluster is called expected efficiency.
In our research, the expected efficiency is the modification in principle for the ERE by Lin et al. (2007). A node remainder energy after obtaining its cluster head for a round is defined as ERE. One time, the node is chosen as the cluster head and formed the cluster then the frames formed from the dividing of the steady-state stage. At allocated transmission slot of cluster members, their sensed data sent to the cluster head. In a frame and from all cluster members the sensed data is received by each cluster head. The sensed data will cumulative in a single package and send it to the base station by the cluster head. Equation 8 represent the expected consumed energy (Fig. 2):
(8)
xx
T BS
exp consumed BS frame
R DA
E I, d +n× E I, d , n N
E I +I×E
It is supposed the same packet size is sent and received by all nodes and it assumed the dissipation energy of every node to be the cluster head the collection process (EDA), it is constant. After a steady-state phase,
the energy of expected residual of anode (ECHExp Residual)
to be a CH is given by:
(9)
E xp Residual BS Residual Consumed _ ECH I, d , n E E
The node residual energy before cluster head choosing denotes by where the cluster members number represents by n. On the other hand, we determine the expected consumed-energy of non-CH node (Enon CH_Exp Consumed) after executing the action as sensing the data and send them to cluster head at their allocated time period. After a steady-state phase (Enon CH_Exp Consumed) is given by:
(10)
x
Exp Consumed T CH
Enon CH N frame E I, d
where, dCH denotes the distance between the cluster head
and non-CH node. Also and after a steady-state phase, the (ERE) of non-CH node computed as shown in Eq. 11 below:
(11)
Expresidual CH residual ExpConsumed E I, d E EnonCH
Then, after the steady-state phase, the expected residual energy of cluster can be computed as shown in Eq. 12 below:
(12) Expresidual Exp Residual Exp Residual
N ECL ECH + Enon CH
K
3
2
1
0
-1
-2
-3
Y
-Co
ordin
ate
-3 -2 -1 0 1 2 3 X-Coordinate
J. Eng. Applied Sci., 14 (Special Issue 9): 10758-10765, 2019
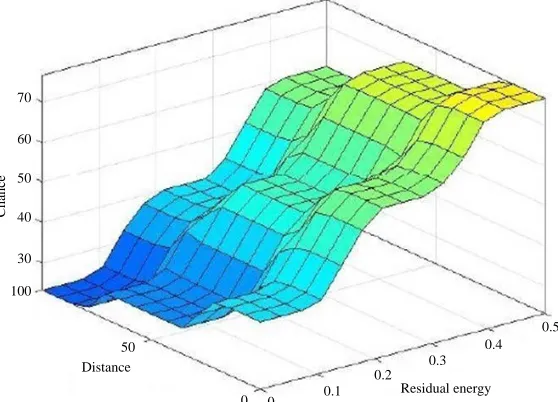
Fig. 2: Correlation between distance value, residual energy and chance probability of node
Fig. 3: Correlation between expected ef ciency value, residual energy and chance probability of node At every round, the number of clusters denoted
by K where the number of nodes represented by N. In the proposed approach named modi ed EEFL-CH (MEEL-CH), we implemented the most frequencies method depended by Albaidhani et al. (2016), Decawave (2014), Bai and Wang (2006) and Anonymous (2015) called the (mamdani technique). In our research, we implemented the Fuzzy Inference Systems (FIS) to calculate the chance of every node. Figure 3 presented the relation between one output named chance which means the probability of the node to be cluster head and the three input parameters for FIS. For a present round, more probability of the node to be cluster head represents the maximum of chance.
Rules and parameters of the FIS: First, we present below an overview of the concept of the fuzzy logic control FLC. The following three steps are acquired to utilize fuzzy logic technique to a actual application (Bai and Wang, 2006):
Fuzzification: Membership Functions (MFs) obtained from classical data or crisp data conversation by using fuzzification step.
Fuzzy inference process: The fuzzy output derived from the combination between the control rules and membership functions by using fuzzy inference process.
70
60
50
40
30
100
Cha
n
ce
50
0 0 0.1
0.2 0.3
0.4 0.5
Residual energy Distance
70
60
50
40
30
100
Cha
n
ce
50
0 0 0.1
0.2 0.3
0.4 0.5
[image:5.612.173.459.344.544.2]J. Eng. Applied Sci., 14 (Special Issue 9): 10758-10765, 2019
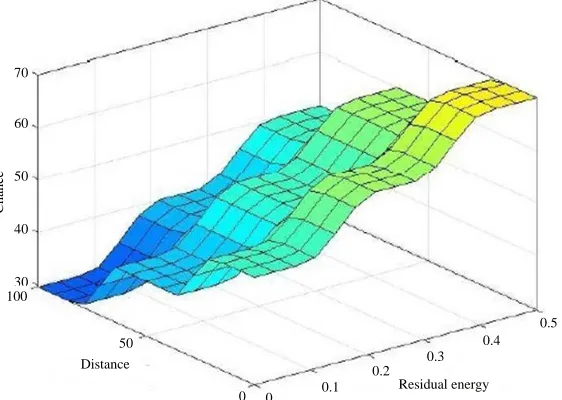
Fig. 4: Correlation between distance value, expected efficiency and chance probability of node Defuzzification: In a defuzzification step, each
corresponding output computed and putted in a table (lookup table) by implementing different methods. Then and according to the current input during an application, the output picked up from the lookup table.
We implemented (expected efficiency, residual energy and distance to BS) fuzzy parameters in our suggestion because of the importance of these parameters for minimizing energy consumption in WSNs and maximizing the network lifetime. Also, we divide each fuzzy parameter into three levels to make these parameters more flexible then, 33 = 27 possible chance
values calculated by implementing (if-then) fuzzy rules. Figure 2-4 illustrate correlation between distance value, expected efficiency, residual energy and chance Probability. (High, Medium, Low) the linguistic variables for fuzzy sets of node. Many membership functions are available but we selected (a trapezoidal and a triangular) membership functions in our protocol for minimizing the cost of calculation. These two membership functions used for the linguistic variables. For (low, high), a function of trapezoidal membership was used and it implemented for (close, far) but for medium, a triangular membership function used. For the fuzzy set of chance output variable, linguistic variables are divided into (9) levels they are: C Very Low (V-L)
C Low
C Rather Low (R-L) C Medium Low (M-L) C Medium
C Medium High (M-H) C Rather High (R-H) C High
C Very High (V-H)
Table 1: Rule-base implemented in the suggested technique
Input Function’s membership Output Weight
distance high low 0.65
distance average average 0.65
distance low high 0.65
efficiency high high 1
efficiency average average 1
efficiency low low 1
energy high low 0.35
energy average average 0.35
energy low high 0.35
Linguistic Variables ((V-L), (V-H)) represented using trapezoidal membership functions and the triangle membership functions represent the remaining linguistic variables as describe in Fig. 5. Figure 5 presents the degree of membership function of the output (chance) of the FCL.
Calculation the node chance value: We use an excellent technique named the fuzzy logic technique to find the relationship between the parameters, attributing a probability for every received reading data. The fuzzy logic approach implemented in this research is utilized to set the chance of the node to be a cluster head as an output of each received reading (i.e., Low, Average and high probability of errors) corresponding for every 3-tuples (distance to the base station, expected efficiency and residual energy).
Table 1 explained the fuzzy logic rules. The output set of FLC is divided into different ranges of the propagation channel types as displayed in Fig. 5. Hint: all ranges of the input and output sets of the fuzzy system are determined experimentally depends on the experiment scenario which is suitable for indoor environments.
70
60
50
40
30
Cha
n
ce
50
0 0 0.1
0.2 0.3
0.4 0.5
Residual energy Distance
[image:6.612.316.540.344.441.2]J. Eng. Applied Sci., 14 (Special Issue 9): 10758-10765, 2019
Fig. 5: Membership function of chance
The last step of the FCL is the dffuzzification process. Fuzzy system output (chance of node) is defuzzified implementing the center of gravity defuzzification method as expressed in Eq. 13.
(13) n
i 1 i n i 1 i
A c Chance
A
where, chance, A and c denote the fuzzy system output, the subarea of the input system and the centroid of the subarea, respectively.
RESULTS AND DISCUSSION
In this research, we assess the performance of MEEF-LCH technique implementing MATLAB. By using WSNs, 100 m2 area and the No. of nodes is 100
(n = 100) we simulate proposed MEEFLCH, EEF-LCH and LEACH. At random, the distribution of nodes in the network of 100 m2 area, also 0.1 probability of becoming
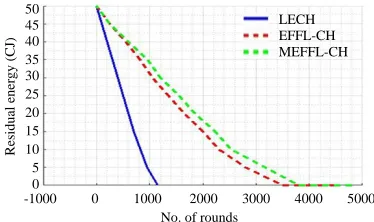
CH and the location of base station in center of the sensing field. Table 2 presented the radio parameters that utilized in our work. The MEEFL-CH protocol is compared to EEFL-CH and LEACH protocols in terms (residual energy, network lifetime) where each node initially given 0.5 J of energy.
[image:7.612.330.517.341.452.2]Figure 6, depicts the residual energy presenting the accumulated energy squandering on the round. From our results, as shown in Fig. 6. We obtained the residual energy by MEEFL-CH protocol is higher than LEACH and EEFL-CH approaches. The reasons of this modification are power control executed by cluster head and a chance selection cluster head that consider (distance
Fig. 6: Residual energy of network
Table 2: Parameter settings (Sha and Shi, 2005)
Parameters Values
Eelec 50nJ/bit
EDA 5nJ/bit/message
0fs 10pJ/bit/m
2
0mp 0.0013pJ/bit/m
4
E0 0.5J
I 4000 bit
to base station, the Residual Energy (RE) of every node and Expected Efficiency (EE) that permitting to minimize the energy squandering in the entire network.
CONCLUSION
In this study, a modified approach (MEEFL-CH) of an approach (EEFL-CH) is presented. Our proposed (MEEFL-CH) protocol considered the expected efficiency, the residual energy and the distance of the nodes to BS of to select a CH. In this research, we assume all sensors having unknown position and therefor, our research is divided into two main stages, the sensor localization and cluster head selection for energy
1.0
0.8
0.6
0.4
0.2
0
0 10 20 30 40 50 60 70 80 90 100 Chance
De
gree of
mem
b
er
sh
ip
V-L Low R-L M-L Medium M-H R-H High V-H
50 45 40 35 30 25 20 15 10 5 0
-1000 0 1000 2000 3000 4000 5000 No. of rounds
Res
idua
l ener
gy (C
J)
[image:7.612.316.540.496.561.2]J. Eng. Applied Sci., 14 (Special Issue 9): 10758-10765, 2019
efficiency. We use a localization algorithm named MLSI to locate all positions using RSS and then recomputed the estimated distance and used the new computed distance asan input parameter of the three input parameters implemented in the EFFL-CH approach. Another modification of EEFL-CH algorithm is implemented using the centers of KFCM as initial cluster head instead of random choosing of CHs selection in implemented by the EEFL-CH protocol. Our results have better performance compared to EEFL-CH and LEACH approaches since our approach extends the life time more than EEFL-CH and LEACH approaches.
ACKNOWLEDGEMENT
First of all, I would like to express my great thanks and deepest gratitude to my husband for his help and without him that work will never be done. Also, I would like to thank the Institute of Fatimah (Baghdad-Iraq) and its director Dr. Abbas Albaidhani for his effort to help for improving my work to obtain a novel contribution suitable for publishing in the Journal of Engineering and Applied Sciences.
REFERENCES
Albaidhani, A., A. Morell and J.L. Vicario, 2016. Ranging in UWB using commercial radio modules: Experimental validation and NLOS mitigation. Proceeding of the 2016 International Conference on Indoor Positioning and Indoor Navigation (IPIN), October 4-7, 2016, IEEE, Alcala de Henares, Spain, ISBN:978-1-5090-2426-1, pp: 1-7.
Anonymous, 2015. DW1000 user manual. DecaWave Ltd., https://doc.openrtls.com/User_Manual_ WIP_SPI.pdf
Bai, Y. and D. Wang, 2006. Fundamentals of Fuzzy Logic Control-Fuzzy Sets, Fuzzy Rules and Defuzzifications. In: Advanced Fuzzy Logic Technologies in Industrial Applications, Bai Y., H. Zhuang, D. Wang (Eds.). Springer, London, UK., ISBN: 978-1-84628-468-7, pp: 17-36.
Decawave LTD., 2014. APS006: The effect of channel characteristics on time-stamp accuracy in DW1000 based systems. Version 1.02, DecaWave Limited, Dublin, Ireland. https://www.decawave.com/wp- content/uploads/2018/10/APS006_Part-1-Channel-Effects-on-Range-Accuracy_v1.03.pdf
El Alami, H. and A. Najid, 2016. Energy-efficient fuzzy logic cluster head selection in wireless sensor networks. Proceedings of the 2016 International Conference on Information Technology for Organizations Development (IT4OD’16), March 30-April 1, 2016, IEEE, Fez, Morocco, pp: 1-7.
Krishnamurthy, P., 2002. Position location in mobile environments. Proceedings of the NSF Workshop on Context-Aware Mobile Database Management (CAMM’2002), January 2002, Providence, Rhode Island, pp: 1-3.
Lin, K.H., C.C. Lu, H.M. Chen, H.F. Li and C.F. Chuang, 2017. A modified least squares iteration for indoor positioning system. Proceedings of the 2017 IEEE International Conference on Consumer Electronics-Taiwan (ICCE-TW’17), June 12-14, 2017, IEEE, Taipei, Taiwan, pp: 109-110.
Pahlavan, K., X. Li and J.P. Makela, 2002. Indoor geolocation science and technology. IEEE Commun. Mag, 40: 112-118.
Sha, K. and W. Shi, 2005. Modeling the lifetime of wireless sensor networks. Sens. Lett., 3: 126-135.
Vhatkar, S., S. Shaikh and M. Atique, 2016. Evaluation of equalized cluster selection routing protocol in wireless sensor network. Int. J. Adv. Res. Comput. Eng.Technol. (IJARCET), 5: 2423-2427.
Vijay, V. and M. Singh, 2017. Energy efficient cluster head selection technique for homogeneous wireless sensor networks. Proceedings of the 2017 2nd International Conference on Communication Systems, Computing and IT Applications (CSCITA’17), April 7-8, 2017, IEEE, Mumbai, India, pp: 54-59.