Original citation:
Yuan, Hu, Guo, Weisi, Jin, Yanliang, Wang, Siyi and Ni, Minming. (2017) Interference-aware multi-hop path selection for device-to-device communications in a cellular interference environment. IET Communications.
Permanent WRAP URL:
http://wrap.warwick.ac.uk/87352
Copyright and reuse:
The Warwick Research Archive Portal (WRAP) makes this work by researchers of the University of Warwick available open access under the following conditions. Copyright © and all moral rights to the version of the paper presented here belong to the individual author(s) and/or other copyright owners. To the extent reasonable and practicable the material made available in WRAP has been checked for eligibility before being made available.
Copies of full items can be used for personal research or study, educational, or not-for-profit purposes without prior permission or charge. Provided that the authors, title and full
bibliographic details are credited, a hyperlink and/or URL is given for the original metadata page and the content is not changed in any way.
Publisher’s statement:
"This paper is a postprint of a paper submitted to and accepted for publication in IET Communications and is subject to Institution of Engineering and Technology Copyright. The copy of record is available at IET Digital Library"
A note on versions:
The version presented here may differ from the published version or, version of record, if you wish to cite this item you are advised to consult the publisher’s version. Please see the ‘permanent WRAP URL’ above for details on accessing the published version and note that access may require a subscription.
Interference-Aware Multi-Hop Path Selection for Device-to-Device
Communications in a Cellular Interference Environment
Hu Yuan1, Weisi Guo1*, Yanliang Jin2, Siyi Wang3, Minming Ni4 1School of Engineering, University of Warwick,UK
2School of Communication and Information Engineering, Shanghai University, China.
3Department of Electrical and Electronic Engineering, Xi’an Jiaotong-Liverpool University, China. 4School of Electronic and Information Engineering, Beijing Jiaotong University, China.
Abstract: Device-to-Device (D2D) communications is widely seen as an efficient network ca-pacity scaling technology. The co-existence of D2D with conventional cellular (CC) transmissions causes unwanted interference. Existing techniques have focused on improving the throughput of D2D communications by optimising the radio resource management and power allocation. How-ever, very little is understood about the impact of the route selection of the users and how optimal routing can reduce interference and improve the overall network capacity. In fact, traditional wis-dom indicates that minimising the number of hops or the total path distance is preferable. Yet, when interference is considered, we show that this is not the case. In this paper, we show that by understanding the location of the user, an interference-aware routing algorithm can be devised. We propose an adaptive Interference-Aware-Routing (IAR) algorithm, that on average achieves a 30% increase in hop distance, but can improve the overall network capacity by 50% whilst only incurring a minor 2% degradation to the CC capacity. The analysis framework and the results open up new avenues of research in location-dependent optimization in wireless systems, which is particularly important for increasingly dense and semantic-aware deployments.
1. Introduction
In recent years, the cellular network has experienced significant growth in wireless data demand (an average 66% Compound Annual Growth Rate) and is at risk of not being able to meet the demand in the near future.Indeed there is a widespread recognition that the average network capacity needs to grow by 1000-fold over the coming decade and the minimum achievable capacity needs to grow by 10-fold.
1.1. Background to D2D
het-erogeneous network [2, 3]. The conditions which might trigger establishing cellular assisted D2D communications include insufficient channel resources in the BS and the transmission of delay tol-erant data [2]. As for device discovery between potential D2D UEs, it has been proposed that the UEs can utilize recent 3GPP proximity services (ProSe) standardisation [4]. D2D communications also enable distributed storage [5] and relate the natural way in which people interact and exchange information socially [6, 7]. Due to the multi-hop nature of D2D relaying, the Quality-of-Service (QoS) performance metrics associated with D2D communications are primarily related to outage probability, as the data is usually for services that demand a low data rate and can tolerate a high latency.
1.2. Review of Multi-Hop Optimization
Stand-alone multi-hop routing in wireless communications is a well addressed research area. In the past, research has focused on: i) how to incorporate feedback mechanisms to ensure greater routing reliability [8], ii) how to optimise partner selection to exploit spatial diversity [9–11] and iii) how to optimise spectrum sharing and power control for increased energy- and spectrum efficiency [2, 3, 12]. However, when one considers multi-hop routing in the context of D2D communications, a major modelling consideration is the mutual interference between the overlay macro-BS tier and the temporarily formed underlay D2D tier. One of the unresolved, and must be resolved challenges is, how to efficiently select D2D relay partners in such an interference-limited environment. This is a dynamic problem with many variables such as the location of the source-destination UE pair.
In terms of existing work on multi-hop routes that mitigate cross-tier interference, one approach used is to introduce and optimise an artificial exclusion zone, where D2D transmissions can occur only inside the zone, and CC transmissions are restricted to outside the zone [13]. The caveat with this approach is that a large number of exclusion zones can severely degrade CC transmission capacity. The other approach is one in which we proposed ourselves. This approach is one where the routing path is dynamically controlled such that it spatially avoids high cross-tier interference areas. This is known as Interference-Aware-Routing (IAR), and we conducted a preliminary nu-merical analysis in [14]. We note that similar ideas have also been presented subsequently in [15] and has shown promising results.
1.3. Stochastic Geometry Modelling
We also briefly review general modelling methodologies. This paper employs both large-scale statistical modelling in the form of stochastic geometry, as well as agent-based-modelling (ABM) using Monte-Carlo cellular network simulations.In reviewing stochastic geometry analysis, it can obtain general performance analysis, guidelines, and design insights that apply when averaging over all distinct realisations [16, 17].This complements our ABM models, which utilises standard 4G LTE spatial and protocol configurations for the macro-BS cellular network and D2D underlay network [14].
1.4. Contribution and Organisation
compari-j
Downlink interference from overlay macro-BSs to underlay D2D UEs
j’ ro,m
ro,m’ o
ro,j’
ro,j
Underlay of D2D UEs Overlay of Macro-BSs
Interference from other D2D UEs Destination, m’
Source, m
R Maximum communication distance
ε Maximum forward progress j Closest UE to m’within range R
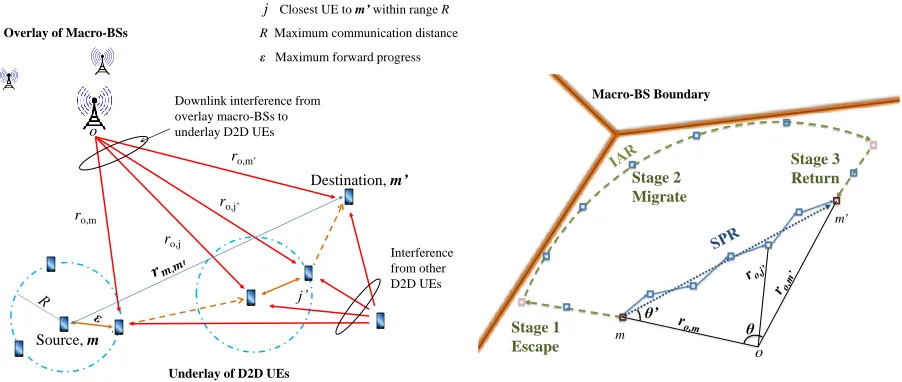
(a) An overlay of macro-BSs and an underlay of D2D UEs performing multi-hop communications from UEmto UEm0. The maximum po-tential forwarding distance within D2D UEs coverage boundary for each single hop.
m'
m θ
θ’
Stage 1 Escape
Stage 2 Migrate
Stage 3 Return
Macro-BS Boundary
o
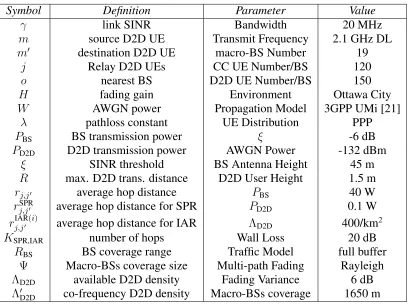
(b) D2D multi-hop communications frommtom0under SPR or IAR algorithms.
Fig. 1. Routing algorithms for D2D multi-hop communications.
son, (2) provide geometric boundaries that define the spatial operational envelopes for different D2D routing algorithms and CC transmissions, and (3) analyse the downlink (DL) system perfor-mance (outage probability and capacity) as a function of the offloaded traffic volume.
The paper is organised as follows. In Section II, the system setup and parameters used for ABM simulation and stochastic geometry framework are defined. The two main routing algorithms (SPR and IAR) are defined in section III. In Section IV, the performance metrics for both algorithms are defined and their theoretical bounds are derived. In Section V, the results on network capacity, offload traffic volume, and outage probability are presented together as well as the relationship to spatial operating zones.In Section VI, we conclude our findings and discuss open challenges.
2. System Setup
The system modelled in this paper is a 4G multiple-access network with cellular BS assisted ac-cess D2D communications. The D2D communication links can utilise either the in-band cellular spectrum or out-band spectrum(pre-defined, i.e., LTE-U [18]). Due to the scarcity of the spectrum and the transmission regulations in unlicensed bands, the in-band case is selected for analysis, where low power D2D communications share the same spectrum as the conventional cellular (CC) channels [1, 2]. In general, the centre of the BS’s coverage area is off-limits to D2D transmissions using the cellular DL band due to the high DL interference from the nearby macro-BS. The cell edge is generally off-limits to D2D transmissions using the cellular UL band due to the high UL interference from cell-edge CC UEs transmitting at high power levels. As shown in Fig. 1(a), D2D UEs share the DL spectrum with the CC network, and as a result, DL interference is from the overlay marco-BSs to underlaying D2D UEs.
[image:4.612.83.534.80.271.2]the multi-hop communication between two arbitrarily located UEs within the coverage area of a BS, but Section V will discuss how it can be extended to consider the communication between two UEs that are not in the same coverage area of a single BS. We consider both the BSs and UEs are distributed randomly uniformly, i.e., a Poisson Point Process (PPP) with the densityΛD2D, and BSs
are distributed as a PPP with density ofΛBS[19]. The traffic in the network is assumed to be full
buffer (i.e., every radio-resource-block (RRB) is occupied).
2.1. D2D UEs Distribution and Receiver SINR
The signal-to-interference-plus-noise-ratio (SINR) at a receiver UEj0, that forms one of the many relay UEs in the D2D multi-hop link. The aggregated interference power at a receiver arises from two sources: (1) co-frequency D2D transmissions in the same BSs; (2) the transmission on CC links from all the BSs,IBS. Therefore, for a relay UE that is of distancero,j0 from the nearest BS,
the received SINRγ between any D2D relayj andj0 is:
γ ro,j0=
Hj,j0PD2DλD2Dr−α
j,j0
W +IBS(ro,j0) + P
i∈Φ
i6=j
Hi,j0PD2DλD2Dr−α
i,j0 ,
(1)
where IBS(ro,j0)is the total interference from all BSs. The average interference power from the
second nearest BS to further BS is [20]:
IBS2nd =
"
πΛBSΞ(ro,j0,Ψ,4)
2p1/PBSλBSerfc−1(0.5) #2
, (2)
so the total BS interference is comprised of the interference from the nearest BS that is of distance
ro,j0 away, and other further BSs.
IBS=PBSλBSro,j−α0+
"
πΛBSΞ(ro,j0,Ψ,4)
2p1/PBSλBSerfc−1(0.5) #2
. (3)
whereΞ(ro,j0,Ψ,4) = arctan(Ψ)−arctan(ro,j0). The parameters for the above equations are as
follows: Wis the AWGN power,His the fading gain,P is the transmission power,Λis the density of the transmitters,λis the frequency dependent pathloss constant,rj,j0 is the distance between the
transmitter and receiver D2D UEs, Ψ is the radius of the network coverage area for which an accurate BS densityΛcan be determined [20], andαis the pathloss distance exponent. Typically, the aggregate interference power is significantly higher than the additive noise powerW, and one can be assumed that the noise power is negligible. The full list of symbols used is given in Table 1.
3. Routing Strategies
3.1. Shortest-Path-Routing (SPR) Algorithm
Table 1 Symbol Notation
Symbol Definition Parameter Value
γ link SINR Bandwidth 20 MHz
m source D2D UE Transmit Frequency 2.1 GHz DL
m0 destination D2D UE macro-BS Number 19
j Relay D2D UEs CC UE Number/BS 120
o nearest BS D2D UE Number/BS 150
H fading gain Environment Ottawa City
W AWGN power Propagation Model 3GPP UMi [21]
λ pathloss constant UE Distribution PPP
PBS BS transmission power ξ -6 dB
PD2D D2D transmission power AWGN Power -132 dBm
ξ SINR threshold BS Antenna Height 45 m
R max. D2D trans. distance D2D User Height 1.5 m
rj,j0 average hop distance PBS 40 W
rSPR
j,j0 average hop distance for SPR PD2D 0.1 W rj,jIAR0(i) average hop distance for IAR ΛD2D 400/km2
KSPR,IAR number of hops Wall Loss 20 dB
RBS BS coverage range Traffic Model full buffer
Ψ Macro-BSs coverage size Multi-path Fading Rayleigh
ΛD2D available D2D density Fading Variance 6 dB
Λ0D2D co-frequency D2D density Macro-BSs coverage 1650 m
it is required that each D2D UE knows its own location through its Global Position System (GPS) or other wireless localisation means (e.g., wireless fingerprinting). The SPR algorithm operates in the following manner:
1. The source UE m requests communication with a destination UE m0 through standard au-thentication via the network. The serving BS authorises D2D communications and provides the location of destination UEm0 to the source UEm, which is then used for route selection. 2. If destinationm0is not in range of sourcem, UEmbroadcasts a relay request and the request is received by neighbouring UEs in its communication range R, where R is the maximum distance for which reliable data transmission can take place. Available relay UEs will send back an acknowledgement tom.
3. UEmsends the data packet to the relay UEj that is the closest to the destination UEm0. The pseudo code is as follows: let ΓK be the total set of available relay UEs j0 at hop sequence
K ={1,2,3, ..., k}, andrm,j0 ∈Lkbe the set of the distances between the potential
forward-ing UEs andm0.
WhileThe communication data has not reachedm0
1Calculate distanceLkbetweenΓkand UEm0;
2Find the UEj0with distanceminLk;
3Transmit the data to UEj0 ;
In the event that the D2D multi-hop process fails, the assisting BS will take over the communica-tions and establish a standard CC link between the last successful relay UE and the destination UE. The BS assistance contains three main functions at each hop: (1) register the D2D UEs’ identifi-cation (ID) and the D2D UE link layer identifier, (2) authorise the D2D UEs proximity discovery whereby the open discovery technology is used (in open discovery, the UEs can be detected by any other UE in it’s proximity [22]), and (3) provide the destination UE location to the relay UEs.
Fig. 1(b) illustrates the SPR algorithm betweenmandm0, where the solid line (in blue) shows the D2D multi-hop path, which can be approximately modelled by a straight line (accurate for high UE densities). Fig. 1(a) shows a D2D UEs, its maximum coverage rangeR, and how it selects a new relay UEj to forward the message to. The selection of D2D relay UE is dynamic and real-time when the UE finished the relaying it would be released from the D2D communication link. Furthermore, the relay UE can modify the routing path according to the periodically signal from the BS.
3.2. Interference-Aware-Routing (IAR) Algorithm
The idea behind IAR is to reduce the cross-tier interference from the BS to the D2D links. In the DL channel, the main interference is from the nearest BS (dominant inter) and co-frequency D2D transmissions (intra). In order to minimise the interference from the BS, the multi-hop route attempts to travel along the cell-edge of the coverage area. This is shown in Fig. 1(b) with a circular coverage area for illustration purposes. For a pair of arbitrarily located source and destination UEs, there are three individual stages to the IAR algorithm, and each stage uses the previously described SPR algorithm to accomplish it:
1. Stage 1 Escape: multi-hop from source UE m to the closest UE to the cell-edge, this is achieved using SPR;
2. Stage 2 Migrate: multi-hop from one cell-edge UE to another cell-edge UE that is closest to the destinationm0;
3. Stage 3 Return: multi-hop from the cell-edge UE to the destination UEm0, this is achieved using SPR.
If there are no D2D UEs that satisfied the condition of IAR, the routing will switch to the previously mentioned SPR scheme and relay directly to the destination UE. In most cases, the IAR algorithm increases the path length significantly in comparison to the SPR algorithm, but the advantage is that the interference from the BS can be reduced significantly due to the increased distance from the nearest BS.
4. Quality-of-Service (QoS) Performance
f,rm,m0(ε) =
P∞
n=0G(n)2n(rm,m0 −ε) arccos(1 + ε
2−R2
2rm,m0−(rm,m0−ε))
×
1 2
q 4R2r2
m,m0−(R2−ε2+ 2rm,m0ε)2
−(rm,m0−ε)2arccos(1 + ε
2−R2
2rm,m0−(rm,m0−ε))
+R2arcsin(R2−ε2+2rm,m0ε
2lR )
n−1
06ε6R
0 elsewhere,
(5)
4.1. Average Hop Distance
4.1.1. Maximum Transmission Distance: In order to characterise the success probability
per-formance of the SPR and IAR algorithms, it is necessarily first to determine the average hop dis-tance of each scheme. As shown in Fig. 1(a), each UE is capable of transmitting a signal of up to an average rangeR, which covers an areaA= πR2. For each hop, the D2D UE within the range Rclosest to the destination is selected as a relay UE for the next hop, the hop distance isε. For the QoS requirement of the data communication, the minimum SINR required isξ. Therefore, using Eq. (1) to find the maximum value ofrj,j0, the maximum of D2D transmission distance for a single
hop is (see Section 7.1):
R = arg maxrj,j0|γ(ro,j0)≥ξ =
ξIBS(ro,j0)
PD2DλD2D
+ξX
i∈Φ
i6=j
r−i,jα0
−1/α
. (4)
4.1.2. Average Hop Distance for Single Hop: Given the maximum hop distance, then the
average hop distance can be found. As mentioned before, the assumption was made that the D2D UEs are randomly and uniformly distributed. Let the Euclidean distance between source UE m
and destination UE m0 berm,m0. The probability density function (PDF) of the maximum single
hop distance ε presented as Eq. 5 is given by [23]. The mean hop distance for each single hop under these assumptions is therefore1:
rj,j0 =E[ε] =
Z R(ro,j0)
0
εfε,rm,m0(ε)dε, (6)
subject to the maximum hop distanceRconstraint given in Eq.(4).
4.2. Success Probability for Single Hop D2D
The assumption is made that the interference distances are always greater than the D2D transmis-sion distance. This is reasonable given that the BS is farther compared with the distance of a D2D hop, and that the interfered D2Ds are located in neighbouring BSs. The success probability at the 1There is an assumption that there are minor interference differences in the D2D relay UEs at different locations because the interference in the
k-th hop is defined as (see Section 7.2).
Pk =P[γ > ξ]
= exp
−βD2Drj,jα 0PBSλBSr−o,jα0 −
PBSλBS
PD2DλD2D
rαj,j0
"
πΛBSΞ(ro,j0,Ψ,4)
2erfc−1(0.5) #2
−Λ0D2Dπri,j2 0Q(ξ, α)
,
(7) where βD2D = 1/PD2DλD2D. The parameter Λ0D2D = ND2D0 /πR2BS is the density of co-frequency
D2D UEs and should not be confused with ΛD2D, which is the density of potential D2D UEs in
existence. The parameterri,j0 is the distance of a hop andξis the minimum data connectivity SINR
threshold for realistic modulation and coding schemes (MCS). TheQ()function is given by:
Q(ξ, α) =
Z +∞
ξ−2/∞
ξ2/α
1 +uα/2du
=pξarctan(pξ) forα= 4.
(8)
4.3. Success Probability for multi-hop SPR Scheme
The success probability calculation is given in Algorithm 1 Success Probability.
Algorithm 1Success Probability
1: procedurePROBABILITYPSPR (ro,m, ro,m0, θ, ξ)
2: ifγ(ro,m)≥ξthen% The 1st hop SINR requirement 3: The distance to the BS is assumedro,j0 =ro,j 4: Max. rangeR(ro,m)from (4)
5: The hop forward distancerj,j0 from (6) 6: The probabilityPSPR,1from (8) and (10) 7: From the second hop to thek-th hop 8: whiledestination nodem0not reached do 9: The distance to the BSro,j0(k)from (9) 10: Max. rangeR(ro,j0(k))from (4)
11: The hop forward distancerj,jSPR0(k)from (9) 12: The probabilityPSPR,k from (8) and (10)
13: end while
14: end if
15: PSPR =Qkk=1PSPR,k 16: end procedure
Eq.4 and Eq.6 as:
rj,jSPR0(k) =
Z R[ro,j0(k)]
0
εfε,r
m,m0(ε)dε
ro,j0(k) =
r
r2
o,m+
X (.)
2
−2ro,m
X
(.) cosθ0
where X(.) =
KSPR
X
1
rj,jSPR0(k−1)
and cosθ0 = r 2
o,m+r2m,m0−ro,m2 0
2ro,mrm,m0 ,
(9)
where the hop distance is relatively short such that the assumption isro,j0 ≈ro,j, soro,j0 =ro,m.
From Eq. 7, the success communication probability for the multi-hop SPR at thek-th hop is:
PSPR,k = exp
−(r
SPR
j,j0(k)
ro,j0(k)
)α( PBS
PD2D
)
− PBS
PD2D
[rj,jSPR0(k)]α "
πΛBSΞ(ro,j0(k),Ψ,4)
2erfc−1(0.5) #2
−(r
SPR
j,j0(k)
RBS
)2ND2D0 Q(ξ, α)
,
(10)
where the D2D shares the band link with the BS, so that the frequency dependent pathloss constant
λBS =λD2D. It can be seen that the success probability is a function of the distance from the closest
BS to the relay UEj (ro,j0).
When there is a high density of D2D UEs available, the resulting multi-hop path is approximated a straight line betweenm andm0. So the total hop distance is the Euclidean distance between m
and m0: rm,m0 = q
r2
o,m+ro,m2 0 −2ro,mro,m0cosθ. Therefore the total number of hops is KSPR
satisfied:
rm,m0 =
KSPR
X
k=1
rSPRj,j0(k). (11)
Given that the successful probability of a multi-hop transmission is the product of the success at each link, the overall success probability is therefore:
PSPR =
KSPR
Y
k=1
PSPR,k. (12)
1 0.9
Distance Ratio r
o,m/RBS
0.8 0.7 0.6 0.5 0.4 0.3 0.2 0.1 0 0 0.1 0.2
Distance Ratio r
o,m'/R BS 0.3 0.4 0.5 0.6 0.7 0.8 0.9 0.9 1 0.1 0 0.2 0.3 0.4 0.5 0.6 0.7 0.8 1 Success Probability
θ=2π/3
1 0.9
Distance Ratio r
o,m/RBS
0.8 0.7 0.6 0.5 0.4 0.3 0.2 0.1 0 0 0.1
Distance Ratio r
o,m'/R BS 0.2 0.3 0.4 0.5 0.6 0.7 0.8 0.9 0.6 0.1 0.8 0 0.2 0.3 0.9 0.7 1 0.4 0.5 1 Success Probability
θ=π/6
1 0.9
Distance Ratio r
o,m/RBS
0.8 0.7 0.6 0.5 0.4 0.3 0.2 0.1 0 0 0.1
Distance Ratio r
o,m'/R BS 0.2 0.3 0.4 0.5 0.6 0.7 0.8 0.9 0.5 0.4 0.3 0.2 0.1 0 0.7 1 0.9 0.8 0.6 1 Success Probability
θ=π/3
1 0.9
Distance Ratio r
o,m/RBS
0.8 0.7 0.6 0.5 0.4 0.3 0.2 0.1 0 0 0.1
Distance Ratio r
o,m'/R BS 0.2 0.3 0.4 0.5 0.6 0.7 0.8 0.9 0.9 1 0 0.3 0.1 0.4 0.5 0.2 0.6 0.7 0.8 1 Success Probability
θ=π/12
Fig. 2. The success probability of SPR D2D at different locations: xandy axes are the distance ratio scale ofro,mandro,m0 toRBS.
4.4. Success Probability for IAR Scheme
As mentioned previously, there are three mainstagesto the IAR algorithm: (1) Escape, (2) Migrate and (3) Return. Eachstageof the IAR utilizes the aforementioned SPR algorithm, and the success probability for each IAR stage can be derived from Eq. 10 and Eq. 12.
4.4.1. Stage 1: Escape: For the first multi-hop stage (IAR(1)), the source UEm attempts to
use SPR to transmit to the nearest point on the cell-edge, so the total routing distance for this stage is RBS−ro,m
. At the k-th hop, the distance from the BS to the relay UE is: ro,j0(k) = ro,m+Pk2rj,jIAR0(1)(k−1), where the average hop distance for each singlek-th hop isr
IAR(1)
j,j0 (k) = RR[ro,j0(k)]
0 εfε,rm,m0(ε)dεand ro,j0(1) = ro,m. From Eq. 10, the probability of success at thek-th
hop in this stage is:
PIAR(1),k = exp
−( r
IAR(1)
j,j0 (k)
ro,m+
Pk
2r IAR(1)
j,j0 (k−1)
)α( PBS
PD2D
)
− PBS
PD2D
[rj,jIAR0(1)(k)]α
πΛBSΞ(ro,m+r
IAR(1)
j,j0 (k),Ψ,4)
2erfc−1(0.5)
2
−(r
IAR(1)
j,j0 (k)
RBS
)2ND2D0 Q(ξ, α)
,
(13)
The total number of hops in the first stage is KIAR(1), whereRBS−ro,m =
PKIAR(1)
k=1 r IAR(1)
j,j0 (k).
Therefore the success probability for the entireEscapestage isPIAR(1) ≈
QKIAR(1)
[image:11.612.116.492.75.344.2]1 0.9
Distance Ratio r
o,m /RBS 0.8 0.7 0.6 0.5 0.4 0.3 0.2 0.1 0 0 0.1 0.2
Distance Ratio r
o,m/R BS 0.3 0.4 0.5 0.6 0.7 0.8 0.9 1 0 0.1 0.2 0.3 0.4 0.5 0.6 0.7 0.8 0.9 1 Success Probability
θ=2π/3
1
Distance Ratio r
o,m /RBS 0.9 0.8 0.7 0.6 0.5 0.4 0.3 0.2 0.1 0 0 0.1
Distance Ratio r
o,m'/R BS 0.2 0.3 0.4 0.5 0.6 0.7 0.8 0.9 1 0 0.1 0.2 0.3 0.4 0.5 0.6 0.7 0.8 0.9 1 Success Probability
θ=π/6
1 0.9
Distance Ratio r
o,m /RBS 0.8 0.7 0.6 0.5 0.4 0.3 0.2 0.1 0 0 0.1
Distance Ratio r
o,m'/R BS 0.2 0.3 0.4 0.5 0.6 0.7 0.8 0.9 1 0 0.1 0.2 0.3 0.4 0.5 0.6 0.7 0.8 0.9 1 Success Probability
θ=π/3
1 0.9
Distance Ratio r
o,m /RBS 0.8 0.7 0.6 0.5 0.4 0.3 0.2 0.1 0 0 0.1
Distance Ratio r
o,m'/R BS 0.2 0.3 0.4 0.5 0.6 0.7 0.8 0.9 1 0 0.1 0.2 0.3 0.4 0.5 0.6 0.7 0.8 0.9 1 Success Probability
θ=π/12
Fig. 3. The success probability of IAR D2D at different locations: x andyaxes are the distance ratio scale ofro,mandro,m0 toRBS.
4.4.2. Stage 2: Migrate: For the second multi-hop stage (IAR(2)), the route is from the
cell-edge UE closest to source to another cell-cell-edge UE that is closest to the destination. At any given point along the route, the distance from the BS to any of the relay UEs is approximatelyRBS(i.e.
the cell coverage area is modelled as a circle). The total hops distance for the stage is θ×RBS.
Therefore, the average hop distance through the stage isrj,jIAR0(2)(k) =
RR(RBS)
0 εfε,rm,m0(ε)dε. From
Eq. 10, the probability of success for each hop is:
PIAR(2),k = exp
−( r
IAR(2)
j,j0
θ×RBS
)α( PBS
PD2D
)
− PBS
PD2D
[rIARj,j0(2)]α
πΛBSΞ(θ×RBS,Ψ,4)
2erfc−1(0.5)
!2
−(r
IAR(2)
j,j0
RBS
)2ND2D0 Q(ξ, α)
.
(14)
The total number of hops in the second stage in the IAR algorithm isKIAR(2) = (θ×RBS)/r IAR(2)
j,j0 .
Therefore the success probability of the entireMigratestage isPIAR(2) ≈Q
KIAR(1)
k=1 PIAR(2),k.
4.4.3. Stage 3: Return: For the third multi-hop stage, it is a multi-hop from the boundary
relay UE back to the destination UE so the distance from BS to the k-th hop UE is: ro,j0(k) =
RBS −
Pk
2r IAR(3)
j,j0 (k −1),where the hop forward distance for each single hop through the entire
IAREscapestage isrj,jIAR0(3)(k) =
RR[ro,j0(k)]
0 εfε,rm,m0(ε)dεandro,j0(1) =RBSandro,j0 =RBS. The
[image:12.612.116.494.70.342.2]Distance (m)
-600 -400 -200 0 200 400 600
Distance (m)
-600 -400 -200 0 200 400 600
BS UEs
UEs with Random Walk
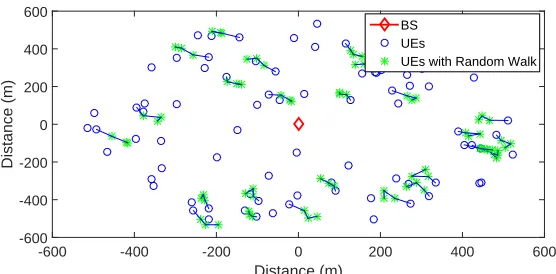
Fig. 4. A snapshot of the simulation setup consisting of D2D UEs moving inside the coverage area of a single BS.
k-th hop is:
PIAR(3),k = exp
−( r
IAR(3)
j,j0 (k)
RBS−
Pk
k=2r IAR(3)
j,j0 (k−1)
)α×( PBS
PD2D
)− PBS
PD2D
[rIARj,j0(3)(k)]α
×
πΛBSΞ(RBS−Pk2rIAR
(3)
j,j0 (k−1),Ψ,4)
2erfc−1(0.5)
2
−(r
IAR(3)
j,j0 (k)
RBS
)2ND2D0 Q(ξ, α)
,
(15)
The total number of hops in the third stage in the IAR algorithm is KIAR(3) where RBS −
ro,m0 =P
KIAR(3)
k=1 r IAR(3)
j,j0 (k). Therefore, success probability for the entire stageReturnisPIAR(3) ≈ QKIAR(3)
k=1 PIAR(3),k.
4.4.4. Synthesis: The overall success probability from source D2D user to destination D2D
user by IAR is:
PIAR = 3 Y
i=1
PIAR(i), (16)
and the total number of hops is: KIAR= P3
i=1KIAR(i).
Fig. 3 shows the theoretical success probability of D2D UEs in different locations employing the IAR algorithm. Compared with the SPR algorithm shown previously in Fig. 2, the angleθfor IAR is not a significant effect parameter, whereas the distances of the source and destination UEs to the BS are. Generally the IAR has better performance of success probability than SPR for D2D routes that are of longer distance and are further away from the BS. In terms of distance from the BS of the source or destination UEs, the greater the distance the stronger the success probability, which means that D2D communications should be avoided close to the BS.
5. Results and Analysis
[image:13.612.166.444.77.214.2]Distance between UE m and m' (m)
100 200 300 400 500 600 700 800 900
Number of hops
4 6 8 10
100 200 300 400 500 600 700 800 900
4 6 8
10 Theoretical Prediction of IAR
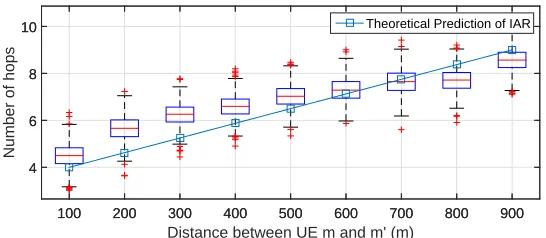
(a) The theoretical number of hops for IAR compared with box plot simulation results.
Distance between UE m and m' (m)
100 200 300 400 500 600 700 800 900
Number of hops
2 4 6 8 10
100 200 300 400 500 600 700 800 900
2 4 6 8
10 Theoretical Prediction of SPR
(b) The theoretical number of hops for SPR compared with box plot simulation results.
Fig. 5. The theoretical number of hops for IAR and SPR routing schemes compared with the box plot plot of their simulation results.
Random Walk model is added to the simulation to model user mobility (each circle represents a new position of the user with connecting lines to show the movement trace). Within that set of UEs, a source and destination UEs are randomly selected. The specific system and propagation parameters are in accordance to Table 1.
5.1. Number of Hops
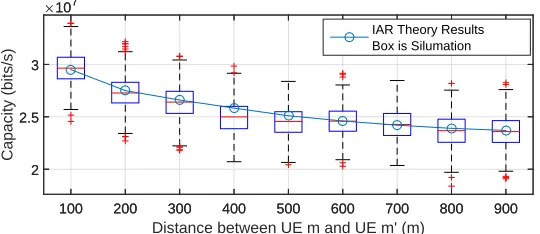
[image:14.612.168.441.76.195.2]Distance between UE m and UE m' (m)
100 200 300 400 500 600 700 800 900
Capacity (bits/s)
×107
2 2.5 3
100 200 300 400 500 600 700 800 900
×107
2 2.5 3
IAR Theory Results Box is Silumation
(a) The theoretical capacity for IAR compared with box plot simulation results.
Distance between UE m and UE m' (m)
100 200 300 400 500 600 700 800 900
Capacity (bits/s)
×107
1.8 2 2.2 2.4 2.6 2.8 3
100 200 300 400 500 600 700 800 900
×107
1.8 2 2.2 2.4 2.6 2.8
3 SPR Theory Results
Box is Simulatiuon
(b) The theoretical capacity for SPR compared with box plot simulation results.
Fig. 6. The comparative theoretical capacity for IAR and SPR routing schemes (box plot of their simulation results).
5.2. Network Capacity
For the Shannon theory, the network capacity at each hop link related to SINR, which is:
Ck=Blog2 1 +ro,j0, (17)
whereC is the network capacity atk-th hop, andB is the network bandwidth. By using the SINR values found previously for SPR and IAR schemes, one can find the associated capacity values.
[image:15.612.171.441.78.195.2]Min. Distance between BS and Source or Destination UE
100 150 200 250 300 350 400 450 500
Success Probability
0 0.1 0.2 0.3 0.4 0.5 0.6 0.7 0.8 0.9 1
IAR Theory IAR Simulation SPR Theory SPR Simulation
θ=0.62π θ= 0.63π
θ=0.31π
θ=0.32π
Fig. 7. Compression of success probability with theory (line) and simulation (symbol) as a function of the minimum distance from BS to one of the source and destination UEs: min[ro,m, ro,m0].
5.3. Communication Success Probability
The communication success probability as a function of the minimum distance from BS to one of the source and destination UEs is now considered, and the effect of angleθis also observed. Fig. 7 shows the simulation results (symbols) and theory (lines), and there is good agreement between the theory and simulation results.
The first observation is that both the SPR and IAR can achieve a high success probability (≥ 70%) if certain spatial conditions are met. For SPR, the spatial conditions are: (1) the source or destination UE is far from the closest BS, and (2) there is a small incident angleθin order to avoid the possibility of routing close to the closest interfering BS. For IAR, there is only one condition and that is the source or destination UE is far from the closest BS. If both of these scenarios are met, then the performance of SPR and IAR are approximately equal and that makes intuitive sense as the route is also similar. The angle θ between two UEs does not affect IAR communications, as shown in Fig. 7. For SPR, the angle can affect the success probability dramatically, as shown in Fig. 7. This is consistent with results from earlier in the paper (see Fig. 2 and Fig. 3). This is primarily because for SPR, the interference from the BS will be excessive, whereas for IAR, the routing path will always be at maximum distance from the BS, minimizing interference.
It was found that the IAR scheme can improve both the D2D transmission success by from 14% to 18%, but will incur up to 20% more UEs to participate, which can incur privacy concerns. The privacy issue is beyond the scope of this paper.
5.4. Operational Zones and Offloaded Traffic Volume
We guarantee QoS through operation zones. These are spatial zones, whereby only one type of transmission is permitted to guarantee QoS for other users in the network. In Fig. 8, we show D2D operational zones for different transmission strategies. The operation zone is closely related to the base station coverage area, whereby the zones have a sectorized shape and are defined with an angle of∠mom0 and the distance ratio of the D2D UEs to the BS.For example, in zone 5, the distance ofmandm0both bigger than the0.45RBSand the∠mom0 < π/2. So the IAR is selected as a routing algorithm. The full list of operation zone scenarios are as follows:
[image:16.612.171.446.73.191.2]0 Distance ratio ( ro,m= ro,m’)/RBS
1
0.45 IAR Operational zone
D2D forbidden area Max Angle θ
Condition
⑤𝜋2
0.45
Distance ratio
0.59 0.74 0.85 0.90 0.45-1.0
Zone 1 Zone 2 Zone 3 Zone 4
Zone 5
0 Distance ratio ( ro,m> ro,m’)/RBS
1
0.45 IAR Operational zone
Max Angle θ Condition
⑤7𝜋12
D2D forbidden area 0.48
0.67 0.83 0.45-1.0
0.45
Distance ratio
Zone 1 Zone 2 Zone 3 Zone 4
Zone 5
Fig. 8. The interference routing algorithm in a cell with the distance ratio scale ofro,m andro,m0
toRBS.
• IAR:when the source and destination UEs are located far apart such that the angle is greater thanπ/2with the distance ratioro,m/RBS=ro,m0/RBSfor far from BS or the angle is greater
than5π/12with the distance ratioro,m/RBS > ro,m0/RBS, and greater thanπ/4for medium
distance from BS; IAR should be used as a preference algorithm. If the UEs are any closer then SPR may be preferable.
• SPR:when the source and destination UEs are located in close proximity such that the angle
0≤θ ≤π/6; SPR should be used as a preference D2D routing algorithm. If the UEs are any further then IAR may be preferable.
In summary, for the IAR algorithm, it is generally preferable if the source and destination UEs are far from the BS and the separation distance or angle is not less thanπ/6. The effect of the angle is not significant beyond this basic constraint. More than 70% of UEs in a cell fit this category. For SPR, the effect of angle is paramount, especially when the distance between the UEs is not small. Hence, SPR is only feasible for D2D communications between relatively nearby UEs, or those that already sit on the edge of the BS’s coverage area. By knowing the source and destination UEs’ locations, the appropriate routing algorithm can be devised as a operational zone. The UEs are distributed as a Poisson distribution in the network, the total traffic rate offloaded from the cellular network is the ratio of the area of operation zone to the area of the BS. The maximum of the offload traffic from the BS isOSPR = ASPRABS for SPR and OIAR = AIARABS for IAR. The parameterAIAR is the
operation area for the IAR and ASPR is the operation area for the SPR, and ABS is the area size
of BS. Therefore, the maximum offload traffic ratio from BS is 79.75% and the ratio for IAR is 49.985% and for SPR is 29.765%.
6. Conclusions
[image:17.612.89.523.79.228.2]is selected to minimise cross-tier interference.
Several key discoveries have been presented in this paper. Firstly, a longer routing path that minimises cross-tier interference can achieve a superior performance compared to the intuitive shortest path route. We also employ spatial operation envelopes to define where IAR and SPR D2D algorithms should be utilised and where D2D should be avoided all together. This is our second discovery, which is that there are clear geometric regions in the macro-cell coverage area that determine the D2D operations. In terms of performance metrics, it was found that the negative effect of D2D routing on regular cellular communications (CC) is negligible (1% to 2% degrada-tion), and D2D communications can improve the CC network capacity by 44% for the SPR and 50% for the IAR routing scheme. When considering the D2D tier in isolation, the improvement of IAR over SPR is approximately 10% in capacity and 14% in outage probability. This demonstrates that careful cross-tier interference avoidance can yield productive improvements both within the D2D transmissions, but also for the conventional cellular links. Furthermore, we employ dynamic selection between the different D2D routing algorithms and CC, enabling the network to offload 79.75% of the traffic volume from the assisting BS.
7. Appendices
7.1. The D2D UEs maximum transmission distance
As the minimum SINR required by QoS, data communication SINR threshold at the receiver D2D is theξ, so the maximum transmission distance is:
Hj,j0PD2DλD2D[R(ro,j0)]−α
W +IBS(ro,j0) + P
i∈Φ
i6=j
Hi,j0PD2DλD2Dr−α
i,j0
≥ξ,
(18)
where theIBS(ro,j0)is shown in Eq. 3. Without considering instantaneous fading and the Gaussian
noise effects, theRis:
PD2DλD2D[R(ro,j0)]−α
IBS(ro,j0) + P
i∈Φ
i6=j
PD2DλD2Dr−i,jα0
≥ξ,
[R(ro,j0)]α ≤
PD2DλD2D
ξIBS(ro,j0) +ξP
i∈Φ
i6=j
PD2DλD2Dr−i,jα0
(19)
arg max{R(ro,j0)}=
PD2DλD2D
ξIBS(ro,j0) +ξP
i∈Φ
i6=j
PD2DλD2Dr−i,jα0
1/α =
ξIBS(ro,j0) +ξP
i∈Φ
i6=j
PD2DλD2Dr−i,jα0
PD2DλD2D
−1/α
=
ξIBS(ro,j0)
PD2DλD2D
+ξX
i∈Φ
i6=j
ri,j−α0
−1/α .
(20)
7.2. Single hop Success communication probability
Success probability of the D2D transmission is definedP[SINR> ξ]. Defininggj,j0 =Hj,j0PD2DλD2D
andID2D ri,j0, Hi,j= P
i∈Φ
i6=j
Hi,j0PD2DλD2Dr−α
i,j0, the probability is:
PSuccess =P "
gj,j0r−α
j,j0
IBS(ro,j0) +ID2D ri,j0, Hi,j
> ξ #
=P
gj,j0 > rj,jα 0
h
IBS(ro,j0) +ID2D ri,j0, Hi,j
i
=
Z +∞
0
Z +∞
ζ
fG(g)fR(ID2D|ri,j)dgdID2D,
(21)
where ζ = rα j,j0
IBS(ro,j0) +ID2D ri,j0, Hi,j
. The multipath fading has a PDF of fG(g) ∼ exp(β)whereβD2D = 1/PD2DλD2D andfR(ID2D|ri,j)is the joint interference distribution. Apply-ing the fadApply-ing distribution:
PSuccess =exp h
−βD2Drj,jα 0IBS(ro,j0)
iZ +∞
0
fR(ID2D|ri,j)e
−βD2Drα
i,j0ID2D(ri,j0,Hi,j)
dID2D
=exp
h
−βD2Drj,jα 0IBS(ro,j0) i
LβD2Drαi,j0
,
(22)
The Laplace transform of the interference signal power by D2D UEs is:
LβD2Dri,jα0
=
Z +∞
ri,j0
Z +∞
0
exp
−X
i∈Φ
i6=j
βD2Drαgiri,j−α0
fG(gi)fR(ri,j0)dgidri,j0
=
Z +∞
ri,j0
Z +∞
0
Y
i∈Φ
i6=j
exp−βD2Drαgiri,j−α0
fG(gi)fR(ri,j0)dgidri,j0
= exph−Λ0D2Dπri,j2 0Q(ξ, α)i,
(23)
where the D2D is distributed as a Poisson point distribution, and Λ0D2D is the intensity of the co-frequency D2D UEs. TheQ(ζ, α)function is:
Q(ξ, α) =
Z +∞
ξ−2/∞
ξ2/α
1 +uα/2du
=pξarctan(pξ) forα= 4.
(24)
Substituting in the expressions forL(βD2Drαi,j0)in Eq.23 andIBS(ro,j0)in Eq.3 of Appendix A,
into Eq.22 gives the success communication probability for any single hop as:
PSuccess = exp
−βD2Drj,jα 0PBSλBSr−o,jα0 −
PBSλBS
PD2DλD2D
rαj,j0
"
πΛBSΞ(ro,j0,Ψ,4)
2erfc−1(0.5) #2
−Λ0D2Dπri,j2 0Q(ξ, α)
.
(25)
8. References
[1] X. Lin, J. Andrews, A. Ghosh, and R. Ratasuk, “An overview of 3GPP Device-to-Device proximity services,”IEEE Communications Magazine, vol. 52, no. 4, pp. 40–48, May 2014. [2] D. Feng, L. Lu, Y. Yi, G. Li, G. Feng, and S. Li, “Device-to-Device communications
under-laying cellular networks,”IEEE Transactions on Communications, vol. 61, no. 8, pp. 3541– 3551, Aug. 2013.
[3] P. Phunchongharn, E. Hossain, and D. I. Kim, “Resource allocation for Device-to-Device communications underlaying lte-advanced networks,” IEEE Wireless Communica-tions, vol. 20, no. 4, pp. 91–100, Aug. 2013.
[4] M. Simsek, A. Merwaday, N. Correal, and I. Guvenc, “Device-to-Device Discovery Based on 3GPP System Level Simulations,” inIEEE Global Communications Conference (Globecom), Atlanta, Jun. 2013, pp. 555 – 560.
[6] B. Bai, L. Wang, Z. Han, W. Chen, and T. Svensson, “Caching based socially-aware D2D communications in wireless content delivery networks: a hypergraph framework,” IEEE Wireless Communications, vol. 23, no. 4, pp. 74–81, 2016.
[7] L. Wang, H. Tang, and M. Cierny, “Device-to-device link admission policy based on social interaction information,” IEEE Transactions on Vehicular Technology, vol. 64, no. 9, pp. 4180–4186, 2015.
[8] A. Bhorkar, M. Naghshvar, T. Javidi, and B. Rao, “Adaptive opportunistic routing for wireless Ad Hoc networks,”IEEE/ACM Transactions on Networking, vol. 20, no. 1, pp. 243–256, Feb. 2012.
[9] Y. Duan, C. Li, C. Guo, Z. Liu, L. Zhu, X. Fei, and S. Ullah, “Finding the shortest path in huge data traffic networks: A hybrid speed model,” in 2015 IEEE International Conference on Communications (ICC). IEEE, 2015, pp. 6906–6911.
[10] Z. Chang and T. Ristaniemi, “Efficient use of multicast and unicast in collaborative OFDMA mobile cluster,” inIEEE Vehicular Technology Conference, Dresden, Jun. 2013, pp. 1–5. [11] W. Guo and I. J. Wassell, “Capacity-Outage-Tradeoff for cooperative networks,”IEEE
Jour-nal on Selected Areas in Communications (JSAC), vol. 30, no. 9, pp. 1641–1648, Oct. 2012. [12] J. Sachs, I. Maric, and A. Goldsmith, “Cognitive Cellular Systems within the TV Spectrum,”
inIEEE New Frontiers in Dynamic Spectrum (DYSPAN), Singapore, 2010, pp. 1–12.
[13] S. P. Hyunkee Min, Jemin Lee and D. Hong, “Capacity enhancement using an interference limited area for Device-to-Device uplink underlaying cellular networks,”IEEE Transactions on Wireless Communications, vol. 10, no. 12, pp. 3395–4000, Dec. 2011.
[14] H. Yuan, W. Guo, and S. Wang, “Emergency route selection for D2D cellular communica-tions during an urban terrorist attack,” inIEEE International Conference on Communications Workshops (ICC), Sydney, Jun. 2014, pp. 237–242.
[15] Q. Du, H. Song, Q. Xu, P. Ren, and L. Sun, “Interference-controlled d2d routing aided by knowledge extraction at cellular infrastructure towards ubiquitous cps,” Personal and Ubiq-uitous Computing, vol. 19, no. 7, pp. 1033–1043, 2015.
[16] L. Zhu, C. Li, Y. Wang, Z. Luo, Z. Liu, B. Li, and X. Wang, “On stochastic analysis of greedy routing in vehicular networks,” IEEE Transactions on Intelligent Transportation Systems, vol. 16, no. 6, pp. 3353–3366, 2015.
[17] Q. Xu, P. Ren, H. Song, and Q. Du, “Security enhancement for iot communications exposed to eavesdroppers with uncertain locations,”IEEE Access, vol. 4, pp. 2840–2853, 2016. [18] Y. Wu, W. Guo, H. Yuan, L. Li, S. Wang, X. Chu, and J. Zhang, “Device-to-Device (D2D)
meets LTE-Unlicensed,”IEEE Communications Magazine, vol. 54, no. 5, pp. 154–159, 2016. [19] M. Haenggi, Stochastic Geometry for Wireless Networks. England, UK: Cambridge Uni.
Press, 2012.
[21] 3GPP, “Further advancements for E-UTRA physical layer aspects (rel.9),” 3GPP TR36.814v9, Technical Report, Mar. 2010.
[22] K. J. Zou, M. Wang, K. W.Yang, J. Zhang, W. Sheng, Q. Chen, and X. You, “Proximity discovery for Device-to-Device communications over a cellular network,” IEEE Communi-cations Magazine, vol. 52, no. 6, pp. 98 – 107, 2014.
[23] S. De, “On hop count and euclidean distance in greedy forwarding in wireless ad hoc net-works,”IEEE Communications Letters, vol. 9, no. 11, pp. 1000–1002, Nov. 2005.


![Fig. 7. Compression of success probability with theory (line) and simulation (symbol) as a functionof the minimum distance from BS to one of the source and destination UEs: min[ro,m, ro,m′].](https://thumb-us.123doks.com/thumbv2/123dok_us/9449493.452118/16.612.171.446.73.191/compression-success-probability-simulation-functionof-minimum-distance-destination.webp)

