warwick.ac.uk/lib-publications
Original citation:
Robin, Mathew P., Osborne, Shani A. M., Pikramenou, Z., Raymond, Jeffery E. and O’Reilly, Rachel K.. (2016) Fluorescent block copolymer micelles that can self-report on their
assembly and small molecule encapsulation. Macromolecules, 49 (2). pp. 653-662. 5b02152.
Permanent WRAP URL:
http://wrap.warwick.ac.uk/78231
Copyright and reuse:
The Warwick Research Archive Portal (WRAP) makes this work of researchers of the University of Warwick available open access under the following conditions.
This article is made available under the Creative Commons Attribution 4.0 International license (CC BY 4.0) and may be reused according to the conditions of the license. For more details see: http://creativecommons.org/licenses/by/4.0/
A note on versions:
The version presented in WRAP is the published version, or, version of record, and may be cited as it appears here.
Fluorescent Block Copolymer Micelles That Can Self-Report on Their
Assembly and Small Molecule Encapsulation
Mathew P. Robin,
†Shani A. M. Osborne,
‡Zoe Pikramenou,
‡Je
ff
ery E. Raymond,
§and Rachel K. O
’
Reilly
*
,††Department of Chemistry, University of Warwick, Gibbet Hill Road, Coventry CV4 7AL, U.K. ‡School of Chemistry, The University of Birmingham, Edgbaston B15 2TT, U.K.
§Department of Chemistry and Laboratory for Synthetic-Biologic Interactions, Texas A&M University, College Station, Texas
77842-3012, United States
*
S Supporting InformationABSTRACT: Block copolymer micelles have been prepared with a dithiomaleimide (DTM) fluorophore located in either the core or shell. Poly(triethylene glycol acrylate)-b-poly(tert -butyl acrylate) (P(TEGA)-b-P(tBA)) was synthesized by RAFT polymerization, with a DTM-functional acrylate monomer copolymerized into either the core forming P(tBA) block or the shell forming P(TEGA) block. Self-assembly by direct dissolution afforded spherical micelles withRhofca. 35 nm. Core-labeled micelles (CLMs) displayed bright emission (Φf = 17%) due to good protection of the fluorophore,
whereas shell-labeled micelles (SLMs) had lower efficiency emission due to collisional quenching in the solvated corona. The transition from micelles to polymer unimers upon dilution could be detected by measuring the emission intensity of the solutions. For the core-labeled micelles, thefluorescence lifetime was also responsive to the supramolecular state, the lifetime being significantly longer for the micelles (τAv,I= 19 ns) than for the polymer unimers (τAv,I= 9 ns). The core-labeled micelles could also self-report on the presence of afluorescent hydrophobic guest molecule (Nile Red) as a result of Förster resonance energy transfer (FRET) between the DTM fluorophore and the guest. The sensitivity of the DTM fluorophore to its environment therefore provides a simple handle to obtain detailed structural information for the labeled polymer micelles. A case will also be made for the application superiority of core-labeled micelles over shell-labeled micelles for the DTMfluorophore.
■
INTRODUCTIONThe use of fluorescent nanoparticles as imaging agents is an increasingly important topic in the field of bioimaging.1 The utility offluorescence spectroscopy as a detection method for cellular imaging arises from the sensitivity of the technique, as well as the ability to discriminate based on both intensity and wavelength of emission. Fluorescent nanoparticles provide additional advantages over molecular organic fluorophores, including a reduction in fluorophore aggregation, reduced cytotoxicity, improved microenvironment inertness, better stability, and increased brightness.1,2 Nanoparticles derived from silica and gold, as well as quantum dots and carbon dots, have all been utilized asfluorescent imaging agents.3However, polymer nanoparticles perhaps provide the greatest scope for versatility in particle properties and composition, such as hydrophobicity/hydrophilicity, surface chemistry, and analyte/ cargo transport.4 Additionally, polymer nanoparticles can be designed to respond to a range of external stimuli, including temperature, pH, oxidation/reduction, biomolecules, and light.5,6 It is particularly desirable, in the case of fluorescent particles, if this response can be coupled to a change in emission.7 Encapsulation of organic dyes within polymer
nanoparticles can provide such information. For example both hydrophobic and hydrophilic dyes can be used to detect morphology changes in block copolymer (BCP) solution state self-assemblies.8However, the covalent attachment, rather than physical absorption, of dye molecules to polymer nanoparticles has the advantage of greater efficiency, decreased dye leaching from the nanoparticles and eliminates uncertainties regarding thefluorophore location.9Covalent labeling can be applied to a range of synthetic methodologies,10such as nanoprecipitation11 and BCP self-assembly,12,13 and can also be applied to the synthesis of polymer nanogels,14 conjugated polymer nano-particles,15 and dendrimers.16 Synthetic diversity is also increased by the potential for dye incorporation using
fluorescent monomers and/or initiators during polymer synthesis17or by subsequent particle modification.18
Covalent attachment offluorophores to BCPs has long been exploited to provide a wealth of information about the BCP self-assembled state in model systems, for example via excimer
Received: September 29, 2015 Revised: December 11, 2015 Published: January 6, 2016
Article
pubs.acs.org/Macromolecules
© 2016 American Chemical Society 653 DOI: 10.1021/acs.macromol.5b02152
Macromolecules2016, 49, 653−662
emission, FRET measurements, andfluorescence lifetimes.19−22 More recently, this self-assembly information has also been collectedin vitroandin vivo.23For example, the aggregation of dye labeled polymers can cause quenching processes to be enhanced or inhibited, leading upon micellization to decreased or increased emission, respectively.24,25 The degradation of polymer micelles derived from intrinsically fluorescent copolymers has also been observed by detecting a decrease in emission,26 while the loss of mobility upon BCP micelle gelation has allowed for the glass transition temperature and critical micelle temperature to be measured by changes in emission from a covalently attachedfluorophore.27Changes in the morphology of BCP assemblies can also be observed by measuring emission fromfluorescent labels. For example, the swelling of micelle coronas in response to temperature and pH can be detected due to the effect onfluorophore quenching or excimer formation caused by changes in coronal hydration.28,29 The controlled assembly and disassembly of BCP nano-particles in response to a stimulus can also be detected by measuring the emission of covalently attached fluorophores. For example, Gaoet al.have developed a series of “ ultra-pH-sensitive” BCP nanoparticles, where the core block is labeled with a self-quenchingfluorophore. The core block comprises of pH-responsive poly(aminomethacrylates), and protonation of this block causes a transition from hydrophobic to hydrophilic, leading to micelle disassembly.30−33 Micelle disassembly can therefore be detected by increased emission, while the pH range for response can be tuned from pH 4−7.4 by tailoring the poly(aminomethacrylate) allowingin vitroandin vivodetection of disassembly in the early or late endosome, for example. This approach of detecting pH triggered BCP disassembly with a self-quenching dye can also be coupled with the use of a pH-responsive fluorophore in the hydrophilic block.34 In this example the pH-responsive dye emitted at a longer wavelength and was less emissive once protonated (which coincides with core block protonation and micelle disassembly), so that an enhanced signal was achieved by taking the ratio of emission at the two different wavelengths. In addition to pH, response of BCP micelles to temperature and the presence of metal ions has also been detected by fluorescence spectroscopy, using either dyes that respond to changes in aggregation or dyes whose emission changes upon binding to the metal ions.17,35−37 Recent work in our group has highlighted the utility of simple fluorophores based on substituted maleimides.38,39 These dithiomaleimide (DTM) fluorophores were easily incorporated into superbright nanoparticles via a one-pot emulsion polymerization40 and were also incorporated into BCP micelles whereby a change in emission enabled the detection of a micelle-to-vesicle morphology transition.41 Fluorescence lifetime imaging microscopy (FLIM) was also utilized to allow in vitro detection of micelle-to-unimer disassembly, asfluorophore protection from solvent collisional quenching in the assembled micelles led to longerfluorescence lifetimes, whereas the limited protection afforded to the polymer unimers resulted in a drastic reduction influorescence lifetime.42 For these self-reporting BCP micelles, the DTM
fluorophore was located at the interface between the core and coronal blocks, which required the use of a DTM-labeled asymmetric dual-functional initiator for ring-opening and reversible addition−fragmentation chain-transfer (RAFT) polymerization. In the present work we aim to simplify the synthetic route to obtain self-reporting fluorescent DTM-labeled BCP micelles by utilizing a DTM-DTM-labeled acrylate
monomer to allow BCP synthesis by sequential RAFT polymerizations. The greater versatility of this synthetic approach also allowed the position of the fluorophore to be varied, and we therefore also investigated the effect of locating thefluorophore in the micelle core or corona. This approach has enabled the simplified fabrication of highly emissive
fluorescent BCP micelles, whose fluorescent lifetime self-reports on the supramolecular assembled state, while the emission from the micelles can also report on the presence and location of an encapsulated organic dye.
■
EXPERIMENTAL SECTIONGeneral.tert-Butyl acrylate (tBA) was vacuum distilled over CaH2
prior to use and stored at 4 °C. 2,2′-Azobis(2-methylpropionitrile) (AIBN) was recrystallized twice from methanol and stored at 4°C in the dark. Triethylene glycol monomethyl ether acrylate (TEGA),43 and dithiomaleimide acrylate (DTMA),44 were synthesized as previously reported. The RAFT agent cyanomethyldodecyl trithiocar-bonate (CMDT), Nile Red (NR), and Rhodamine B (RhB) were purchased from Aldrich and used as received. 1,4-Dioxane for polymerizations (Fisher, reagent grade) was passed through a column of basic alumina immediately prior to the reaction. 1,4-Dioxane for FRET experiments (Aldrich, spectroscopy grade) was used as received. Solvents for size exclusion chromatography (Fisher, HPLC grade) were used as received. All other chemicals were purchased from Fisher or Aldrich and used as received. Water for self-assembly and spectroscopy was purified to a resistivity of 18.2 MΩ·cm using a Millipore Simplicity Ultrapure water system.
1H and 13C NMR spectra were recorded on a Bruker DPX-400
spectrometer in CDCl3 unless otherwise stated. Chemical shifts are
given in ppm downfield from the internal standard tetramethylsilane. Size exclusion chromatography (SEC) measurements were conducted using a Varian 390-LC-Multi detector suite fitted with differential refractive index (DRI), UV−vis, and photodiode array (PDA) detectors. A guard column (Varian Polymer Laboratories PLGel 5μm, 50 mm×7.5 mm) and two mixed D columns (Varian Polymer Laboratories PLGel 5μm, 300 mm×7.5 mm) were used. The mobile phase was tetrahydrofuran with 2% triethylamine or dimethylforma-mide with NH4BF4(5 mM) eluent at aflow rate of 1.0 mL/min. Data
were analyzed using Cirrus v3.3 with calibration curves produced using Varian Polymer Laboratories Easi-Vials linear poly(styrene) standards (162 g mol−1−240 kg mol−1) or linear poly(methyl methacrylate)
standards (690 g mol−1−790 kg mol−1). Transmission electron
microscopy (TEM) imaging was performed on a Jeol 2011 200 kV LaB6 instrument fitted with a Gatan UltraScan 1000 camera, using
Agar Graphene Oxide Support Film grids.
Light Scattering.Static light scattering (SLS) and dynamic light scattering (DLS) measurements were performed on an ALV CGS3 goniometer operating atλ= 632.8 nm. The temperature of the toluene bath was regulated using a Julabo F32-ME refrigerated and heating circulator set to 20 °C. Intensity autocorrelation functions (g2(q,t))
werefitted with the REPES routine using GENDIST software,45which performs an Inverse Laplace transformation to produce a distribution of relaxation times A(τ). An error of ±10% was applied to light scattering data, in accordance with previous reports.46Refractive index increment (dn/dc) was measured by injecting samples of a known concentration into a Shodex RI-101 refractive index detector. The response was calibrated using solutions of poly(styrene) in toluene.
An aggregation number (Nagg) for the particles can be calculated
according to eq 1, where Mw,polymer can be approximated by Mn
(calculated by1H NMR spectroscopy end-group analysis) multiplied
byĐM(calculated by SEC).
= N M M agg w,particle w,polymer (1)
Assuming that the micelle core is completely dehydrated, it is then possible to approximate the radius of the core (Rcore) from Nagg
sphere with radiusRcoreto the mass of the polymer core of the micelle
(Mw,core=Mn,core(NMR)×ĐM,core(SEC)), whose density is approximated
by the bulk density of the core-forming polymer (ρ= 1.00×10⁶g m−3 for PtBA).47
πρ = R N M N 4 3 core 3 agg w,core A (2)
Core volume (Vcore) can subsequently be calculated fromRcore, while
shell volume (Vshell) is calculated as the difference between total
micelle volume (from Rh) and Vcore. The approximate local
concentration of thefluorophore ([DTM]) in the SLMs and CLMs can then be calculated according toeqs 3and4, respectively.
= N DP
N V [DTM] agg DTMA
A shell (3)
= N DP
N V [DTM] agg DTMA
A core (4)
Fluorescence Spectroscopy.All steady state emission, excitation, and anisotropy spectra were obtained with a Horiba FluoroMax4 with automatic polarizers and analyzed in FluorEssence (Horiba) and OriginPro 8.6 (Origin Laboratories). A long-pass emissionfilter (λ= 360 nm) was used to eliminate the detection offirst- and second-order Rayleigh scattering. For the emission intensity measurements the full emission spectra was integrated using the Integrate function in OriginPro and normalized by dividing by the concentration of polymer. There were negligible changes in absorption at excitation wavelength. Time-correlated single photon counting (TCSPC) was employed to obtain allfluorescence lifetime spectra. This was done with a Fluorotime 100fluorometer and 405 nm solid state picosecond diode laser source (PicoQuant) in matched quartz 0.7 mL cells (Starna Cell). Instrument response functions (IRF) were determined from scatter signal solution of Ludox HS-40 colloidal silica (1% particles in water w/w). Analysis was performed on Fluorofit (PicoQuant). Fluorescence lifetime imaging was performed using a FLIM LSM upgrade kit for the FV1000 (PicoQuant) mounted on a FV1000 (Olympus) confocal microscope on a IX-81 inverted base (Olympus). A PlanApo N 60× oil lens (NA 1.42, Olympus) was used for all imaging. The FV1000 system was driven with the FV10-ASW v3.1a software platform (Olympus) with scan rates of 4μs/pixel at 256× 256 pixels. FLIM images and spectra were collected using bins of 16 ps with a 405 nm laser (LDH-P-C-405B, PicoQuant) driven at 2.5 MHz. The fwhm for the 405 nm laser head was 60 ps, and the maximum power was 0.21 mW (attenuated by variable neutral densityfilters to prevent count pileup and maintain counting rates below 1% bin occupancy). SymphoTime 64 (Picoquant) software was used for collection and analysis of FLIM images and spectra. All IRF deconvolved exponential fits were performed with the 3 or 4 exponents selected for completeness of fit as determined by boot-strap χ2 analysis in Fluorofit. Quantum yield experiments were performed on an Edinburgh Instruments FLS920 steady-state spectrometerfitted with an integrating sphere and a R928 (visible) Hamamatsu photomultiplier tube detection system. F900 spectrom-eter analysis software was used to record the data. Experiments were carried out in solution using 1 cm path length quartz cuvettes with four transparent polished faces.
Polymer Synthesis. P(tBA) (1).A solution of CMDT (0.282 g, 887μmol),tBA (5.00 g, 39.0 mmol), and AIBN (14.6 mg, 88.7μmol) in 1,4-dioxane (5.66 mL) was added to a polymerization ampule. The solution was degassed by three freeze−pump−thaw cycles and sealed under N2. The reaction was stirred at 65°C for 2 h and then quenched
by rapid cooling and exposure to air. The product was purified by repeated precipitation into ice-cold methanol/H2O (9/1, v/v) and
isolated as a yellow glassy solid. DPtBA(NMR) = 44, Mn(NMR) =
6.0 kg mol−1, andĐ
M(SEC) = 1.08.
P(tBA-co-DTMA) (2).A solution of CMDT (40.0 mg, 126 μmol),
tBA (0.807 g, 6.30 mmol), DTMA (81.2 mg, 189 μmol), and AIBN (2.07 mg, 12.6 μmol) in 1,4-dioxane (0.914 mL) was added to a
polymerization ampule. The solution was degassed by three freeze− pump−thaw cycles and sealed under N2. The reaction was stirred at
65°C for 5 h and then quenched by rapid cooling and exposure to air. The product was purified by repeated precipitation into ice-cold methanol/H2O (9/1, v/v) and isolated as afluorescent yellow glassy
solid. DPtBA(NMR) = 36, DPDTMA(NMR) = 1.1, Mn(NMR) =
5.4 kg mol−1, andĐ
M(SEC) = 1.13.
P(TEGA)-b-P(tBA) Block Copolymer (3).A solution of1(0.150 g, 25.2 μmol), TEGA (0.878 g, 4.02 mmol), and AIBN (0.41 mg, 2.5μmol) in 1,4-dioxane (2.37 mL) was added to a polymerization ampule. The solution was degassed by three freeze−pump−thaw cycles and sealed under N2. The reaction was stirred at 65°C for 4.5 h
and then quenched by rapid cooling and exposure to air. H2O (10 mL)
was added, and the solution purified by exhaustive dialysis (MWCO 3.5 kg mol−1) against distilled water. The product was obtained as a
yellow waxy solid by lyophilization. DPTEGA(NMR) = 120,Mn(NMR)
= 31.3 kg mol−1, andĐ
M(SEC) = 1.38.
P(TEGA-co-DTMA)-b-P(tBA) Block Copolymer (4).A solution of1
(0.150 g, 25.2μmol), TEGA (1.10 g, 5.03 mmol), DTMA (16.2 mg, 37.7μmol), and AIBN (0.41 mg, 2.5μmol) in 1,4-dioxane (2.96 mL) was added to a polymerization ampule. The solution was degassed by three freeze−pump−thaw cycles and sealed under N2. The reaction
was stirred at 65°C for 5 h and then quenched by rapid cooling and exposure to air. 1,4-Dioxane (2 mL) was added, and the solution precipitated into ice-cold hexane (200 mL×2). The crude product was redissolved in 1,4-dioxane/H2O (1/2, v/v) and purified by
exhaustive dialysis (MWCO 3.5 kg mol−1) against distilled water. The
product was obtained as a fluorescent yellow waxy solid by lyophilization. DPTEGA(NMR) = 140, DPDTMA(NMR) = 1.1,
Mn(NMR) = 37.7 kg mol−1, andĐM(SEC) = 1.35.
P(TEGA)-b-P(tBA-co-DTMA) Block Copolymer (5).A solution of2
(0.130 g, 24.3μmol), TEGA (1.06 g, 4.86 mmol), and AIBN (0.40 mg, 2.4μmol) in 1,4-dioxane (2.86 mL) was added to a polymerization ampule. The solution was degassed by three freeze−pump−thaw cycles and sealed under N2. The reaction was stirred at 65°C for 3.5 h
and then quenched by rapid cooling and exposure to air. H2O (10 mL)
was added, and the solution purified by exhaustive dialysis (MWCO 3.5 kg mol−1) against distilled water. The product was obtained as a
fluorescent yellow waxy solid by lyophilization. DPTEGA(NMR) = 130,
Mn(NMR) = 33.1 kg mol−1, andĐM(SEC) = 1.38.
Block Copolymer Self-Assembly.Nonlabeled micelles (NLMs), shell-labeled micelles (SLMs), and core-labeled micelles (CLMs) were assembled by direct dissolution of3,4, and 5, respectively, in water (18.2 MΩ·cm) at a concentration of 1 g/L. In order to fully disperse the particles the solutions were stirred at 60°C for 3 h and then sonicated until completely transparent.
FRET Experiments. For the composition of solutions for FRET experiments shown in Figure 8, see Table S1 in the Supporting Information. General procedures were as follows.
Mixing CLMs and NR.A stock solution of NR in 1,4-dioxane was prepared at a concentration of 0.1 mM. A 1 g/L solution of CLMs (82.8μL) was diluted with water (2417μL) to give [DTM] = 1μM. To this micelle solution was added 2.5μL of the NR stock solution to give afinal [NR] = 0.1μM. The solution was mixed with a vortex mixer for 1 s, and the emission was monitored by fluorescence spectroscopy.
Mixing NLMs and NR.The procedure above (CLMs and NR) was repeated for solutions of NLMs. In this case a 1 g/L solution of NLMs (79.9μL) was diluted with water (2420μL) to give [3] = 1μM.
Mixing CLMs and RhB.The procedure above (CLMs and NR) was repeated for solutions of CLMs and RhB. In this case a stock solution of RhB in water was prepared at a concentration of 0.1 mM.
■
RESULTS AND DISCUSSIONBlock Copolymer Synthesis.In order to synthesize BCP
micelles with DTM fluorophores in the shell or core, it was necessary to synthesize two different BCPs. Shell-labeled micelles (SLMs) require a BCP with the DTM fluorophore in the hydrophilic block, while core-labeled micelles require a
Macromolecules Article
DOI: 10.1021/acs.macromol.5b02152
Macromolecules2016, 49, 653−662
BCP with the DTM fluorophore in the hydrophobic block
(Figure 1).
The BCPs used to form the labeled micelles were based on poly(triethylene glycol acrylate)-b-poly(tert-butyl acrylate), P(TEGA)-b-P(tBA), with an average of approximately one repeat unit per chain of dithiomaleimide acrylate (DTMA)44 copolymerized into either the P(TEGA) shell-forming block or P(tBA) core-forming block, as shown in Scheme 1. A nonfunctional P(TEGA)-b-P(tBA) was also synthesized to allow self-assembly of nonlabeled micelles (NLMs) for comparison. The DTM fluorophore is ideally suited to this variable approach to BCP labeling, as the small size and intermediate polarity of thefluorophore mean that it is simply incorporated into both hydrophobic and hydrophilic poly-mers.44
The hydrophobic core blocks (1 and 2) were synthesized
first by RAFT polymerization of tBA, using the commercially available RAFT agent cyanomethyldodecyl trithiocarbonate, with AIBN (0.1 equiv with respect to RAFT agent) as radical initiator, as a solution in 1,4-dioxane at 65°C. The nonlabeled core block 1 (to be used to form shell- and nonlabeled micelles) consisted of a P(tBA) homopolymer, while for the labeled core block2(to be used to form core-labeled micelles) a copolymer of tBA with DTMA was synthesized. For 2, an average DP of 1 was targeted for DTMA to give incorporation of a single fluorophore per chain. 1H NMR spectroscopy
indicated that for the nonlabeled homopolymer (1) DPtBA= 44,
while for the labeled copolymer (2) DPtBA= 36 and DPDTMA=
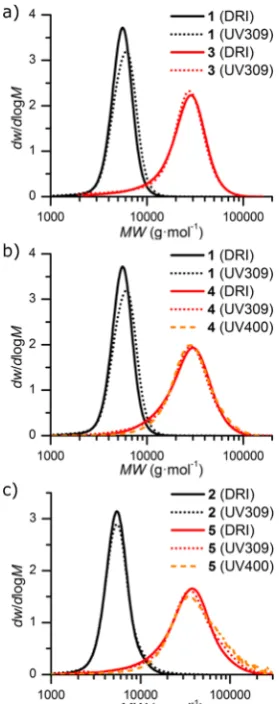
1.1. For both1and2the presence of the trithiocarbonate end-group was confirmed by characteristic resonances of the dodecyl chain (both H1 and H4 in Figures S1 and S2). SEC analysis of 1 and 2 indicated a good control over molecular weight (ĐM = 1.08 and 1.13, respectively), with trithiocar-bonate retention indicated by polymer absorption at 309 nm
(Figure 2andTable 1). Additionally, SEC analysis of2using a
photodiode array detector showed incorporation of the DTM chromophore, with the polymer peak having the characteristic DTM absorption atca. 400 nm (Figure S3).
BCPs were produced by the chain extension of the macro-RAFT agents1and2according toScheme 1. Chain extension of 1 with TEGA resulted in the nonlabeled BCP 3, the precursor to the nonlabeled micelles, while chain extension of1
with TEGA and DTMA (targeting an average DP of 1 for DTMA to give incorporation of a singlefluorophore per chain) resulted in4, the precursor to shell-labeled micelles containing the DTMfluorophore in the corona forming TEGA block.1H NMR spectroscopy indicated that3had DPTEGA= 120, while4
had DPTEGA = 140 and DPDTMA = 1.1 (Figures S4 and S5),
[image:5.625.92.526.493.744.2]giving hydrophobic weight fractions (fC) of 18% and 15% for3
Figure 1. Schematic representation of the route to shell-labeled micelles (SLMs) and core-labeled micelles (CLMs) containing the DTMfluorophore and the route to nonlabeled micelles (NLMs).
Scheme 1. Synthesis of a Nonlabeled P(TEGA)-b-P(tBA) Block Copolymer (3), Block Copolymers with a Dithiomaleimide Label in the Shell-Forming Block (4), and the Core-Forming Block (5)a
and4, respectively, which would likely favor the formation of star-like spherical micelles upon aqueous self-assembly.48Chain extension of 2 with TEGA resulted in BCP 5 with a labeled core forming block (the precursor to core-labeled micelles).1H NMR spectroscopy indicated that5had DPTEGA= 130 (Figure S6), corresponding to a hydrophobic weight fraction (fC) of
16%. In all cases SEC indicated good blocking efficiency, with molecular weight distributions obtained from both differential refractive index and UV (λabs = 309 nm) detectors showing consumption of the macro-RAFT agents 1 and 2, with a
reasonable control over molecular weight (ĐM= 1.35−1.38 for
3−5). By monitoring absorption at 400 nm (absorption due to the DTM chromophore), incorporation of DTMA into the corona forming block of4 was also confirmed (Figure 2).
Block Copolymer Self-Assembly.The amphiphilic BCPs
3−5 were assembled by direct dissolution in water (18.2 MΩ·cm) at a concentration of 1 g/L. In order to fully disperse the particles, the solutions were stirred at 60°C for 3 h and then sonicated until completely transparent. Self-assembled solutions of 3−5 were analyzed by multiangle laser light scattering using a goniometer allowing simultaneous dynamic and static light scattering (DLS and SLS) measurements (see
Table 2andFigure S7). Particle hydrodynamic radius (Rh) was
obtained directly from DLS measurements and in all cases was approximately equivalent with Rh = 34−36 nm (Figure 3). Measurement of particleMwby SLS allowed for the calculation
of aggregation number (Nagg), which was found to vary between the systems (Table 2). The trend of increasing Nagg
with fC could be explained by considering that polymer unimers with higherfC(greater hydrophobic character) are less
stable in aqueous solution and therefore have a lower energy barrier for insertion. Despite this variation inNagg, the structural
similarity of the DTM-labeled micelles (prepared from4and5) to the nonlabeled micelles (prepared from 3) indicates that incorporation of the DTM label has not had a detrimental effect on the BCP self-assembly. From Rh and Naggit is also
possible to estimate the micelle core and shell volumes (Vcore and Vshell),46,49 and hence the local concentration of DTM
fluorophores within the micelles ([DTM]) could be calculated
(see Experimental Section for details). These calculations
revealed that despite using the same ratio of dye for labeling the BCPs4 and5 (ca. 1 equiv per chain), two very different local environments can be created: a ca. 400-fold decrease in local concentration is obtained by locating the DTM in the shell (SLMs) compared to locating the DTM in the core (CLMs).
Micelle solutions were imaged by dry state transmission electron microscopy (TEM) using graphene oxide support TEM grids in order to examine micelle morphology.50,51 As shown inFigure 3, particles provided a circular projection when dried to a graphene oxide surface, suggesting they had a spherical morphology. In line with previous observations,50 only the P(tBA) micelle cores provided sufficient contrast to be visualized by TEM, with core diameters in reasonable agreement with those obtained by light scattering.
Steady State Fluorescence Spectroscopy. The steady
state emission and excitation spectra for solutions of labeled micelles were found to be very similar to that of analogous small molecule DTMs.38,42,44 A 2D excitation−emission spectrum for the core-labeled micelles is shown in Figure 4a, with excitation maxima occurring at 267 and 407 nm, with the corresponding emission maximum of 510 nm (Figure 4b). The
[image:6.625.111.251.67.420.2]fluorescence quantum yield (Φf) for the core-labeled micelles
Figure 2. Molecular weight distributions obtained by SEC using differential refractive index (DRI) and UV (λabs = 309 or 400 nm)
[image:6.625.325.564.248.323.2]detectors for (a) P(tBA) (1) and P(TEGA)-b-P(tBA) (3), (b) P(tBA) (1) and P(TEGA-co-DTMA)-b-P(tBA) (4), and (c) P(tBA-co -DTMA) (2) and P(TEGA)-b-P(tBA-co-DTMA) (5).
Table 1. Characterization Data for Polymers 1−5
polymer
Mna
(kg mol−1) Mn b
(kg mol−1) Đ Mb 1 P(tBA)44 6.0 5.2 1.08 2 P(tBA36-co-DTMA1.1) 5.4 5.1 1.13 3 P(TEGA)120-b-P(tBA)44 31.3 20.1 1.38 4 P(TEGA140-co-DTMA1.1)-b
-P(tBA)44
37.7 21.9 1.35
5 P(TEGA)130-b-P(tBA36-co
-DTMA1.1)
33.1 26.7 1.38
aCalculated by1H NMR spectroscopy end-group analysis.bMeasured
by SEC (1,2: THF eluent and PS calibration;3,4,5: DMF eluent and PMMA calibration).
Table 2. DLS/SLS Characterization Data for Micelles Obtained by the Solution Self-Assembly of BCPs 3−5
NLMs SLMs CLMs
BCP 3 4 5
fC(%) 18 15 16
Rh(nm) 36 34 36
Nagg 150 40 110
[DTM] (mM) 0.40 180
Macromolecules Article
DOI: 10.1021/acs.macromol.5b02152
Macromolecules2016, 49, 653−662
was measured using an integrating sphere to give an absolute value of 17 ± 2%. Excitation and emission spectra were also recorded for the shell-labeled micelles, which showed similar excitation and emission. However, a red-shift in the emission maximum (λem,max) to 520 nm was observed with a drastic
reduction in Φf to <1%, as compared to the core-labeled
micelles. The drastic reduction ofΦfand bathochromic shift of emission indicates the different environment of the chromo-phore, which is consistent with collisional (solvent) quenching in the more polar environment of the solvated micelle shell. These results are in agreement with previous work using small molecule DTM fluorophores which show both bathochromic shifts and reductions inΦfupon increasing solvent polarity; for
example, dithiobutanemaleimide hasλem,max= 486 nm andΦf= 28% in cyclohexane, whereas in methanolλem,max= 546 nm and Φf < 1%.
39
While the possibility of ordered, coherent effects cannot be overtly discounted, we have seen nothing to indicate aggregation-induced emission,52 a process which is typically reserved for discussions of neat or chromophore-rich, highly ordered systems with J-type emission or H-type systems that interconvert to J-type emission.
Emission intensity was measured over a range of concentrations for aqueous solutions of the polymers 4 and
5, whereby the integrated emission was calculated for the whole spectrum and these values normalized by the concentration of polymer chains in solution (Figure 5). For both polymers a relativelyflat emission intensity over 3 orders of magnitude in concentration was observed, corresponding to the micellar state (shell-labeled micelles for 4 and core-labeled micelles for 5). Deviation from theflat emission intensity occurred atc≤1×
10−7M for4andc≤5×10⁻⁸M for5and was assigned to a transition from micelles to solvated polymer unimers upon decreasing concentration.42 For polymer 4 the DTM
[image:7.625.132.499.70.216.2]fluorophore is already solvated by water in the micelle shell, so the transition from micelles to unimers leads to an increase in emission intensity due to increased protection from solvent interactions with the presence of the hydrophobic core block in the unimer coil. However, for polymer5the DTMfluorophore is protected from the surrounding solvent due to its location in the micelle core. Therefore, upon transition to the polymer unimer state an increase in solvation occurs, leading to dye− solvent quenching and a corresponding decrease in emission intensity. In both cases, the emission intensity self-reports on
[image:7.625.116.518.252.392.2]Figure 3.(a) Size distribution obtained by DLS (detection angle of 90°) for a solution of NLMs, SLMs, and CLMs at 1 g/L and the corresponding autocorrelation functions (inset). (b) SLMs imaged by TEM on a graphene oxide support. Scale bar = 100 nm.
Figure 4.(a) 2D excitation−emission spectra with a 5 nm step for an aqueous solution of core-labeled micelles. (b) Excitation and emission spectra of aqueous solutions of core- and shell-labeled micelles.
[image:7.625.343.558.429.571.2]the supramolecular state of the polymer allowing a convenient way to determine the critical micelle concentrations (CMCs), which correspond to 3.8 and 1.7 mg/L for shell- and core-labeled micelles, respectively. The higher CMC of the shell-labeled micelles relative to the core-shell-labeled micelles is in agreement with the shell-labeled micelles possessing a lower Naggboth phenomena being explained by a greater solubility
of unimers of polymer4 relative to5due to4 having a lower fC. Within the micellar region emission anisotropy (r) for both 4 and 5 was found to be 0.29 ± 0.01 and 0.19 ± 0.01, respectively, further confirming that the emissive DTM
fluorophore was incorporated into a macromolecular structure, as analogous small molecule DTM dyes have r ca. 0 in solution.40,42It is valuable to observe that the total increase in emission intensity for polymer4is not as severe as the decrease in the emission intensity observed in polymer5on transition to the unimer state from the micellar state. Additionally, it is interesting to note that the higher dye density ([DTM]) within the core block of the core-labeled micelles does not result in overt quenching. This is important in terms of application, where total change in intensity for a given species will be critical and where the initial species (micelle) should be as bright as possible, and points to a core-labeled system being more viable than a corona-labeled one.
Time-Correlated Single Photon Counting and
Fluo-rescence Lifetime Imaging Microscopy. Fluorescence
lifetime was measured for aqueous solutions of polymers 4
and 5 using time-correlated single photon counting. Samples were excited with a pulsed 405 nm diode laser (60 ps full width at half-maximum), and the resultant emission decays were modeled as a sum of exponential decays after deconvolution with the instrument response function. Decay spectra are shown in Figure 6, with the average lifetimes and lifetime components listed in Table 3. For both4 and5 spectra were recorded for an aqueous solution at 5×10⁻⁵M corresponding to the micellar regime (shell- and core-labeled micelles) and an aqueous solution at 5 × 10⁻⁸ M corresponding to polymer unimers (below the CMC). A dehydrated thin film was also prepared by drying a drop of micelle solution to a glass slide, with the spectra collected by fluorescence lifetime imaging microscopy, where the intensity decay was calculated by summation of the decays for each pixel in the image (Figure S8).
The fluorescence lifetime decay spectra clearly exhibit two important features. Thefirst is that the shell-labeled micelles formed from4 have a significantly faster decay than the core-labeled micelles formed from 5, with intensity-averaged lifetimes of the excited state (τAv,I) of 7.0 ± 0.1 and 18.8 ± 0.3 ns, respectively. This is as a result of a near ultrafast lifetime component with significant amplitude for shell-labeled micelles (τ1= 0.40±0.06 ns,A1= 0.71), which is assigned to excited
state annihilation by solvent collision and can be interpreted as the result of poorfluorophore protection. In contrast, the major lifetime component for the core-labeled micelles isτ2= 17.5±
0.1 ns, with amplitudeA2= 0.96. For the core-labeled micelles the dye is located within the dehydrated core and is therefore encapsulated within the supramolecular structure, whereas for the shell-labeled micelles location of the dye within the solvated corona provides poor protection to the DTMfluorophore from solvent quenching. This interpretation is supported by the decay spectrum of unimers of4, which also haveτAv,I = 7.0±
0.1 ns (near ultrafast lifetime componentτ1= 0.32±0.06 ns, A1= 0.72), indicating that shell-labeled micelle formation does
not change the local environment for the DTM, whereas an increase inτAv,Ito 14.8 ±0.3 ns for the dehydrated film of4
gives a closer representation to the intrinsic lifetime for polymer4. These results are in agreement with the observation of a lower Φf for the shell-labeled micelles compared to the
core-labeled micelles and further emphasize that the optimum location for the DTM dye to obtain the greatest emission is within the micelle core.
The second important feature that the decay spectra highlight is the ability to discriminate the micellar state of5
from measurements offluorescence lifetime. A relatively long lifetime was observed for5in the micellar state (τAv,I= 18.8± 0.3 ns), whereas the unimer state showed a significant decrease toτAv,I= 9.2±0.2 ns, due to a near ultrafast (solvent collision) component to the decay (τ1= 0.56±0.06 ns,A1= 0.60). Again
[image:8.625.338.552.69.378.2]this interpretation was supported by fluorescence lifetime imaging microscopy measurements of a dehydrated film of micelles, which had the same decay as the micelle solution (τAv,I = 18.5± 0.2 ns), indicating that the core of the core-labeled micelles is largely solvent free. We have previously shown with a related interface-labeled system that this ability to discriminate between micelles and unimers simply by measuringfluorescence lifetime could be translated to in vitro imaging, such that micelles and unimers could be located within discrete areas of rat hippocampal tissue.42 As the micelle-to-unimer transition is widely exploited as a trigger for controlled drug delivery from polymer nanoparticles,23we expect that this feature of the core-labeled DTM micelles would provide a simple method to identify such controlled releasein vitro.
Figure 6. Fluorescence lifetime decay spectra (points), with fitting (lines), residuals (bottom), and instrument response function (IRF), for aqueous solutions of (a)4and (b)5.
Macromolecules Article
DOI: 10.1021/acs.macromol.5b02152
Macromolecules2016, 49, 653−662
Monitoring CLM Loading by FRET. FRET describes a phenomenon whereby twofluorophores can interact when in close proximity to one another. Energy transfer occurs between a donor molecule in the excited state and an acceptor molecule, provided there is sufficient spectral overlap between donor emission and acceptor excitation and that the two molecules are positioned within the necessary Förster distance. The result is emission from the acceptorfluorophore upon excitation of the donorfluorophore, according to their respective excitation and emission wavelengths. Monitoring the FRET process for
fluorescently labeled micelles has been exploited to measure CMCs,20,53to identify morphology response to stimuli,54and to follow the uptake and release offluorescent payloads.55
Because of the interest surrounding the use of nanoparticles as delivery agents,56 we sought to investigate whether the uptake of model compounds by the core-labeled micelles could be identified using FRET. The DTM fluorophore was designated as the FRET donor due to its broad excitation spectra and to also ensure that all emission originated from a labeled micelle. Two FRET acceptor molecules whose excitation spectra overlapped with the DTM emission were chosen as probes for interaction with, and uptake into, the core-labeled micelles: Nile Red (NR) as a hydrophobic guest expected to partition to the micelle core and Rhodamine B (RhB) as a hydrophilic guest expected to partition to the aqueous solution or the solvated micelle shell (Figure 7). To reduce the backgroundfluorescence (i.e., non-FRET emission) from the probes, a 10-fold excess in total DTM concentration was used relative to Nile Red and Rhodamine B concentration, while all dyes were present at concentrations corresponding to an absorbance <0.1 to negate innerfilter effects.
To study uptake of the hydrophobic dye, a solution of Nile Red in 1,4-dioxane (2.5μL, 0.1 mM) was added to a solution of core-labeled micelles (2.5 mL) with [DTM] = 1μM, to give a
final [Nile Red] = 0.1μM. Emission spectra were recorded for the solution with an excitation wavelength of 422 nm, corresponding to the excitation maximum of the DTM donor. Quenching of the DTM emission at 515 nm was
observed, with a corresponding enhancement of Nile Red emission at 610 nm (Figures 7a and 8a). Quenching and enhancement occurs within 10 s (the time of the first measurement, see Figure S9), at which time equilibrium has been reached with no further change after 60 min. These results demonstrate that FRET occurs between donor (DTM) and acceptor (Nile Red), indicating the proximity of the two
fluorescent species. As FRET is extinguished beyond the Förster distance (typically <4 nm), FRET between DTM and Nile Red corresponds to the presence of Nile Red within the core of the core-labeled micelles. As a control, the protocol of Nile Red addition was repeated for a solution of nonlabeled micelles where the polymer concentration was maintained with respect to the core-labeled micelles (Figures 7b and8b). In this case an increase in emission at 610 nm was observed, as it is well-known that Nile Red emission is quenched in water and subsequently restored upon partition to a more hydrophobic environment. However, the detectable change in emission that results from this“background”increase in Nile Red brightness upon partition was 2.5×lower than the combined partition and FRET effect observed for the core-labeled micelles. In addition, a greater ambiguity is associated with the interpretation of changes in Nile Red emission on its own, as these variations result from any change in environment polarity.
Finally, the FRET experiment was repeated for the core-labeled micelles using the hydrophilic dye Rhodamine B
(Figures 7c and8c), which was added to the solution of
core-labeled micelles as a solution in water (2.5μL, 0.1 mM) to give afinal [Rhodamine B] = 0.1μM. In this case no change in the intensity of emission at 515 nm was observed (DTM emission was not quenched), while the intensity of emission at 615 nm was accounted for by a summation of the emission from core-labeled micelles (t= 0) and a 0.1μM Rhodamine B solution in water (Rhodamine B emission was not enhanced). This experiment therefore shows that FRET does not occur between the DTMfluorophore in core-labeled micelles and Rhodamine B, indicating that Rhodamine B does not partition to the core of the core-labeled micelles. Collectively these FRET
experi-Table 3. Kinetic Data for Solution State Fluorescence Emission Decay Spectra
τ1(ns) A1 τ2(ns) A2 τ3(ns) A3 τ4(ns) A4 τAv,I(ns)
4SLMs 0.40±0.06 0.71 1.8±0.1 0.01 5.4±0.1 0.23 15.9±0.3 0.05 7.0±0.1
4polymer unimers 0.32±0.06 0.72 1.5±0.1 0.01 5.0±0.1 0.22 15.5±0.2 0.05 7.0±0.1
5CLMs 5.5±0.2 0.02 17.5±0.1 0.96 73.7±2.7 0.02 18.8±0.3
[image:9.625.60.567.79.306.2]5polymer unimers 0.56±0.06 0.60 3.4±0.1 0.31 12.5±0.2 0.09 9.2±0.2
Figure 7. (a−c) Schematic representation of interaction between micelles and fluorescent dyes Nile Red (NR) and Rhodamine B (RhB). (d) Structures of Nile Red and Rhodamine B.
[image:9.625.60.563.84.306.2]ments demonstrate that the incorporation of the DTM dye in the core-labeled micelles allows the micelles to report on the presence (Nile Red) or absence (Rhodamine B) of a cargo molecule within the micelle core via a simple measure of emission. Furthermore, although too fast in this example, measuring the rate for FRET could provide details of the kinetics of cargo encapsulation and release, as has been shown previously for core cross-linked polymer nanoparticles.57Taken in conjunction with the steady state and time-resolved
fluorescence data, this final finding points to DTM core labeling being superior to coronal labeling for all of the most major considerations in nanocontrast/nanotheranostic systems: it can be seen (bright), it can report on the supramolecular
state (changes in emissive character), and it can signal with regards to loading/unloading (FRET).
■
CONCLUSIONSPoly(triethylene glycol acrylate)-b-poly(tert-butyl acrylate) BCP micelles have been synthesized with afluorescent DTM group incorporated into the micelle core or shell. The advantages of using DTM chemistry are the small size and intermediate polarity of thisfluorophore as well as its excellent compatibility with BCP synthesis and self-assembly and its proven applicability to tissue imaging. It was found locating the DTM fluorophore in the micelle core resulted in greater emission (Φf= 17%) and a longerfluorescence lifetime (τAv,I=
19 ns), when compared to locating thefluorophore in the shell (Φf< 1%,τAv,I= 7 ns), as a result of better protection of the
fluorophore in the core from solvent collisional quenching. For both shell and core-labeled micelles it was possible to measure the onset of aggregation (with respect to concentration) by measuring the emission intensity. The transition from micelle-to-unimer could also be detected for the core-labeled micelles by fluorescence lifetime spectroscopy since the polymer unimers have a significantly shorter lifetime (τAv,I = 9 ns).
Following our previous work,42we believe that the core-labeled micelles’ ability to self-report on their supramolecular state would allow in vitro discrimination between assembled and disassembled micelles using fluorescence lifetime imaging microscopy. The presence of the DTM label allows the encapsulation of afluorescent hydrophobic guest (Nile Red) to be monitored by measuring FRET between the DTM (donor) and Nile Red (acceptor). Uptake of the hydrophobic guest dye was found to occur very quickly (<10 s), while no FRET was observed with a hydrophilic guest (Rhodamine B), indicating that this small molecule is not encapsulated in the micelle core. The use of this simple DTM label can therefore produce
fluorescent BCP micelles that can self-report on both their supramolecular structure and the presence or absence of cargo molecules.
■
ASSOCIATED CONTENT*
S Supporting InformationThe Supporting Information is available free of charge on the
ACS Publications website at DOI:
[image:10.625.81.276.64.509.2]10.1021/acs.macro-mol.5b02152.
Table S1 and Figures S1−S10 (PDF)
■
AUTHOR INFORMATIONCorresponding Author
*E-mail: r.k.o-reilly@warwick.ac.uk; Fax +44 024 7652 4112; Tel +44 024 7652 3236 (R.K.O.).
Notes
The authors declare no competingfinancial interest.
■
ACKNOWLEDGMENTSThe authors thank Dr Yan Kang for performing TEM analysis. The IAS at the University of Warwick, the ERC (Grant No. 615142), the EPSRC, The Leverhulme Trust, and University of Birmingham are gratefully acknowledged for funding. Some of the spectrometers and SEC equipment used in this research were obtained through Birmingham Science City: Innovative Uses for Advanced Materials in the Modern World (West Midlands Centre for Advanced Materials Project 2), with
Figure 8.(a) Emission spectra of CLMs att= 0, CLMs at 1 min (t= 1) and 60 min (t= 60) after addition of Nile Red (NR), and NR in water (0.1% 1,4-dioxane). (b) Emission spectra of NLMs att = 0, NLMs at 1 min (t= 1) and 60 min (t= 60) after addition of NR, and NR in water (0.1% 1,4-dioxane). (c) Emission spectra of CLMs att= 0, CLMs at 1 min (t = 1) and 60 min (t = 60) after addition of Rhodamine B (RhB), and RhB in water.λex= 422 nm in all cases, and
peaks at 495 nm correspond to the Raman scattering of water.
Macromolecules Article
DOI: 10.1021/acs.macromol.5b02152
Macromolecules2016, 49, 653−662
support from Advantage West Midlands (AWM) and part funded by the European Regional Development Fund (ERDF).
■
REFERENCES(1) Wolfbeis, O. S.Chem. Soc. Rev.2015,44, 4743.
(2) Canfarotta, F.; Whitcombe, M. J.; Piletsky, S. A.Biotechnol. Adv.
2013,31, 1585.
(3) Chen, M.; Yin, M.Prog. Polym. Sci.2014,39, 365.
(4) Ruedas-Rama, M. J.; Walters, J. D.; Orte, A.; Hall, E. A. H.Anal. Chim. Acta2012,751, 1.
(5) Kelley, E. G.; Albert, J. N. L.; Sullivan, M. O.; Epps, T. H., III
Chem. Soc. Rev.2013,42, 7057.
(6) Hu, J.; Liu, S.Macromolecules2010,43, 8315.
(7) Zhang, P.; Cheetham, A. G.; Lock, L. L.; Li, Y.; Cui, H.Curr. Opin. Biotechnol.2015,34, 171.
(8) Maiti, C.; Banerjee, R.; Maiti, S.; Dhara, D.Langmuir2015,31, 32.
(9) Sokolova, V.; Epple, M.Nanoscale2011,3, 1957. (10) Robin, M. P.; O’Reilly, R. K.Polym. Int.2015,64, 174. (11) Vollrath, A.; Schallon, A.; Pietsch, C.; Schubert, S.; Nomoto, T.; Matsumoto, Y.; Kataoka, K.; Schubert, U. S.Soft Matter2013,9, 99. (12) Hudson, Z. M.; Lunn, D. J.; Winnik, M. A.; Manners, I.Nat. Commun.2014,5, 3372.
(13) Hudson, Z. M.; Boott, C. E.; Robinson, M. E.; Rupar, P. A.; Winnik, M. A.; Manners, I.Nat. Chem.2014,6, 893.
(14) Chen, J.; Zhang, P.; Fang, G.; Yi, P.; Yu, X.; Li, X.; Zeng, F.; Wu, S.J. Phys. Chem. B2011,115, 3354.
(15) Wu, C.; Jin, Y.; Schneider, T.; Burnham, D. R.; Smith, P. B.; Chiu, D. T.Angew. Chem., Int. Ed.2010,49, 9436.
(16) Fuchs, S.; Otto, H.; Jehle, S.; Henklein, P.; Schluter, A. D.Chem. Commun.2005, 1830.
(17) Hu, J.; Dai, L.; Liu, S.Macromolecules2011,44, 4699. (18) O’Reilly, R. K.; Joralemon, M. J.; Wooley, K. L.; Hawker, C. J.
Chem. Mater.2005,17, 5976.
(19) Webber, S. E.J. Phys. Chem. B1998,102, 2618.
(20) Major, M. D.; Torkelson, J. M.; Brearley, A. M.Macromolecules
1990,23, 1700.
(21) Cao, T.; Munk, P.; Ramireddy, C.; Tuzar, Z.; Webber, S. E.
Macromolecules1991,24, 6300.
(22) Ylitalo, D. A.; Frank, C. W.Polymer1996,37, 4969. (23) Ge, Z.; Liu, S.Chem. Soc. Rev.2013,42, 7289. (24) Bo, Q.; Zhao, Y.Langmuir2007,23, 5746.
(25) Lin, Y.; Zheng, Z.; Hogen-Esch, T. E.; Ling, J.; Shen, Z.J. Colloid Interface Sci.2013,390, 105.
(26) Noel, A.; Borguet, Y. P.; Wooley, K. L.ACS Macro Lett.2015,4, 645.
(27) Evans, C. M.; Henderson, K. J.; Saathoff, J. D.; Shull, K. R.; Torkelson, J. M.Macromolecules2013,46, 4131.
(28) You, S.; Cai, Q.; Mullen, K.; Yang, W.; Yin, M.Chem. Commun.
2014,50, 823.
(29) Yan, Q.; Yuan, J.; Yuan, W.; Zhou, M.; Yin, Y.; Pan, C.Chem. Commun.2008, 6188.
(30) Zhou, K.; Wang, Y.; Huang, X.; Luby-Phelps, K.; Sumer, B. D.; Gao, J.Angew. Chem., Int. Ed.2011,50, 6109.
(31) Zhou, K.; Liu, H.; Zhang, S.; Huang, X.; Wang, Y.; Huang, G.; Sumer, B. D.; Gao, J.J. Am. Chem. Soc.2012,134, 7803.
(32) Ma, X.; Wang, Y.; Zhao, T.; Li, Y.; Su, L.-C.; Wang, Z.; Huang, G.; Sumer, B. D.; Gao, J.J. Am. Chem. Soc.2014,136, 11085.
(33) Wang, Y.; Zhou, K.; Huang, G.; Hensley, C.; Huang, X.; Ma, X.; Zhao, T.; Sumer, B. D.; DeBerardinis, R. J.; Gao, J.Nat. Mater.2014,
13, 204.
(34) Liu, T.; Hu, J.; Jin, Z.; Jin, F.; Liu, S.Adv. Healthcare Mater.
2013,2, 1576.
(35) Liu, T.; Liu, S.Anal. Chem.2011,83, 2775.
(36) Wu, G.; Chen, S.-C.; Liu, C.-L.; Wang, Y.-Z.ACS Nano2015,9, 4649.
(37) Liu, G.; Hu, J.; Zhang, G.; Liu, S.Bioconjugate Chem.2015,26, 1328.
(38) Robin, M. P.; Wilson, P.; Mabire, A. B.; Kiviaho, J. K.; Raymond, J. E.; Haddleton, D. M.; O’Reilly, R. K.J. Am. Chem. Soc.2013,135, 2875.
(39) Mabire, A. B.; Robin, M. P.; Quan, W.-D.; Willcock, H.; Stavros, V. G.; O’Reilly, R. K.Chem. Commun.2015,51, 9733.
(40) Robin, M. P.; Raymond, J. E.; O’Reilly, R. K.Mater. Horiz.2015,
2, 54.
(41) Mabire, A. B.; Robin, M. P.; Willcock, H.; Pitto-Barry, A.; Kirby, N.; O’Reilly, R. K.Chem. Commun.2014,50, 11492.
(42) Robin, M. P.; Mabire, A. B.; Damborsky, J. C.; Thom, E. S.; Winzer-Serhan, U. H.; Raymond, J. E.; O’Reilly, R. K.J. Am. Chem. Soc.
2013,135, 9518.
(43) Hua, F.; Jiang, X.; Li, D.; Zhao, B.J. Polym. Sci., Part A: Polym. Chem.2006,44, 2454.
(44) Robin, M. P.; O’Reilly, R. K.Chem. Sci.2014,5, 2717. (45) Nicolai, T.; Brown, W.; Johnsen, R. M.; Stepanek, P.
Macromolecules1990,23, 1165.
(46) Colombani, O.; Ruppel, M.; Burkhardt, M.; Drechsler, M.; Schumacher, M.; Gradzielski, M.; Schweins, R.; Müller, A. H. E.
Macromolecules2007,40, 4351.
(47) Esker, A. R.; Mengel, C.; Wegner, G.Science1998,280, 892. (48) Discher, D. E.; Ahmed, F.Annu. Rev. Biomed. Eng.2006,8, 323. (49) Patterson, J. P.; Robin, M. P.; Chassenieux, C.; Colombani, O.; O’Reilly, R. K.Chem. Soc. Rev.2014,43, 2412.
(50) Patterson, J. P.; Sanchez, A. M.; Petzetakis, N.; Smart, T. P.; Epps, T. H., III; Portman, I.; Wilson, N. R.; O’Reilly, R. K.Soft Matter
2012,8, 3322.
(51) Dyson, M. A.; Sanchez, A. M.; Patterson, J. P.; O’Reilly, R. K.; Sloan, J.; Wilson, N. R.Soft Matter2013,9, 3741.
(52) Hong, Y.; Lam, J. W. Y.; Tang, B. Z.Chem. Commun. 2009, 4332.
(53) Rajdev, P.; Basak, D.; Ghosh, S.Macromolecules2015,48, 3360. (54) Li, C.; Hu, J.; Liu, S.Soft Matter2012,8, 7096.
(55) Hu, P.; Tirelli, N.React. Funct. Polym.2011,71, 303. (56) Elsabahy, M.; Wooley, K. L.Chem. Soc. Rev.2012,41, 2545. (57) Moore, B. L.; Lu, A.; Moatsou, D.; O’Reilly, R. K.Eur. Polym. J.