warwick.ac.uk/lib-publications
A Thesis Submitted for the Degree of PhD at the University of Warwick
Permanent WRAP URL:
http://wrap.warwick.ac.uk/97639
Copyright and reuse:
This thesis is made available online and is protected by original copyright. Please scroll down to view the document itself.
Please refer to the repository record for this item for information to help you to cite it. Our policy information is available from the repository home page.
A thesis submitted for the Degree of
Doctor of Philosophy
by
Hussein Gherli, BSc, MSc
School of Life Sciences, University of Warwick
United Kingdom
i
List of Figures ... vi
List of Tables ...x
List of Abbreviations ... xi
Acknowledgments ... xiv
Declaration ...xv
Abstract ... xvi
1
Chapter 1 General Introduction ...1
1.1
Oilseed rape (
Brassica napus
L.) ... 2
1.1.1 B. napus origin ... 2
1.1.2 Oilseed rape production area ... 3
1.1.3 Oilseed rape yield trends ... 4
1.1.4 Importance of OSR crop ... 6
1.2
Minerals acquisition, transport and assimilation ... 7
1.2.1 Phosphorus ... 8
1.2.2 Potassium ... 10
1.2.3 Sulphur ... 12
1.2.4 Nitrogen ... 14
1.3
Nitrogen within OSR plants ... 17
1.3.1 Importance of N fertiliser and its application time ... 17
1.3.2 Nitrogen uptake ... 19
1.3.3 Nitrogen utilisation and remobilisation ... 20
1.3.4 Nitrogen Use Efficiency ... 22
1.3.5 Environmental impact of N fertilisers ... 24
1.3.6 Financial contribution of fertiliser ... 25
1.4
Quantitative Trait Loci ... 26
1.4.1 Introduction to Quantitative traits ... 26
ii
1.4.3.2Seed oil content and quality, and glucosinolates content ... 31
1.4.3.3QTLs associated with flowering time ... 32
1.4.3.4QTLs for N use efficiency ... 33
1.4.3.5Other minerals composition and use efficiency ... 34
1.4.4 QTLs for mineral use efficiency and its related traits in different plant species ... 36
1.5
Proteomic traits regulated plant development ... 38
1.5.1 Vegetative storage protein in B. napus ... 38
1.5.2 VSPs in different plant species ... 39
1.6
Mass Spectrometry in proteomic studies ... 40
1.6.1 Development ... 40
1.6.2 Principles of Mass Spectrometry ... 41
1.6.2.1Ionisation methods ... 42
1.6.3 Mass analyser ... 43
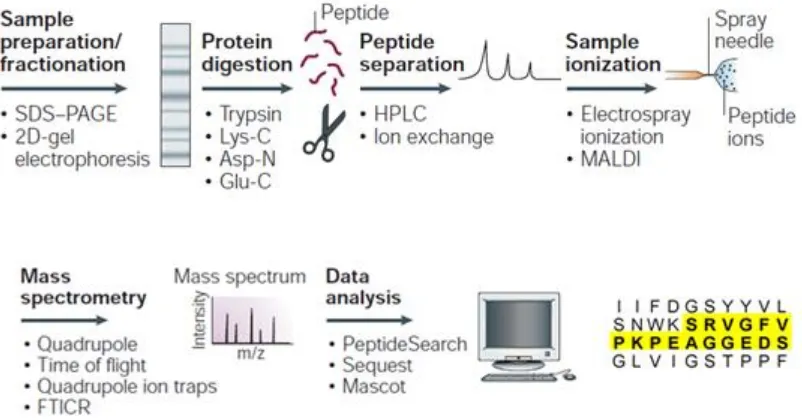
1.6.4 Proteomic workflow ... 46
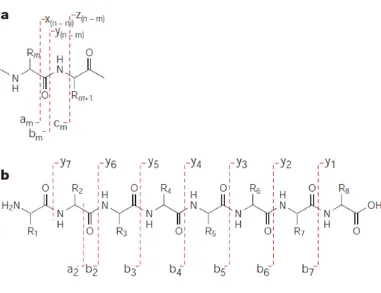
1.6.4.1Peptide fragmentation ... 47
1.6.4.2Identification by database searching ... 48
1.6.5 Protein(s) quantification workflow ... 49
1.7
The aim of this thesis ... 51
1.7.1 The objectives ... 51
2
Chapter 2 Variation Underlying Nitrogen Accumulation
in Brassica napus L. ...52
2.1
Introduction ... 53
2.2
The aim of this chapter ... 55
2.3
Material and methods ... 56
2.3.1 Low Nitrogen OREGIN field experiment ... 56
2.3.2 Plant sampling at seed development stage GS 6.2/6.3... 57
2.3.3 Plant sampling at harvest ... 59
2.3.4 Preparation of Kjeldahl digestion acid ... 61
iii
2.4.1 Variation in N concentration at GS 6.2/6.3 ... 65
2.4.2 Relation between N and other mineral elements at GS6.2/6.3 ... 68
2.4.3 Variation in N concentration at harvest ... 72
2.4.4 Relation between N and other mineral elements at harvest ... 77
2.4.5 Comparison between two stages GS 6.2/6.3 and harvest ... 82
2.5
Discussion ... 84
3
Chapter 3 Variation in Mineral Element Concentrations
of Brassica napus L. ...93
3.1
Introduction ... 94
3.2
The aim of this chapter ... 97
3.3
Materials and methods ... 98
3.3.1 OREGIN field experiment ... 98
3.3.2 Plant sampling at GS 6.2/6.3 ... 98
3.3.3 Plant sampling at harvest ... 98
3.3.4 Sample preparation and mineral content determination ... 98
3.3.4.1Kjeldahl digestion ... 98
3.3.4.2Microwave-assisted nitric acid digestion ... 100
3.3.5 Data analysis ... 102
3.4
Results ... 103
3.4.1 Variation in macronutrient concentrations at GS 6.2/6.3 ... 103
3.4.2 Variation in micronutrient concentrations at GS 6.2/6.3 ... 106
3.4.3 The relationship between all mineral nutrients at GS 6.2/6.3 .. 108
3.4.4 Variation in macronutrient concentration at harvest ... 111
3.4.5 Variation in micronutrient concentration at harvest ... 114
3.4.6 The relationship between all mineral nutrients at harvest... 117
3.4.7 Comparison between both stages GS 6.2/6.3 and harvest ... 120
3.4.8 Comparison between Kjeldahl and HNO3 digestion method ... 128
3.5
Discussion ... 130
3.5.1 Mineral nutrients natural variation ... 135
iv
4.1
Introduction ... 144
4.2
The aim of this chapter ... 145
4.3
Materials and methods ... 146
4.3.1 Plant culture ... 146
4.3.2 Plant sampling ... 147
4.3.3 Effect of sink-source status experiment ... 148
4.3.4 Soluble protein extraction ... 149
4.3.5 Protein analysis by SDS-PAGE ... 150
4.3.6 In-gel band protein identification ... 151
4.3.6.1In-gel digestion and peptide extraction ... 151
4.3.6.2Tandem mass spectrometry analysis ... 152
4.3.6.3Database search and protein identification ... 153
4.3.7 The entire proteomic profile at tissue level ... 154
4.3.7.1Protein and Peptide extraction ... 154
4.3.7.2Tandem MS analysis and protein identification ... 155
4.4
Results ... 157
4.4.1 Soluble protein profiles ... 157
4.4.2 Protein identification of gel bands ... 161
4.4.3 Protein identification of the entire proteomic profile ... 166
4.5
Discussion ... 170
5
Chapter 5 Quantitative Traits Underlying Nitrogen Use
Efficiency in Brassica napus L. ... 175
5.1
Introduction ... 176
5.2
The objectives of this chapter ... 177
5.3
Material and methods ... 178
5.3.1 The mapping population and the linkage map ... 178
5.3.2 Plant material and experimental design ... 178
5.3.3 Phenotypic traits ... 180
v
5.3.5.2QTL detection ... 189
5.4
Results ... 190
5.4.1 Phenotypic variation among traits ... 190
5.4.2 Analysis of QTLs mapping phenotypic traits ... 195
5.4.3 Quantitative analysis of proteins of interest ... 202
5.5
Discussion ... 207
6
Chapter 6 General Discussion and Future Work ... 212
6.1
General discussion ... 213
6.2
Future work ... 218
7
References ... 221
8
Appendices ... 249
Appendix 1 N concentration at two growth stages GS 6.2/6.3 and Harvest ... 250
Appendix 2 Analysis of variance of all mineral nutrients at GS 6.2/6.3 ... 252
Appendix 3 Macronutrient concentrations at the growth stages GS 6.2/6.3 ... 254
Appendix 4 Micronutrient concentrations at the growth stages GS 6.2/6.3... 257
Appendix 5 Analysis of variance of all mineral nutrients at harvest... 260
Appendix 6 Macronutrient concentrations at harvest. ... 263
Appendix 7 Micronutrient concentrations at harvest ... 269
vi
Figure 1.1 Genetic relationship between four Brassica species. ... 3
Figure 1.2 OSR yield trends in the UK. ... 5
Figure 1.3 Nitrogen assimilation pathways in plants. ... 16
Figure 1.4 Mass spectrum of methanol ... 42
Figure 1.5 Schematic of triple quadrupole (QQQ) mass spectrometer. ... 45
Figure 1.6 Overview of sample preparation and protein analysis and identification. 47 Figure 1.7 Fragmentation pattern of a chemical structure of a peptide subjected to CID by MS/MS. ... 48
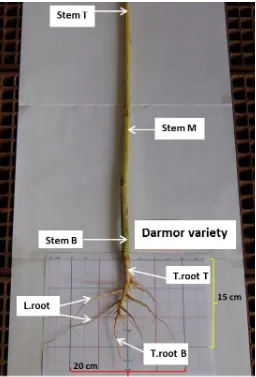
Figure 2.1 Illustration of plant sampling ... 59
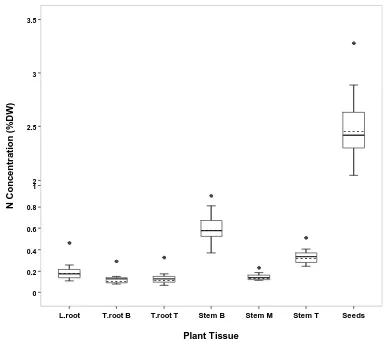
Figure 2.2 Variation in N concentration of different plant tissues among 14 Brassica napus L. accessions at the seed development stage GS 6.2/6.3 ... 66
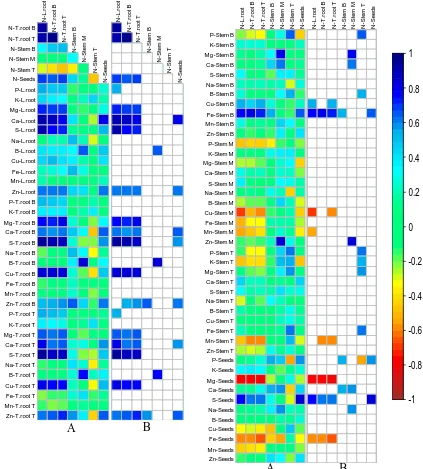
Figure 2.3 Pair-wise correlation analysis between N traits and other 77 traits in 14 B.napus genotypes at GS6.2/6.3. ... 69
Figure 2.4 Relationship between N concentration and S, Ca, Cu and P concentration within different tissues at GS 6.2/6.3. ... 71
Figure 2.5 Total N concentration of different plant tissues among three crop types (Winter OSR, Swede and Spring OSR) of Brassica napus L. at harvest. ... 74
Figure 2.6 Variation in N concentration of different plant tissues among 30 Brassica napus L. accessions at harvest. ... 75
vii
Figure 2.9 Relationship between seed N concentration and Zn and B concentration at harvest. ... 80 Figure 2.10 Roots N concentration across two growth stages; GS 6.2/6.3 and harvest
among 14 B. napus L. accessions... 83 Figure 2.11 Stem and seeds N concentration between two growth stages (GS 6.2/6.3
and harvest) among 14 B. napus L. accessions. ... 84 Figure 3.1 Variation in macronutrient concentrations across different tissues among
14 genotypes of Brassica napus at GS 6.2/6.3. ... 105 Figure 3.2 Variation in micronutrient concentrations across different tissues among 14
genotypes of Brassica napus at GS 6.2/6.3. ... 107 Figure 3.3 Pair-wise correlation analysis of all 77 traits in 14 genotypes of B.napus
using genotype mean at GS 6.2/6.3. ... 109 Figure 3.4 Variation in macronutrient concentrations across different tissues among
30 genotypes of Brassica napus at harvest. ... 112 Figure 3.5 Variation in micronutrient concentrations across different tissues among 30
genotypes of Brassica napus at harvest. ... 115 Figure 3.6 Pair-wise correlation analysis of all 77 traits in 30 genotypes of B.napus
using genotype mean at harvest. ... 118 Figure 3.7 P concentration across seven tissues between two growth stages (GS 6.2/6.3
and harvest) among 14 Brassica napus genotypes. ... 122 Figure 3.8 K concentration across seven tissues between two growth stages (GS
viii
Figure 3.10 B concentration across seven tissues between two growth stages (GS 6.2/6.3 and harvest) among 14 Brassica napus genotypes. ... 126 Figure 3.11 Mn concentration across seven tissues between two growth stages (GS
6.2/6.3 and harvest) among 14 Brassica napus genotypes. ... 127 Figure 3.12 Comparison in K concentration (%DW) between two digestion methods. ... 129 Figure 4.1 Change in SDS-PAGE profile of soluble proteins in roots of Ningyou 7
variety. ... 158 Figure 4.2 Changes in SDS-PAGE profile of soluble proteins in roots of Tapidor DH
variety. ... 159 Figure 4.3 Changes in SDS-PAGE profile of soluble proteins in bottom of the stem of
Ningyou 7 and Tapidor DH varieties. ... 160 Figure 4.4 changes in SDS-PAGE profile of soluble proteins extracted from silique
walls and the stem adjacent to siliques (stem S) of Tapidor DH. ... 161 Figure 4.5 Overview of protein identification using Scaffold. ... 166 Figure 4.6 Number of identified proteins in Ningyou 7 (N) and Tapidor DH (T). .. 167 Figure 4.7 Quantitative difference between the genotypes Ningyou 7 and Tapidor DH. ... 168 Figure 4.8 Differences in the expression of two identified proteins between Ningyou
ix
population. ... 192 Figure 5.5 Frequency distribution of six phenotypic traits in the TNDH segregating
population. ... 194 Figure 5.6 The linkage map for three linkage groups (A01, 02 and 03) depicts the
detected QTLs. ... 198 Figure 5.7 The linkage map for three linkage groups (A04, 05 and 06) depicts the
detected QTLs. ... 199 Figure 5.8 The linkage map for three linkage groups (A09, 10 and C1) depicts the
identified QTLs. ... 200 Figure 5.9 The linkage map for three linkage groups (C3, 7 and 9) depicts the identified
QTLs. ... 201 Figure 5.10 Protein expression pattern without normalisation. ... 203 Figure 5.11 Protein expression pattern with normalisation to GAPDH... 204 Figure 5.12 The expression pattern of the unknown function protein in ten lines of the
TNDH population with the parental lines. ... 205 Figure 5.13 The expression pattern of NIT2 in ten lines of the TNDH population with
x
Table 1.1 Global production area of OSR during last two decades (ten thousands
hectares). ... 4
Table 2.1 Ratio of N to six macronutrients (P, K, Mg, Ca, S and Na) within seven tissue types at GS 6.2/6.3. ... 72
Table 2.2 Analysis of Variance for the N concentration at harvest. ... 73
Table 2.3 Ratio of N to six macronutrients (P, K, Mg, Ca, S and Na) within seven tissue types at harvest. ... 81
Table 4.1 Summary of the identified proteins from gel bands. ... 162
Table 5.1 List of proteins subjected to quantification study ... 181
Table 5.2 List of the phenotypic traits measured. ... 184
Table 5.3 Phenotypic traits estimates of the parental lines and the TNDH population. ... 191
xi ABC Ammonium bicarbonate
AFLP Amplified fragment length polymorphism
AHDB Agriculture and Horticulture Development Board AMT Ammonium transporter
ANOVA Analysis of variance
APS Adenosine phosphosulphate ATP Adenosine triphosphate
ATs Multi-affinity transport system protein βME β‐mercaptoethanol
CID Collision-induced dissociation cM centiMorgan
CV Coefficient of variation
DF Deflowering - removal of flowers DH Doubled haploid
DNA Deoxyribonucleic acid DP Depodding, removal of pods DTT Dithiothreitol
DW Dried weight
EDTA Ethylenediaminetetraacetic acid EEA European Environment Agency ESI Electrospray ionisation
FASP Filter aided sample preparation FDR False discovery rate
FIA Flow injection analysis FLC Flowering Locus C FT Flowering time FW Fresh weight
xii
GOGAT Glutamate-oxoglutarate aminotransferase GS Growth stage
HAT High affinity transport system protein HPLC High performance liquid chromatography IAA Iodoacetamide
ICP-OES Inductively coupled plasma optical emission spectrometry IM Interval mapping
LAT Low affinity transport system protein LC Liquid chromatography
LG Linkage group LOD Limit of detection
LOD Logarithm of odds (base 10) LS Lateral main stem
LSD Least significant difference
MALDI Matrix-assisted laser desorption ionisation MFH Main inflorescence height
Mha Million hectares
MQM Multiple QTL mapping MS Mass spectrometry m/z Mass to charge ratio NB Mumber of branches NiR Mitrite reductase
NIT2 Indole-3-acetonitrile nitrilase NPB Number of pods on the branches NPMF Number of pods on the MF NR Nitrate reductase
xiii OSR Oilseed rape
PAGE Polyacrylamide gel electrophoresis PAPS Phosphoadenosine phosphosulphate PH Plant height
Pht1 Phosphate transporter 1 Pi Inorganic phosphate PMF Peptide mass fingerprint
PMSF Phenyly-methyl-sulphonyl fluoride pQTL Protein QTL
Q Quadrupole
QRT-PCR Quantitative reverse transcription polymerase chain reaction QTL Quantitative trait locus/loci
r Correlation coefficient
RFLP Restriction fragment length polymorphism RIL Recombinant inbred line
RNA Ribonucleic acid SD Standard deviation SDS Sodium dodecylsuphate SEM Standard error of the mean SHB Stem height to the first branch SHP Stem height to the first pod SLAF Specific locus amplified fragment SNP Single nucleotide polymorphism TFA trifluoroacetic acid
TNDH Tapidor DH and Ningyou 7 mapping population TNP Total number of pods
TOF Time of flight
xiv
Firstly, I would like to express my gratitude to both my supervisors, Dr Guy Barker and Dr Graham Teakle. I thank you for both for your advice, guidance and endless support you have given me throughout my PhD. I also thank you for your patience and encouragement during the preparation of this thesis.
Secondly, I would like to acknowledge the Syrian Government as my funding body as without their financial sponsorship, both my PhD and MSc degrees would not have been feasible. In the proteomics department of Life Sciences at the University of Warwick, I would also like to thank Dr Sue Slade, Dr Alex Jones and Dr Cleidiane Zampronio for their proteomics advice, support and numerous discussions. I also thank Matthew Mitchel for his advice, suggestions and discussions on mineral analysis. Thanks to all the members of the Barker research group. I enjoyed all the enjoyable times we shared both in the office or chatting away in the lab. I won’t forget Lab C.46 anytime soon!
xv
I hereby declare that the work contained in this thesis is the original work of the author, except where specific reference is made to other sources, with the nature and extent of the author’s contribution indicated (as appropriate) where work was based on collaborative research. The work was undertaken at the School of Life Sciences, University of Warwick between October 2011 and June 2016 and has not been submitted, in whole or in part, for any other degree, diploma or other qualification.
xvi
The aim of this project was to enhance our knowledge of how nitrogen is transported and utilised within Brassica napus through the use of proteomics, phenotyping and genetic mapping. It highlights the importance of looking at all possible plant tissues to determine the mechanisms underlying seven macronutrients (N, P, Mg, Ca, S and Na) and five micronutrients (B, Cu, Fe, Mn and Zn) accumulation, since differences were observed between different tissues. Significant amount of mineral elements were found to remain in both the stem and roots at harvest, which in turn, highlights the inefficient mechanisms applied by some plants in the way they redistribute and utilise minerals such as N, P, K and S. Large genotypic differences in minerals concentration was found between different accessions of B. napus, ranging from 1.48-fold for Ca in the bottom of the stem to 20-fold for Na in top of the stem at maturity. Genotypes were identified that differed significantly from one another in relation to mineral concentration in the stem and root at harvest or in both. Differences were observed in the parents of the TN mapping population allowing a QTL approach to be adopted. Complex network of relationships between minerals were observed within and between tissues, and found to be dependent on the tissue and the growth stage. The strongest significant positive correlations (0.91 > r >0.71) were between Ca/P, S/Ca and N/Ca in taproot, Ca/Mg in stem, and Mg/P and N/S in seed.
A significant source of N is that stored within proteins. Several proteins were shown to be accumulated significantly in the top part of the plants especially in the senescing silique walls and the stem adjacent to them. Putative vegetative storage proteins, VSPs, were identified in these tissues and we have suggested that these could be associated with N remobilisation. Development of a screening methodology based on these proteins through which quantitative analysis could be performed on a proteomic based experiment has been successfully developed which will allow the identification of QTLs associated with the N remobilisation and utilisation in plants.
1
2
1.1
Oilseed rape (Brassica napus L.)
Oilseed rape (OSR, Brassica napus L), also referred to as rapeseed, rape or canola, is an important crop in the Brassicaceae family (formally the Cruciferae family) it is considered a major source of both oil and fat for human nutrition. The meal remaining after oil extraction is also a valuable source of nutrients essential for animal feed. More than 173 million tons (Mt) of vegetable oil was produced worldwide in 2014, of which approximately 15 % was credited as rapeseed oil (FAOSTAT, 2017).
1.1.1
B. napus
origin
Throughout the globe, four Brassica species are widely grown as oilseed crops. These include (1) Brassica napus (Swede rape), (2) Brassica juncea (Indian mustard), (3)
Brassica carinata (Ethiopian mustard) and (4) Brassica rapa (Turnip rape). Three of these species are the result of hybridisations between the diploid species of Brassica rapa (A, n=10), Brassica nigra (B, n=8) and Brassica oleracea (C, n=9) (summarised in Figure 1.1). The resulting hybrids are amphidiploids and are Brassica juncea (AB, n=18), Brassica napus (AC, n=19) and Brassica carinata (BC, n=17) (Bunting, 1984; Downey and Rimmer, 1993). All these species are grown specifically for oilseed in different regions, they are then grouped using the terminology of oilseed rape or rapeseed.
Brassica juncea is widely cultivated in India and some regions of China. Brassica carinata is cultivated in North East of Africa. The winter varieties of Brassica napus
3
varieties of B. napus are cultivated in both cold and warm climates. Specifically, spring oilseed rape is grown in Canada where the growing season is restricted to the summer due to the severe cold during the winter, whereas spring oilseed rape is grown in the milder winter season in Australia because the summer is too hot and dry.
Figure 1.1 Genetic relationship between four Brassica species.
Brassica napus is an amphidiploid (AC, n =19) derived from the cross between Brassica rapa and oleracea.
1.1.2
Oilseed rape production area
4
Table 1.1 Global production area of OSR during last two decades (ten thousands hectares).
1980 1985 1990 1995 2000 2005 2010 2014
World 1099 1472 1761 2382 2584 2769 3223 3576
Canada 208 278 253 527 486 518 685 807
India 347 399 497 606 603 732 558 720
China 284 449 550 691 749 728 737 655
Australia 2 7 7 38 146 97 170 272
France 39 47 68 86 119 123 146 150
Germany 26 41 72 97 108 134 146 139
Poland 32 47 50 61 44 55 95 95
UK 9 30 39 44 40 59 64 68
USA 0 0 3 17 61 45 58 63
(FAOSTAT, 2017)
1.1.3
Oilseed rape yield trends
OSR yield is calculated on the weight of the seed at a standardised 90 g/kg (9 %) moisture content. The yield of OSR seeds varies considerably throughout the world. Since the year 2000, the average yield of OSR has been around 3 tonnes/hectares (t/ha) in the United Kingdom (Figure 1.2), France and Germany, 2.4 t/ha in Poland, and between 1.0 - 1.6 t/ha in Australia, Canada, India and China. The average yield increase per year has been relatively constant since the middle of sixties in countries such as China, India, Canada and Germany, with reported average annual increases in yield of 30, 15, 14 and 39 kg/ha respectively.
5
Figure 1.2 OSR yield trends in the UK.
Graph illustrates the steady incline in OSR yield observed over the last two decades (FAOSTAT, 2017).
Figure 1.2 shows that rapeseed yield in the UK has remained constant at 3-3.5 t/ha in recent years. However, the potential yield of rapeseed in the UK could be 6.5 t/ha , through production of ca. 130,000 seeds/m2 and extending the seed filling to last for a period of 46 days (Berry and Spink, 2006). This lack of increase in the yield of OSR could be due to 1) lack of genetic improvement; 2) the potential yield has reached its limit and 3) alternations in crop management. The first two points are unlikely to be a contributing factor for the halt in OSR yield in the UK due to the introduction of new varieties of oilseed rape each year. The measured yield potential of the best varieties reported in the recent AHDB OSR Recommended List trial yields for the years 2013-2017 range from 4.6 - 6 t/ha (AHDB, 2013-2017). When cultivated under optimum growing conditions, they caused a yearly increase of 62 kg/ha between the end of the 1970s to 2005. Rather, a combination of varying crop management practices has been attributed
0 0.5 1 1.5 2 2.5 3 3.5 4 4.5
yi
el
d
(
t/
h
a)
6
to the stable OSR yield. These practices include 1) shorter rotations (faster rotations for more profitable outcome), 2) minimal cultivation (opposed to ploughing), 3) less sulphur and nitrogen fertiliser and 4) reduced fungicide application. Prior to 1970, the majority of plants received an adequate amount of sulphur dioxide (SO2) from the
environment. However, due to restrictions on highly reactive gaseous emissions, the emission of sulphur oxides was reported by the European Environment Agency (EEA) to decrease by ca. 74 % between the years 1990 to 2011 (EEA, 2016). Brassica crops require a minimum of ca. 30 kg of sulphur/ha for efficient plant metabolism, in part due to the requirement of the sulphur-containing glucosinolate compounds produced by brassicas. Despite the large decrease of sulphur, farmers appear slow to supplement their crops with the appropriate quantity of S fertiliser.
1.1.4
Importance of OSR crop
Approximately 85 % of the harvested seeds of OSR are subjected to oil extraction process which yields 40 – 45 % oil, rendering it an important cultivated crop in the UK. Rapeseed oil is rich source of unsaturated fatty acids of which oleic acid compose the majority with approximately 60 %, only olive oil having a greater proportion with about 73 %. After oil extraction, the remainder of the product, known as meal, contains high content of protein up to 32 – 40 %. Once subject to heat treatment to remove toxic components such as glucosinolates, this secondary product can be used as animal feed. A further 10 % of the oilseed rape yield is exported and the remaining yield (5 %) is used for other uses such as production of biodiesel (Twining and Clarke, 2009; Weightman et al., 2010). The total production of rapeseed oil in 2014 worldwide is
7
of vegetable oil worldwide after oil palm (57.3 Mt) and soybean (45.7 Mt) and the second in Europe behind sunflower (12.1 Mt) (FAOSTAT, 2017).
In the UK, oilseed rape is grown as a valuable break crop within the cereal crop rotation. Additionally, OSR is grown as a catch crop due to its ability to absorb N from the soil during Autumn and early Winter. It is readily able to decrease the leaching of nitrate from the arable crops. Moreover, important ecologically, oilseed crop provides a nesting place for birds and a considerable amount of early pollen for bees (Weightman et al., 2010). As with all higher plants, both the growth and production of OSR is dependent on the availability of several mineral elements. Therefore, a brief introduction to the essential elements and their available mineral forms that plants absorb from the soil solution is discussed below.
1.2
Minerals acquisition, transport and assimilation
Derived from both the air and water, plants uptake Carbon (C), Hydrogen (H2) and
Oxygen (O2). However, to maintain their growth and complete their lifecycles, plants
8
Zinc (Zn). In addition, plants obtain beneficial, but non-essential elements such as Sodium (Na) (Barker and Pilbeam, 2007; White and Brown, 2010).
Plant roots absorb P from the soil solution primarily in the form of dihydrogen phosphate (H2PO4-) and secondarily in the form of hydrogen phosphate (HPO4-2)
(Sánchez-Calderón et al., 2010). S is primarily taken up in the form of sulphate (SO42)
from the soil solution, but plants can also absorb sulphur dioxide (SO2) or hydrogen
sulphide (H2S) from the atmosphere (Leustek et al., 2000). B is absorbed in the form
of boric acid (H3BO3) from the soil solution (Miwa and Fujiwara, 2010); K, Mg, Ca,
Mn and Na are taken up in the form of their ions K+, Mg2+, Ca2+, Mn2+ and Na+ from the soil solution (Barker and Pilbeam, 2007; Marschner, 2012b), while Cu, Fe and Zn are taken up either as their ions Cu2+, Fe2+/Fe3+ and Zn+2, or as chelates (Barker and
Pilbeam, 2007; Broadley et al., 2007). Given the importance of P, K, S and N required for both plant growth and development, these primary mineral elements will be discussed in greater detail including nutrient uptake, distribution and assimilation within the plant.
1.2.1
Phosphorus
Phosphorus (P) is a major component of nucleic acids, phospholipids and adenosine triphosphate (ATP). Thereby, it is not surprising that after N, P is the second most important macronutrient for plant growth. During the vegetative growth of the plant,
ca. 3 – 5 mg/g DW of P is required for optimum growth. P concentrations ≥ 10 mg/g DW can induce P plant toxicity (Lambers et al., 2010).
9
phytic acid (organic, unavailable form) (Richardson and Simpson, 2011). The remainder, Pi (inorganic, available form) is present which rarely exceeds 8 µM and
can be significantly reduced (< 1 µM) in highly weathered, sandy and alkaline soils (Holford, 1997). Plants have developed efficient mechanisms to adequately regulate the concentration of P. Under reduced soil P concentrations, the plant initiates additional root growth and translocates stored P from older leaves and vacuoles. In contrast, when the concentration of P is too high, it is converted to phytic acid. The form of Pi can vary depending on the pH. At physiological pH of 7.2, it exists as the
monovalent H2PO4- anion, whereas lowering the pH generates HPO42- anions. Studies
have shown that the greatest uptake of Pi occurred in the pH range of 5.0 – 6.0,
suggesting H2PO42- is the most dominate form of Pi uptake (Furihata et al., 1992).
The Pi concentration in the apoplast is ca. 2 µM, in contrast to the cytosol where it is
present in the range of 5 – 17 mM (Mimura, 2001). Overcoming this large electrochemical gradient ensures the transport of phosphate anions from the soil into the root cells requires a high-affinity and energy driven transport mechanism. This mechanism is mediated by a variety of proteins affiliated to Pht1 family of plant phosphate transporters. These proteins usually consist of 520 – 550 amino acids and are approximately 60 kDa in size. Northern blot analysis studies have identified that the Pht1 genes are expressed in the roots (Nussaume et al., 2011). Additionally, to maintain the cytosolic concentration of Pi, Pi stored in the vacuoles (which can reach
up to 120 mM) can aid in maintaining the Pi homeostasis within plants. Transport of
Pi via internal plant components occurs via the tonoplast membrane. However, this
molecular mechanism of internal Pi transport has yet to be elucidated. Phosphate acts
10
macromolecules. The acidic nature of both deoxyribonucleic acid (DNA) and ribonucleic acid (RNA) can be attributed to phosphorus. Essential for the growth of new cells and transferring genetic information from one cell to another, an adequate supply of P is necessary (Sánchez-Calderón et al., 2010; Hawkesford et al., 2012).
1.2.2
Potassium
For optimal plant growth, plants require a large quantity of potassium ca. 20 – 50 g/kg in vegetative tissues. Potassium, a univalent cation (K+), is the most prominent cation in the cytosol. The uptake of K+ is highly selective and its transport is mediated by
integral membrane ion transporter channels (White, 2012b, a). Potassium possesses various roles within the plant, depending on its location. For example, it maintains the pH between 7 and 8 in both the cytosol and chloroplasts due to its high concentration (100 – 200 mM), rendering an optimum pH for enzyme reactions. The roles of K+ are influenced by its concentration. Abnormal influx or efflux of K+ can inhibit these roles
and lead to metabolic disorders within the plant. For example, enzymes are often dependent on or stimulated by K+ (Suelter, 1970). For protein activation, the univalent cation induces a conformational change. This regularly occurs at a K+ salt
concentration of ca. 100 - 150 mM, which is the optimum pH of protein hydration. Moreover, this agrees with the K+ concentration in the cytosol. Under temporary K-deficiency the cytosolic [K+] is maintained whilst the vacuolar [K+] is decreased (Walker et al., 1996). However, plants subjected to prolonged K-deficiency; result in a decrease in the cytosolic [K+]. The consequences of which result in inhibition of
11
(Armengaud et al., 2009). K+ is also a key component in activation of membrane-attached proton-pumping ATPases (White, 2012b). For protein synthesis, higher concentrations of K+ are required in contrast to enzyme activation. It has been reported
that K+ participates in numerous steps of the translation process (Hawkesford et al., 2012).
As already mentioned, the uptake and transport of K+ throughout the plant is mediated
by high-affinity ion channels. The varying arrangement of genes results in transporters possessing different properties, such as functional, regulatory and tissue-specificity. The K+ ion channels (which are similar to Ca2+) are voltage-regulated and control the influx and efflux of K+. Additionally, these channels are influenced by the plant response to both biotic and abiotic stresses. In contrast to Ca2+, K+ behaves directly as
solutes leading to changes in the osmotic and membrane potential (Lebaudy et al., 2007).
Additional important functions of K+, include its role in cell extension and osmoregulation. A large vacuole expanding to ca. 80 – 90 % of the total cell volume is formed during cell extension. Numerous factors are required for cell extension such as 1) loosening of the cell wall, 2) synthesis and deposit of new wall components and 3) solute accumulation to generate appropriate osmotic potential for turgor pressure. K+ behaving as a solute is often attributed to cell extension in most plants. It acts by stabilising the pH in the cytoplasm and apoplast whilst increasing the osmotic potential in the vacuoles (Hawkesford et al., 2012) Potassium is also involved in the role of loading of sucrose and transport of photosynthates from source to sink in phloem transport (White, 2012a). During this process K+ maintains a high pH and contributes
12
established by work performed by Cakmak et al. (1994) on both sufficient and K-deficient plants.
Thereby, the array of processes in which K+ is involved demonstrates it importance in plant metabolism. Inadequate K supply can influence the composition and nutritional benefits of plants and fruits. K deficiency can be easily observed by retarded plant growth.
1.2.3
Sulphur
Although atmospheric sulphur dioxide (SO2) can be absorbed and used by the aerial
components of plants (Eichert and Fernández, 2012), sulphate is the most abundant form absorbed by the roots (White, 2012a). Sulphate is present as the divalent anion (SO42-) at physiological pH. Similar to N assimilation, SO42- assimilation requires
reduction prior to S incorporation into amino acids, proteins and enzymes. However, SO42- can also be directly incorporated into organic structures such as sulpholipids
(Hawkesford et al., 2012).
The uptake of S from the soil into the root cells is mediated by high-affinity H+ cell transporters. Whereas, low affinity transporters are responsible for the transport of S across the plasma membrane, in the remobilisation and storage from the vacuoles across the tonoplast. Interestingly, the transport and reduction of S in chloroplasts has yet to be elucidated (Hawkesford and De Kok, 2006).
The first step of S assimilation involves the activation of SO42- by the enzyme ATP
13
esters or sulphate reduction. In an ATP-dependent reaction, the enzyme APS kinase catalyses the formation of phosphoadenine phosphosulphate (PAPS). The resultant activated sulphate binds with a hydroxyl (OH) group, forming a sulphate ester (Saito, 2004).
Alternatively, for sulphate reduction the APS is reduced to sulphite (SO32-) mediated
by two electrons from glutathione and the enzyme APS reductase. Then occurring primarily in the chloroplast, SO32- is reduced to sulphite (S2-) via six electrons from
ferredoxin catalysed by the enzyme sulphite reductase. By the action of the enzyme
O-acetylserine (thiol) lyase (OASTL), the formed sulphite is converted to O -acetylserine (OAS) (Kopriva, 2006). The first product of SO42- assimilation is cysteine
which then behaves as precursor for all subsequent organic compounds containing reduced S (Nikiforova et al., 2004). Sulphur is also present in the other amino acids methionine (Met), and thereby constituents of proteins, and in the antioxidant glutathione (GSH). Often it acts as a structural component (R1-C-S-C-R2) or functional
group (R-SH) involved in metabolic processes. The uptake and assimilation of sulphate is regulated by 1) regulation of the sulphate transporters, 2) modulate the activity of enzyme responsible for SO42- reduction and 3) control the availability of
APS as a substrate (Vauclare et al., 2002).
14
myrosinase and re-introduced into the S assimilation pathway (Hawkesford et al., 2012).
Limited quantities of cysteine and methionine inhibit protein synthesis and decrease the concentration of chlorophyll in the leaves. The reduction in S amino acids possesses a direct implication on the nutritional quality of the resulting crop (Arora and Luchra, 1970; Hawkesford et al., 2012). Plants require between 0.1 – 0.5 % of the dry weight of sulphur for optimal growth. However, this requirement varies between crop plants, decreasing in the order of Cruiferae (11 – 17 g/kg), > Legumniosae (2.5 – 3.0 g/kg), and > Gramineae (1.8 – 1.9 g/kg), with values depicting the concentration of S in their seeds (Hawkesford et al., 2012).
1.2.4
Nitrogen
Plants absorb N from the soil solution in mineral forms such as nitrate (NO3-) and
ammonium (NH4+) which are reduced to form amino acids in the vegetative tissue
(Hawkesford et al., 2012). In addition, plants can also absorb N in organic forms such as amino acids, peptides, proteins and urea (Miller and Cramer, 2004; Näsholm et al., 2009). NO3- and NH4+ uptake into plant roots involves multi-affinity transporter
systems (ATs) proteins such as the high-affinity (HATs) and low-affinity (LATs). At low external concentrations (< 0.5 mM) of NO3- and NH4+, the uptake operates by the
15
characterised, in particular, the genes belong to the NRT (nitrate transporter), AMT (ammonium transporter) and CLC (chloride channel) families. For example, two types NO3- transporters belong to the NRT1 and NRT2 families has been identified to be
involved in NO3- acquisition by the plant root system. Transporters of the NRT1 family
are LATs, except for NRT1.1 which possesses a dual affinity. There are 53 AtNRT1
genes in A. thaliana, of which only AtNRT1.1 and AtNRT1.2 known to mediate NO3 -transport into roots (Tsay et al., 2007). However, studies showed that these two genes expressed in different location in roots. AtNRT1.1 expressed primarily in the epidermal cells of the root tip and in the cortex and endodermis of the mature regions of roots (Huang et al., 1996), while AtNRT1.2 found to be primarily expressed only in root hairs and the epidermal cells of both young and more mature roots (Huang et al., 1999). In comparison, there are only seven AtNRT2 genes belonging to the NRT2 family which are considered as HATs, of which only two genes; AtNRT2.1 and
AtNRT2.2 are involved in NO3- transport into roots (Tsay et al., 2007). Following its
uptake form the soil soliton into the root system, NO3- will be then transported via
different NRT members and located within different plant tissues. For example, NRT1.5 is located in the plasma membrane and encoded by the AtNRT1.5 gene in A. thaliana. This gene is expressed in the pericyclic cells of the root near the xylem which found to be mediating the long-distance NO3- transport from the root to the shoot (Lin et al., 2008).
Similar to the reduction and assimilation of CO2 in photosynthesis, the uptake and
assimilation of N is tightly regulated. The NO3- assimilation pathway is a multi-step
reaction. It requires two key enzymes in order to assimilate NO3- into organic
16
electron reduction of NO3- to nitrite (NO2-). The resulting NO2- is translocated to the
chloroplast and via nitrite reductase (NiR), the second enzyme of the pathway, is reduced to ammonium (NH4+) as shown in Figure 1.3.
Figure 1.3 Nitrogen assimilation pathways in plants.
The transport, storage, reduction and assimilation pathway(s) of both NO3- and NH4+. Both NO3- and NH4+ are facilitated by protein
transporters (NRT2, NRT1 and AMT) to enter the cytosol of the cell to be stored in the vacuole or subject to reduction to be assimilated to amino acids. This figure is adopted from Daniel-Vedele et al. (2010).
Interestingly, despite being present at lower concentration, NH4+ is the preferred
17
immediately upon absorption. For several years, ammonium assimilation was believed to be mediated by the enzyme glutamate dehydrogenase (GDH). However, additional studies have revealed that GDH also releases ammonium during senescence (Labboun
et al., 2009).
Regardless of NH4+ being accumulated from nitrate reduction or directly absorbed
from the soil, the assimilation is mediated by two enzymes. These include both glutamine synthetase (GS) and glutamine-oxoglutarate aminotransferase (GOGAT). The amino acid glutamate behaves as an acceptor for ammonium, generating glutamine. Predominately occurring in the plastids of plants, the second enzyme, GOGAT catalyses the transfer of the amide (-NH2) group from glutamine to
2-oxoglutarate (a product from the tricarboxylic acid cycle). This forms two molecules of glutamate (Glass et al., 2002; Daniel-Vedele et al., 2010). One glutamate molecule maintains the ammonium assimilation cycle, whereas the second glutamate molecule is translocated from the assimilation site and used for the biosynthesis of proteins. An overview into the role and importance of N-base fertiliser within OSR plants as well as N uptake, remobilisation and use efficiency is provided.
1.3
Nitrogen within OSR plants
1.3.1
Importance of N fertiliser and its application time
18
plant metabolism and development (Epstein and Bloom, 2005) such as reduction in leaf area and plant content of chlorophyll. This inevitably reduces the rate of photosynthesis and the quantity of derived products thus reducing plant biomass as well as decreasing the oil and protein yield (Tegeder and Rentsch, 2010). It has well been documented in OSR crop that N availability is immensely associated with the increase in number of leaf per plant (Svečnjak and Rengel, 2006b), leaf area and chlorophyll content (Ogunlela et al., 1989), number of siliques per plant (Svečnjak and Rengel, 2006b) and seed yield (Rathke et al., 2005; Schulte auf‘m Erley et al., 2011; Koeslin-Findeklee and Horst, 2016). Therefore to maximise OSR yield it is necessary to supply supplementary N in fertilisers. The Defra RB209 Fertiliser Manual (Defra, 2010) details the recommended application rates, depending on the residual soil Nitrogen supply levels. However, much of central UK is ecologically at risk of excess nitrate applications, especially with leaching into water supplies, and are covered by nitrate vulnerable zones (NVZs) to protect them. In NVZs the applications of N is governed by further restrictions, detailed in (Defra and EA, 2016).
19
the capacity to absorb ca. 3 kg N/ha per day until flowering time, no single addition greater than 100 kg/ha is recommended (Berry et al., 2014).
1.3.2
Nitrogen uptake
N absorption by the root system is dependent on several factors such as soil moisture and thermal condition, root architecture and the volume of soil investigated by the roots, and the soil N availability and form which regulate the transporters activity of NO3- and NH4+ (Xu et al., 2012). A range of studies were performed to investigate the
relationship between plant root growth and N absorption at different plant development and growth stages, focused on significance of the root length over root biomass to increase N uptake efficiency in OSR (Kamh et al., 2005; Schulte auf’m
Erley et al., 2007; Berry et al., 2010a). However, due to the energetic cost of root growth, alternative approaches which strike a balance between N absorption activity and metabolic cost are more favourable. Increasing fine roots density, the abundance of aerenchyma tissue within the root cortex, and root-mycorrhiza association can be efficient strategies to increase N absorption efficiency (White et al., 2013; Lynch, 2015).
As it has been described previously, plant absorption of NO3- and NH4+ into the roots
is mediated by members of the transporter families. However, the rates of absorption differs according to the plant growth stage. In B. napus L., it has been shown that NO3- uptake increases from the beginning of stem extension until the onset of
flowering, whereas little uptake of NO3- occurred during the pods filling stages
20
high rate after the beginning of the seed development stage; GS 6.1 seeds expanding, particularly within highly N efficient genotypes at low level of N supply Horst et al.
(2003).
In the study of Berry et al. (2010b), it has been shown that the most critical time of N uptake in OSR life cycle is after plants flowering. Moreover, the proportion of N obtained at this stage is a major factor influencing the determination of the genotypic variation in seeds yield of OSR crop. In the same study, it was also reported that every new addition of one kg/ha of N during the flowering time contributed to an increase of 16 kg/ha in seeds yield.
1.3.3
Nitrogen utilisation and remobilisation
21
Despite the high capacity of B. napus plants to obtain N from the soil, OSR cultivated in the field, as it is reported in many studies (Schjoerring et al., 1995; Rossato et al., 2001; Chamorro et al., 2002; Zhang et al., 2010), has a very low level of N uptake in plants when calculated as the total plant N content divided by the applied amount of N. The quantity of N remobilised from the vegetative organs to the siliques does not exceed 45 to 67 % regardless of the added quantity of N to the plant through the soil. Under deficient N environment ( no added N), more than 56 % of the shoot N content is stored in the stem and the rest in leaves at the onset of flowering (Ulas et al., 2013). In contrast, approximately 30 – 40 % of the total N of the plant canopy was located in pod walls at the end of flowering stage (Schjoerring et al., 1995). The vegetative parts of plant (stem, taproot and leaves) are crucial components in supplying the N during seed development stages (Rossato et al., 2001; Malagoli et al., 2005a; Ulas et al., 2013). As demonstrated by Malagoli et al. (2005a) and Gombert et al. (2010) over 70 % of the total pods N recovered from the vegetative organs, of which 8 – 16 % is derived from taproot, 22 % from the flowerings parts, 34 – 47 % from stem, and 36 % from leaves. The greatest portion of N remobilised to seeds is obtained during the stem extension stage of plant growth (Zhang et al., 2010; Ulas et al., 2013). Berry et al.
22
1.3.4
Nitrogen Use Efficiency
Nitrogen use efficiency is defined as dry mass produced/unit of available nitrogen absorbed from the soil (Hirose, 2011). N use efficiency can be further split into Nitrogen uptake efficiency and Nitrogen utilisation efficiency, relating to the efficiency of N absorbed and efficiency to convert absorbed N to yield, respectively. Despite the high capacity of B. napus plants to obtain N from the soil, particularly before flowering, OSR has an innate low N Use Efficiency (Sylvester-Bradley and Kindred, 2009; Sieling and Kage, 2010), of less than 10 kg dry matter/kg N, compared to 69, 31, 27, 25 and 21 for sugar beet, triticale, winter oats, winter wheat and malting spring barley, respectively (Sylvester-Bradley and Kindred, 2009). As previously reported this is primarily due to confluence of two factors; an inadequate efficiency of N remobilisation from the vegetative tissues to the siliques as previously described (Malagoli et al., 2005a; Gombert et al., 2006; Koeslin-Findeklee and Horst, 2016) as well as low N uptake, in particular, post-flowering N uptake (Berry et al., 2010b). Interestingly, several field studies under limiting N fertiliser conditions have reported on an increased association between N uptake efficiency and N use efficiency compared to N utilisation efficiency (Berry et al., 2010b; Schulte auf‘m Erley et al., 2011; Kessel et al., 2012; Nyikako et al., 2014).
23
which does not provide breeders with an incentive to develop varieties with improved N use efficiency. Furthermore, the same identical OSR genotypes may respond differently under low supply of N. Thereby, it is necessary to breed and test OSR varieties under low quantities of N to identity both the plant characteristics and traits which would best suit a limited N environment (Berry et al., 2010b; Schulte auf‘m
24
certainly be of great importance for sustainable crop production and food security in the future (Bouchet et al., 2016).
It has been reported that an increase in N Use Efficiency of 7.2 kg DS/kg N accompanied with a reduction in N fertiliser requirement of about 49 kg/ha might be achieved by breeders, this could be achieved through: I. Reduction of N concentration remaining in stem and pod wall at harvest by 0.4 %, II. Increasing the plant capacity to absorb N after flowering by 20 kg/ha, III. Increase the density of root length to 1 cm/cm3 in the first 100 cm of the soil depth (Berry et al., 2010a). Using his simulation
model on N dynamics in OSR plants grown in the field to improve N Use Efficiency, Malagoli et al. (2005b) showed that a possible improvement of 15 % in N content or harvested seed could be achieved by optimising the mechanism by which N mobilise from the vegetative tissues to the siliques during seed filling phases as well as reducing concentration of the remaining N in falling leaves. The benefit of increasing the value of N Use Efficiency is not limited to plant breeders but can impact the global economy, for example through a reduction in the emissions of greenhouse gas (GHG) as well as in the amount of nitrate leaching to the water body is also of great importance.
1.3.5
Environmental impact of N fertilisers
The total production of N fertiliser increased worldwide from 85.3 Mio t in 2002 to 113.3 Mio t in 2014 (FAOSTAT, 2017). The use of N fertilisers can lead to a number of environmental problems. The first is that manufacture of N fertilisers initially makes use of the Haber-Bosch process to fix gaseous N2 to form ammonia. This process
25
Actually, over 1 % of the energy produced in the world is used in this process (Smith, 2002) which means that N fertiliser has a very high carbon footprint.
Secondly, only about 60 % of the N fertiliser applied to OSR is taken up by the crop. The remainder can either leach into streams and rivers where it can cause eutrophication, hence the NVZs, or it is broken down by soil microorganisms to produce nitrous oxide (N2O) (Butterbach-Bahl et al., 2013). This is a potent
greenhouse gas with a global warming potential of 298 times compared to CO2. It has
been reported that GHG emissions averaged 1080 kg CO2 equivalent associated with
a production of optimal yield (3.2 t/ha) of OSR under the standard OSR crop inputs in the UK, including fertilisers, seeds, pesticides and fuel (Weightman et al., 2010; Berry
et al., 2011), N fertiliser is responsible for more than 79 % of these GHG emissions (Mahmuti et al., 2009). In total, N fertiliser application accounts for more than 50 % of the total energy use in crop production (Woods et al., 2010).
1.3.6
Financial contribution of fertiliser
26
of fertiliser and in particular N, will undoubtedly increase the profitability of OSR. Aforementioned, enhancement of N Use Efficiency, is in important target for plant breeders (Berry et al., 2010b) as it can increase profitability of OSR production either through greater seed production or by a cost reduction of N-based fertiliser. Reducing the amount of N fertiliser input to OSR is cost-effective for famers and supported by environmental concerns.
Since restrictions on cultivation of genetically modified crops have been applied in many countries in the world, exploring the natural genotypic variation is of great interest for plant breeders to improve minerals use efficiency. One of the main approaches to explore such natural variation in several crops is using Quantitative Trait Loci (QTL) analysis (Hawkesford et al., 2014). This analysis requires a segregating population obtained from the cross between two parental genotypes by which a genetic map is generated. Using this linkage map in addition to phenotypic traits can lead to the identification of genomic regions associated with these traits. Throughout this thesis, QTL analysis has been used to identify QTLs related to yield, yield related traits and proteomic traits that contribute to N storage and remobilisation. For this reason, a brief description to quantitative traits, mapping population and QTLs related to several traits in OSR is provided.
1.4
Quantitative Trait Loci
1.4.1
Introduction to Quantitative traits
27
the genes associated with a specific quantitative trait. QTL determines positions of the DNA which are in close proximity to the gene of interest. The design of molecular markers in the 1980s enhanced the opportunity to identify and select for QTL (Collard
et al., 2005).
The function of molecular markers is to demonstrate genetic variances, known as polymorphisms, between organisms or species. These molecular markers occupy specific positions within the chromosome called “loci”. Markers closely located near the gene of interest are said to be linked to the gene and are often referred to as “gene tags”, while at larger distances from the target gene the markers are referred to as “signs or flags” (Collard et al., 2005). Different markers are available to use for QTL identification: 1) morphological, 2) enzymes and 3) molecular markers, and each marker is utilised to determine specific traits such as phenotypic, enzyme differences and variation sites in DNA, respectively. In plant genome studies an array of DNA markers are available, such as SNP (single-nucleotide polymorphism), RFLP (restriction fragment length polymorphism), AFLP (amplified fragment length polymorphism), and SSR (single sequence repeats) (Semagn et al., 2006; Collard and Mackill, 2008).
28
(Gupta et al., 1999). One of the primary application of these markers is to produce genetic mapping.
1.4.2
Mapping population and linkage map
A major use of molecular markers in agricultural studies has been in the assembly of linkage maps for segregating populations generated from crosses between two parent plants that have differing properties. These maps have been exploited to locate the chromosomal regions possessing genes which are responsible for the traits. Linkage maps illustrate the locus and relative genetic distances between the molecular markers along chromosomes. The construction of linkage maps and performing QTL-analysis to isolate genomic regions linked with traits is known as QTL-mapping (Mohan et al., 1997). There are an array of benefits associated with QTL analysis including but not limited to 1) identification of traits affected by the environment e.g. salinity, nutrient availability and drought, 2) test trait associations, 3) determination of genes to clone (Salvi and Tuberosa, 2005).
29
populations is their short acquisition times to produce a functional population. DH populations are predominately used in mapping chromosomes and identification of genetic markers (Forster et al., 2007). The mapping population used in the present study was produced from the F1 cross between two contrasting parental genotypes belonging to different geographical locations by microspore culture (Qiu et al., 2006). Tapidor DH, the female genotype, is a European winter variety which has a high requirement of vernalisation, a low seed content of erucic acid and glucosinolates (Qiu
et al., 2006), and characterised as a B-inefficient cultivar (Liu et al., 2009a). In contrast, Ningyou 7, the male genotype, is a Chinese semi-winter variety with a low requirement of vernalisation, a high seed content of erucic acid and glucosinolates (Qiu et al., 2006), and is characterised as a B-efficient cultivar (Liu et al., 2009a). The population is thereby referred to as TNDH mapping population from which a total of 202 DH segregating lines were produced in 2002. A linkage map of 19 linkage groups (LGs) was generated with an average interval of ca. 3.02 cM between adjacent markers. This mapping population has been initially used to identify QTLs associated with seed content of oil and erucic acid under field conditions (Qiu et al., 2006). Several mapping populations have been developed in B. napus and different plant species such as Arabidopsis thaliana, wheat (Triticum aestivum L.) and maize (Zea mays L.) to map several agronomic quantitative traits and identify the genomic region associated with them as the initial step to determine and characterise the related genes.
1.4.3
QTLs for several traits in OSR
30
glucosinolates content, flowering time, abiotic stress, and resistance to diseases. However, a limited number have been mapped for mineral use efficiency.
1.4.3.1 Seed yield and yield related traits
Seed yield is very complex trait that is influenced by several yield components, mainly; seed and pod number per m2 , seed number per pod, number of branches per plant and individual seed weight (Berry and Spink, 2006). The seed yield and harvest index (seed dry matter/total plant dry matter) have been the primary target for plant breeders for years, as key steps for improved N use efficiency. However, these are limited to analysis at the end of the crop life cycle. As such they possess additional factors such as plant growth, abiotic and biotic stresses which contribute to the overall N use efficiency (Bouchet et al., 2016). Many QTLs for yield and yield related traits have been previously mapped in B. napus. Quijada et al. (2006) and Radoev et al.
31
was found among these different segregating populations and environments, in addition 25 loci were characterised as multifunctional loci where each locus regulated at least two traits. Further comparative genomic analysis with A. thaliana identified 80 brassica genes, underlying yield and yield related QTL these were homologous to 61 genes of A. thaliana due to the triplicated nature of the brassica genome and B. napus’s amphidiploid composition. 69 of these genes were determined to be localised
on the A genome where the LG A07 carried the greatest number of genes of 11 in comparison with nine other LGs.
1.4.3.2 Seed oil content and quality, and glucosinolates content
OSR is cultivated primarily for its rich seed in oil content. The preference to develop genotypes with a very low erucic acid concentration and relatively low glucosinolates content, was for many years a major focus for plant breeders. Many studies have been involved in the identification of QTLs associated with oil content. Qiu et al. (2006) used the TNDH population under field conditions and detected a QTL on the LG A08 at two distinct environments in China and two growing seasons. Delourme et al.
32
two QTLs on chromosome C3 were associated with all of these fatty acids (Javed et al., 2016). Several QTLs associated with seed glucosinolates content were also identified (Howell et al., 2003; Feng et al., 2012). In a recent study by Huang et al.
(2016), a QTL was identified, using RILs population derived from two contrasting parents. The glucosinolates content determined by these loci (28 and 60 µmol/g), explained 47.71 % of the phenotypic variation localised on the chromosome A10.
1.4.3.3 QTLs associated with flowering time
33
of the phenotypic variation. Recently, a major locus explaining 21.7 % of the flowering time variation has been detected on the LG C5 with two genes identified, light regulated LWD1 and flowering BHLH1 (ArifUzZaman et al., 2016).
1.4.3.4 QTLs for N use efficiency
Despite the significant effect of N fertilisation on OSR production and in contrast to the previously discussed agronomic traits, few studies have been performed for the identification of loci associated with N use efficiency and its related traits under contrasting N conditions in B. napus (Gül, 2003; Miro, 2010; Bouchet et al., 2014). Hence, little is known of the description and function of these identified genomic regions. Using the TNDH segregating population to map several N use efficiency and its related traits under low and adequate N environment over two growing seasons, Miro (2010) reported that 49 – 72 and 44 – 62 QTLs were detected under adequate and limiting N environment, respectively, with significant interactions between genotype and N environment were reported. For example, 10 QTLs for N uptake efficiency were only detected at low N environment and localised mostly on the LG A01, while 7 QTLs for N utilisation efficiency were only identified at high N availability and localised mostly on chromosome C7.
34
Likewise, Gül (2003) identified six to eight QTLs associated with yield components under contrasting N availability, respectively, with no interaction between genotype and N environment, contrary to that reported by Miro (2010).
1.4.3.5 Other minerals composition and use efficiency
Minerals acquisition, distribution, accumulation and utilisation are under the control of complex regulatory networks from the moment of absorption until the final metabolites are being utilised by the plant cells (Hawkesford et al., 2012). Thereby, QTL analysis offers a powerful strategy to unravel such complex traits. Liu et al.
(2009a) unravelled the complexity of shoot composition of seven minerals with QTL analysis using the TNDH mapping population. 18 and 17 QTLs explaining 4.4 – 19 % of the phenotypic variation, were mapped using limited and adequate B supply respectively. Significant interaction between genotype and B environment, in addition to 74 epistatic QTLs were detected. A major QTL associated with P concentration was identified on the LG A01 under both B environments explaining 17.4 and 19 % of the trait variation, where the cultivar Ningyou 7 contributed to the allele accounted for increasing shoot P concentration. Additionally, some mineral QTLs were co-localised, for example, QTLs associated with Ca and Mg on LGs A03, A06 and C8, with P and B on LG A01 and with B and Cu on LG A04. In a different study that a RIL population was used to map QTLs associated with seven seed minerals composition, Ding et al.
35
(Ca, Mg, P, Zn and Cu) concentration under adequate P supply. However, these QTLs were detected on different LGs under low N supply and only explained a small proportion of the trait variation. As such these results, could reflect the difficulty of increasing seed composition of minerals under limiting P environment. Using the comparative analysis with A. thaliana genome, Liu et al. (2009a) and Ding et al.
(2010) managed to map 26 and 21 orthologous genes involved in ion homeostasis in
B. napus. These included, for example, different members of each of Mg transporter, P transporter, high-affinity Cu transporter, PAP, YSL, ZIP CAX and CCX family. A recent study used genome wide association to map shoot ionome of 30 day-old seedlings in a diversity set of 509 inbreds. They used an array of 6000 single nucleotide polymorphism (known as SNP), Bus et al. (2014) identified 29 significant loci for seven minerals concentration; Ca, Mg, S, Na, Cu, Mn and Zn, of which a locus associated with Cu, Mn and Zn concentration on the LG C3 was detected. Additionally, they identified a 540 kb locus with multiple associations related to Na concentration located on the LG A09 in the vicinity of the gene SOS1 which encode Na+/H+ antiporter that plays an important role in plant Na tolerance through regulating
Na acquisition and efflux (Fraile-Escanciano et al., 2010).