RESEARCH ARTICLE
Echo interval and not echo intensity drives bat flight behavior
in structured corridors
Michaela Warnecke*, Silvio Macıas, Benjamin Falk and Cynthia F. Mosś
ABSTRACT
To navigate in the natural environment, animals must adapt their locomotion in response to environmental stimuli. The echolocating bat relies on auditory processing of echo returns to represent its surroundings. Recent studies have shown that echo flow patterns influence bat navigation, but the acoustic basis for flight path selection remains unknown. To investigate this problem, we released bats in a flight corridor with walls constructed of adjacent individual wooden poles, which returned cascades of echoes to the flying bat. We manipulated the spacing and echo strength of the poles comprising each corridor side, and predicted that bats would adapt their flight paths to deviate toward the corridor side returning weaker echo cascades. Our results show that the bat’s trajectory through the corridor was not affected by the intensity of echo cascades. Instead, bats deviated toward the corridor wall with more sparsely spaced, highly reflective poles, suggesting that pole spacing, rather than echo intensity, influenced bat flight path selection. This result motivated investigation of the neural processing of echo cascades. We measured local evoked auditory responses in the bat inferior colliculus to echo playback recordings from corridor walls constructed of sparsely and densely spaced poles. We predicted that evoked neural responses would be discretely modulated by temporally distinct echoes recorded from the sparsely spaced pole corridor wall, but not by echoes from the more densely spaced corridor wall. The data confirm this prediction and suggest that the bat’s temporal resolution of echo cascades may drive its flight behavior in the corridor.
KEY WORDS: Echolocation, Acoustic flow,Eptesicus fuscus, Auditory-evoked activity, Inferior colliculus
INTRODUCTION
Navigation and orientation in the environment are fundamental to all organisms, which must adapt locomotion in response to dynamic sensory stimuli. For example, optic flow, the angular velocity of image motion across the retina (Gibson, 1979), provides continuous feedback to an animal about its relative velocity and distance to objects in its environment (Srinivasan et al., 1991, 1996). In several behavioral studies, visually guided animals, such as honeybees
(Baird et al., 2005; Srinivasan et al., 1991, 1996), Drosophila
(David, 1982) and budgerigars (Bhagavatula et al., 2011), have been shown to adapt their flight trajectory and speed in response to experimental manipulation of optic flow patterns (Baird et al., 2005,
2010; Bhagavatula et al., 2011; Dyhr and Higgins, 2010; Linander et al., 2015; Scholtyssek et al., 2014; Srinivasan et al., 1991, 1996). Some animals rely not on vision but on hearing to navigate through complex environments. Echolocating bats, for example, emit intense, high-frequency biosonar calls and exploit echo-acoustic information from objects in the environment to guide movements in the dark (Griffin, 1958; Neuweiler, 1990). Bats process binaural differences in arrival time and intensity to localize objects in the horizontal plane (Simmons et al., 1983), spectral cues to localize objects in the vertical plane (Lawrence and Simmons, 1982) and echo delay to estimate their distance to objects (Simmons, 1973).
Previous research has shown that echolocating bats navigate densely cluttered spaces with ease, adapting their flight and echolocation signal design to optimize information extracted from complex echo soundscapes (Falk et al., 2014, 2015; Hiryu et al., 2010; Petrites et al., 2009; Warnecke et al., 2016; Wheeler et al.,
2016). Most studies investigating the bat’s behavior in complex
environments have challenged the animal to maneuver around obstacles that reflect uncontrolled echo-acoustic variables, which are difficult to quantify across individual subjects and trials (e.g. Moss et al., 2014). Recently, we attempted to address this limitation
by studying the bat’s echolocation and flight behavior in an
experimentally controlled corridor, in which we systematically manipulated echo-acoustic information (Warnecke et al., 2016).
Specifically, we quantified the echolocating bat’s flight trajectory
and timing of biosonar signals in response to different echo flow patterns. Echo flow, cascades of echoes arriving at the ears of the
flying bat, varies with the animal’s call rate, head aim and distance
to objects in the environment. In our previous study (Warnecke et al., 2016), big brown bats flew through a corridor built from individually movable poles, while their flight trajectories and echolocation calls were recorded. The walls of the corridors were experimentally manipulated, with either dense or sparse spacing between poles (Fig. 1), which returned different patterns of echo flow to the bat. When bats flew through a corridor with walls built from symmetrically spaced poles that returned balanced echo flow patterns from opposite sides (Fig. 1A), they centered their flight trajectory within the corridor. An imbalance of echo flow patterns, created by manipulating the pole spacing on opposite corridor walls (Fig. 1B), caused bats to veer away from the side of densely spaced poles and toward the side of sparsely spaced poles (Warnecke et al., 2016). These findings prompted us to investigate whether bats adjust their flight paths in response to specific echo-acoustic cues, like the timing of echoes within cascades, or in order to steer away from the more echoic corridor side, the densely spaced side.
In the present study, we directly tested whether echo cascade
intensity guides the bat’s flight path selection. To do so, we wrapped
the poles of the densely spaced corridor side in either single or double layers of felt (see Fig. 1C), which attenuated the intensity of echo cascades on that side up to about 7 dB (see Fig. S1, Table S1).
Received 24 August 2018; Accepted 15 October 2018
Department of Psychological and Brain Sciences, Johns Hopkins University, Baltimore, MD 21218, USA.
*Author for correspondence ([email protected])
M.W., 0000-0001-5774-4578; C.F.M., 0000-0001-6916-0000
Journal
of
Experimental
If the big brown bat’s flight deviation is largely influenced by the intensity of echo cascades returning to the bat from either corridor side, then our felt manipulation of the densely spaced poles should
drive the bat’s flight path to the center of the corridor or even reverse
the flight path deviation towards the densely spaced side. If, however, the echo cascade intensity is not a major contributing
factor in the bat’s flight deviation within the corridor, we would
expect the bat to continue to deviate towards the sparsely spaced corridor wall (Warnecke et al., 2016).
Another factor that might influence bat flight trajectory selection is the spacing between individual poles and, by extension, the time interval between echoes within a cascade that returns from sparse or dense echo flow corridor sides. Importantly, the relative timing of the echoes within cascades would be largely unaffected by the felt
manipulation. To test the hypothesis that the bat’s flight deviation is
related to the timing of echoes within cascades as a result of differential neural processing of sparse and dense echo streams, we also recorded midbrain auditory-evoked responses to sparse and dense sound recordings made in the original echo flow corridor. Recent research has investigated single neuron responses in bat midbrain and cortical areas to playbacks of sonar broadcasts coupled with one to three echoes, which were presented at varying overall delays to simulate objects at decreasing distances (e.g. Bartenstein et al., 2014; Beetz et al., 2017; Greiter and Firzlaff, 2017). However, neural responses to streams of multiple echoes at short delay
separations within a cascade, such as those experienced by the bat in the present echo flow corridor, remain to be investigated. Further, previous work has shown that separate, reliable auditory-evoked responses in the bat inferior colliculus (IC) are elicited when the bat listens to two frequency-modulated (FM) stimuli at a delay of 2 ms or more (Sanderson and Simmons, 2000). As such, we hypothesized that local auditory-evoked activity in the big brown bat IC would show distinct responses to temporally discrete echoes arriving from individual poles at sparse spacing, where the delay between echoes from adjacent poles is around 2 ms. By contrast, we hypothesized that we would see no distinct responses to the nearly continuous echo streams arriving from closely spaced poles at dense spacing, where the delay between echoes of adjacent poles is less than 1 ms. We conjecture that the auditory system of the echolocating big brown bat represents the echoes returning from each pole on the sparsely spaced corridor side as separate events in time and space, which the animal can use for distance estimates and flight guidance. By contrast, we propose that the interval between echoes from the poles on the densely spaced corridor wall return at such short time separations that the bat auditory system cannot resolve them, and might represent them as a single, continuous echo that does not provide adequate information for flight guidance.
MATERIALS AND METHODS Animals
In the present study, six wild-caught big brown bats (four males,
two females),Eptesicus fuscus(Palisot de Beauvois 1796), served
as subjects in behavioral experiments, and an additional five wild-caught female big brown bats were subjects in the neural recording
experiments. The bats were fed with mealworms (Tenebrio molitor)
daily to maintain individual body mass between 13 and 16 g. All
animals were maintained on a reversed 12 h light–dark cycle in a
colony room kept at 24–28°C, with 40–50% relative humidity. Bats
in behavioral experiments were housed in one group cage. Animals used for neural recordings were kept in individual cages. The experimental procedures were approved by the Johns Hopkins University Institutional Animal Care and Use Committee.
Behavioral experiment setup
The experimental setup and paradigms are the same as previously described in Warnecke et al. (2016), but new conditions were added.
List of symbols and abbreviations
ED echo delay
FM frequency-modulated IEI inter-echo interval
LDfelt-RS left dense with felt-wrapped poles, right sparse
LD-RD left dense, right dense LD-RS left dense, right sparse LS-RD left sparse, right dense
LS-RD2×felt left sparse, right dense wrapped in two layers of felt
LS-RDfelt left sparse, right dense with felt-wrapped poles
LS-RS left sparse, right sparse PI pulse interval
S/D conditions creating an imbalance of echo flow patterns (LS-RD, LD-RS)
Dense
A
B
C
Dense Sparse Dense Sparse
LS-RD LS-RDfelt
Dense with felt
[image:2.612.70.543.530.691.2]LD-RD
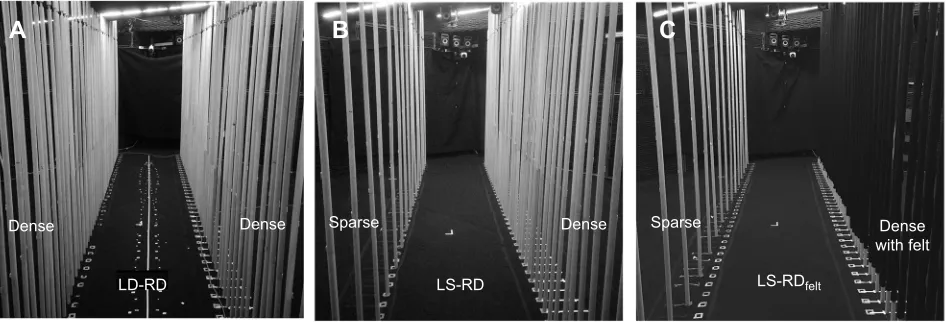
Fig. 1. Photographs of selected conditions for behavioral data collection.(A) Experimental setup of the left dense, right dense (LD-RD) condition. (B) Experimental setup of the left sparse, right dense (LS-RD) condition. (C) Experimental setup of the left sparse, right dense with felt-wrapped poles (LS-RDfelt)
condition, in which the densely spaced poles were wrapped in a single layer of sound-absorbing felt. Note that all photographs show only parts of the
corridor, which did not fit into the picture in its entire length.
Journal
of
Experimental
Briefly, in a large carpeted flight room (6×7×2.5 m), a 620 cm long and 120 cm wide corridor was built from individually movable wooden poles (2.5 cm diameter). The spacing between poles on the left and right corridor sides could be experimentally manipulated and several conditions with different pole spacing were tested in the experiment. Additionally, felt strips were wrapped around the wooden poles in some conditions to reduce their acoustic reflectivity (see photographs in Fig. 1). The entrance to the corridor was shielded by a black felt curtain with an elliptic release hole cut out (31×38 cm) to prevent the bat from gaining information about the different wall configurations until it began its flight through the corridor on each trial. We ran four baseline conditions with different pole spacing: left dense, right dense (LD-RD; Fig. 1A); left sparse, right sparse (LS-RS); left sparse, right dense (LS-RD; Fig. 1B); and left dense, right sparse (LD-RS). Additionally, we ran three experimental conditions in which we manipulated both the spacing and the reflectivity of
poles: left dense wrapped in felt, right sparse (LDfelt-RS); left sparse,
right dense wrapped in felt (LS-RDfelt; Fig. 1C); and left sparse, right
dense wrapped in two layers of felt (LS-RD2×felt). At 15 cm from the
densely spaced poles, a single layer of felt attenuated the echo intensity by about 3.5 dB; a double layer of felt attenuated the echo intensity by about 6.9 dB relative to bare poles (Fig. S1). Across conditions, dense spacing refers to a 12 cm gap between two poles, and sparse spacing refers to a 36 cm gap between two poles.
Prior to each experiment, an individual bat was removed from the cage and fitted with a custom-built head marker, attached using water-soluble glue (Grimas Mastix Water Soluble, Heemstede, Holland). The head marker was triangular, with three small (5 mm diameter) reflective spheres glued to each corner, and had a total
mass of less than 0.1 g; the marker was positioned between the bat’s
ears to track the animal’s position within the corridor (see below).
The experiment started when the marker was securely attached to
the bat’s head and all recording systems were ready to collect data.
Bats were released at ca. 150–100 cm distance from the corridor
entrance curtain, and they entered the corridor by flying through the curtain hole. On each test day, bats flew through the corridor over at least nine trials. After data collection, the head marker was carefully removed, and the animal was returned to its cage.
Owing to the time it took to prepare each corridor setup, a single condition was tested on one day, but the order of spacing on the left or right and the application of felt on the left or right side of the corridor poles was randomized. Each of the bats was tested in the same order and at approximately the same time of day. For each trial, three experimenters were present: one experimenter released the bat from behind the curtain and remained in that location. The second experimenter was responsible for catching the bat after a trial had ended and safely returning it to the curtain-enclosed space. The third experimenter recorded notes on every trial and triggered the audio and video recording systems (see below).
To restrict bats from using visual cues (Hope and Bhatnagar, 1979), all data collection was done in a dark room that was solely illuminated with dim infrared light for motion-tracking detection of the reflective markers on the bat. Measurements of the light levels in the flight room at the beginning, middle and end of the corridor each
revealed a light intensity of <10−2lx, which made visual detection
by the bats impossible. Measurements were done using a spectrophotometer (GS-1500, Gamma Scientific, San Diego, CA, USA) at experimental conditions.
Behavioral data recording
For each trial, synchronized audio and motion-tracking data of the
flying bat were collected. The bat’s echolocation calls were recorded
with seven ultrasonic microphones (D500X external microphone, Pettersson Elektronik Uppsala, Sweden) and band-passed between 10 and 100 kHz (USBPBP-S2, Alligator Technologies, Costa Mesa, CA, USA). Four microphones were mounted towards the end of the corridor, and three were mounted towards the beginning of the corridor. All audio data were sampled at 250 kHz (NI PXI board
6143). The bat’s flight trajectory was acquired through 13
high-speed IR motion-capture cameras (Nexus, Vicon Motion Systems Ltd, Yarnton, Oxford, UK), mounted on the ceiling within the corridor. The Vicon camera system was calibrated on each test day and showed millimeter precision in localizing the reflective markers. The motion-capture system tracked the reflective spheres
attached to each bat at 100 frames s−1. Each test day, the
motion-tracking program also recorded the position of the microphones, the location of the entrance hole, and the poles that made up the corridor walls. Every trial was manually triggered by an investigator after the bat had traversed the corridor at full length. Data acquired for the 4 s prior to the trigger were stored for off-line analysis.
Behavioral data processing and analysis
Data were processed off-line using custom-written MATLAB programs (Mathworks, Natick, MA, USA) to digitally analyze the audio recordings of echolocation behavior and 3D flight trajectories of the bat.
For the audio analysis, we detected calls, extracted call start and end times, and calculated the temporal characteristics. Across baseline and experimental trials, we collapsed the conditions that created an imbalance of echo flow patterns (LS-RD, LD-RS) into one condition (S/D), as the pole patterns were identical with regard to their effect on echolocation variables. Main analyses focused on the average call duration, pulse interval (PI) and call rate across conditions.
Flight paths were reconstructed as 3D trajectories of each bat’s
navigational patterns in a given condition. These data were used to
calculate the bat’s 3D deviation from the midline of the corridor.
Data points were calculated as the distance from the end of the corridor, which has been defined as the plane created by the last poles on the left and right sides. We excluded data at time points
when the bat first entered the corridor (0–0.5 m from the start of the
corridor) or may have been planning its exit (1.5 m from the end of corridor). Only data collected from the middle portion (a total of 4 m) of the corridor were analyzed. We also excluded trials that were classified as too short (3 m of flight or less), and collected at least nine trials per bat per condition. For analysis of flight patterns, we calculated the mean 3D deviation for each 10 cm bin within the 4 m length of the middle portion of the corridor. These data points are
plotted as a histogram distribution of deviation (x-axis) across
conditions (y-axis) in Fig. 2B for the baseline (black) and
experimental (color) conditions. We also calculated the mean flight deviation per trial for each bat (Fig. 2A, symbols) and each condition (Fig. 2A, mean±s.e.m.). A total of 190 trials contributed to the baseline conditions (LS-RS, LD-RD, LS-RD, LD-RS), and a total of 136 trials contributed to the experimental conditions
(LS-RDfelt, LS-RD2×felt, LDfelt-RS; see Fig. 2).
The focus of the statistical analyses for the flight deviation was on the imbalanced conditions (LD-RS, LS-RD), as the felt manipulation was applied during those testing conditions. Statistical tests were performed using JMP (SAS). To evaluate whether flight deviation differed between imbalanced baseline and experimental trials, we averaged deviation data across bats and condition, then used a repeated measures analysis with bat as a
random factor. To evaluate the change of echolocation parameters
Journal
of
Experimental
(call rate, call duration, PI) across appropriate variables of interest (baseline/experimental, condition, sonar sound group), we used a mixed model analysis in which we added bat as a random variable,
and appropriate variables as fixed factors. Ifpost hoctesting was
necessary, we used a Tukey’s HSD.
Two of the six bats were excluded from behavioral data analysis: one bat never flew further than halfway down the corridor and the other bat showed a persistent side bias toward the left in all conditions.
Acoustic stimuli in neurophysiological recordings
To investigate local evoked neural activity in response to echo cascades from the different corridor conditions, we took acoustic echo recordings in the behavioral echo flow corridor setup. These recordings then served as acoustic stimuli in neurophysiological
experiments. We refer to these stimuli as the ‘natural stimuli’.
Acoustic stimuli were recorded at seven different locations within different corridor configurations. Recordings were made in 15 cm intervals starting from the midline (at 0, 15, 30 and 45 cm from the midline toward the left and right sides of the corridor). At each location, a computer-generated 1.5 ms logarithmic FM sweep with
two harmonics (FM1: 55–20 kHz, FM2: 110–40 kHz) was
broadcast, and we then recorded the echoes returning from the corridor poles. The sonar broadcast duration was chosen to match the shortest duration produced by bats flying through the corridor (see Results). Echo recordings were made using a set of seven ultrasonic microphones (D500X external microphone, Pettersson Elektronik) that were arranged in a hexagon and mounted immediately below an emitting loudspeaker (flat frequency response; Pioneer PT-R9). Both loudspeaker and microphones were aimed straight towards the end of the corridor. Echoes were sampled at 250 kHz (NI PXI board 6143, National Instruments), and subsequently band-pass filtered between 10 and 100 kHz (USBPBP-S2, Alligator Technologies). For the acoustic stimuli used during neural recordings, we chose the echo cascades recorded at the microphone situated directly under the speaker at the 45 cm off-midline position (15 cm from the corridor wall), as this recording gave the clearest pattern of a strictly sparse or strictly dense corridor wall. Fig. 3A illustrates both the waveform (top) and spectrogram (bottom) of the natural stimuli, along with the envelope
of each stimulus (red). Also indicated are the echo delay (ED), which describes the delay from the beginning of the biosonar signal mimicking the broadcast to the beginning of the first returning echo, and the inter-echo interval (IEI), which describes the delay between the beginning of the echoes in the returning cascade (see indications on Fig. 3B, right). Both the ED and IEI were measured manually from the recordings. For the recordings chosen as natural stimuli, which were taken 15 cm from the corridor walls, the ED of the dense recording measured 0.92 ms, while the discernible IEIs ranged from 0.5 to 0.8 ms. By contrast, the echo delay of the sparse recording measured 2.14 ms, while the IEIs ranged from 1.8 to 2.14 ms.
We also created a set of stimuli that mimicked a broadcast and a cascade of echoes at regular delays (Fig. 3B). We refer to these
stimuli as the‘artificial stimuli’. The biosonar signal used in this
stimulus set was previously recorded from a bat resting on a platform and emitting calls to detect an object in an otherwise empty room. This signal was matched in duration to the mean call duration emitted by bats during the flight behavior experiment (see Results), and repeated at decreasing amplitudes for 50 ms, to match the duration of the sound file for natural stimuli. Fig. 3B illustrates both the waveform (top) and spectrogram (bottom) of these stimuli. Two stimuli were created: both had an ED of 2 ms, but their IEI was chosen to be either 3 ms (Fig. 3B, left) or 5 ms (Fig. 3B, right).
All acoustic stimuli (Fig. 3A,B) were each presented 20 times in random order, with a 300 ms interval between stimulus sets. To reduce data collection time, we changed this interval to 200 ms for all recording sessions after the data from the first bat were collected (see Table 1).
To estimate the attenuation created by wrapping the dense poles in single or double layers of felt, we analyzed the echo cascades recorded at the microphone situated directly under the speaker at different locations within the corridor (see Table S1). At 45 cm off-midline position towards the dense corridor wall, the mean
attenuation in the recording was 3.46 dB for LD-RS to LDfelt-RS,
6.94 dB for LD-RS to LD2×felt-RS and 3.48 dB for LDfelt-RS to
LD2×felt-RS. The average relative attenuation of a single layer of felt
was 3.47 dB (Fig. S1A). We chose this location within the corridor to estimate the effect of felt on the echo cascade without strong overlap from echoes of the other corridor wall. Calculations of
LD-RDLS-RS LD-RSLDfelt-RS LS-RDLS-RD felt
LS-RD
2xfelt
Condition –15
–10 –5 0 5 10 15
Deviation from midline (cm) LD-RD
Balanced
–40 –30 –20 –10 0 10 20 30 40
Deviation from midline (cm) LS-RS
N=43 Balanced
LS-RD
N=41
LS-RDfelt
LS-RD2xfelt
N=40
N=48
LD-RS
N=48 Imbalanced
LDfelt-RS
N=48
A
B
Imbalanced
[image:4.612.119.494.58.231.2]N=58
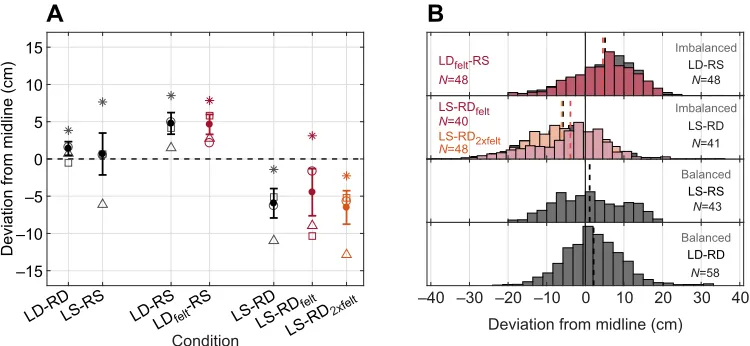
Fig. 2. Behavioral flight adaptations to different echo flow conditions.(A) Distribution of mean (filled symbols; ±s.e.m.) deviation from midline (y-axis) across baseline (black) and experimental (color) conditions (x-axis), and data for each individual bat (open symbols,N=4). LD-RD: left dense, right dense; LS-RS: left sparse, right sparse; LD-RS: left dense, right sparse; LDfelt-RS: left dense with felt-wrapped poles, right sparse; LS-RD: left sparse, right dense; LS-RDfelt: left
sparse, right dense with felt-wrapped poles; LS-RD2×felt: left sparse, right dense with poles covered in two layers of felt. (B) Histograms showing deviation (x-axis)
across baseline (black) and experimental (color) conditions (y-axis). The mean deviation for each dataset is also indicated (dashed lines), including the LS-RD2×feltexperimental condition (orange).Nindicates the number of trials per condition.
Journal
of
Experimental
attenuation were not absolute, but relative to each other, and were restricted to specific time points from 5 to 10 ms in the recording (Fig. S1A, gray shading, Table S1), because those time points contained echoes from the first meter beyond the speaker and microphone locations, where little overlap with echoes from the opposite corridor side (sparse) had occurred. Recordings from other locations (15 cm off midline towards the sparse corridor wall) or time points are reported in Table S1 and Fig. S1.
Electrophysiological data recordings
All bats in the neural recordings were naive to the stimulus and had not taken part in the behavioral data collection. All bats were first
anesthetized using 1–3% isofluorane gas. Under anesthesia, the skin
and muscles on top of the head were retracted without damaging the muscles controlling ear position. A head post was secured to the skull on the frontal midline using cyanoacrylate gel (Loctite 411, Henkel Corp., Dusseldorf, Germany). Animal care protocols were followed following the surgery, and at least 2 days passed before neurophysiological recordings began.
Extracellular recordings were taken in awake, restrained animals, inside a sound-proof and electrically shielded booth. Individually, bats were placed in a body mold made of plastic foam, and the head was tightly fixed by inserting the skull-attached head post into a metal holder. Every bat was used in multiple recording sessions, which never exceeded 3 h. No pharmacological agents were administered during recording sessions. Using skull and
brain-Natural stimuli
Waveform example: bat W15, depth: 1120µm, mean±s.d. of 20 presentations Waveform example: bat W15, depth: 1120µm, mean±s.d. of 20 presentations
Frequency (kHz) Frequency (kHz)
Entire data set Entire data set
Amplitude (mV)
Depth from surface (
µ
m)
T
ime between negative peaks (ms)
2
0
–2
100
0.1
–0.1 0
Amplitude (mV)
0.1
–0.1 0
310
1310
9
100
80
60
40
20
0 1 2 3 4 5 6
Time between negative peaks (ms) Time between negative peaks (ms)
7 8 9 1 2 3 4 5 6 7 8 9 1 2 3 4 5 6 7 8 9 1 2 3 4 5 6 7 8 9
160
140
400
150
100
50
0 300
200
100
0 120
100
80
60
40
20
0 8
7
6
5
4
3
2
1
T
ime between negative peaks (ms)
9
8
7
6
5
4
3
2
1 10 20 30
Time (ms)
Mode:1.5 Mode:2.375 Mode:3 Mode:5
40 10 20 30 40 10 20 30
Time (ms)
40 10 20 30 40
Depth from surface (
µ
m)
310
1310 75
50
25
2
0
–2
100
75 50
25
2 ms
2 ms 3 ms 5 ms
3 ms 5 ms
Signal
Enven lope
Signal
Enven lope
Signal
Enven lope
Signal
Enven lope
Sparse – ED: ~2 ms, IEI: ~2 ms ED: 2 ms, IEI: 3 ms ED: 2 ms, IEI: 5 ms
Dense – ED: <1 ms, IEI: <1 ms
A
B
C
D
E
F
G
H
Artificial stimuli
Amplitude (V)
Amplitude (V) ED IEI
0.6
0.4
0.2
0
−0.2
−0.4
−0.6
0.6
0.4
0.2
0
−0.2
−0.4
[image:5.612.54.560.64.521.2]−0.6
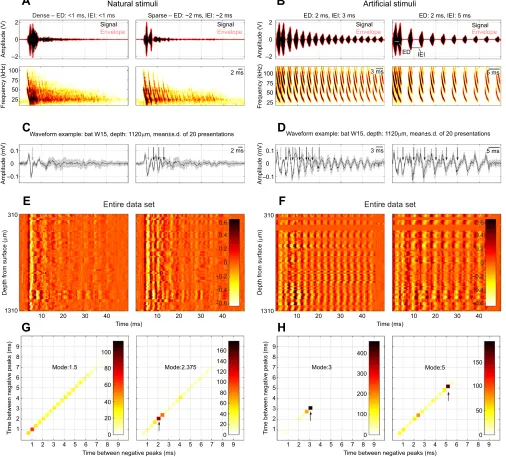
Fig. 3. Stimuli and results of neural data collection.(A) Waveform (top) with envelope (red) and spectrogram (bottom) plots of two natural stimuli recorded in the echo flow corridor (left, dense; right, sparse). (B) Waveform (top) with envelope (red) and spectrogram (bottom) plots of two artificial stimuli created to mimic echo flow at different inter-echo intervals (IEIs). Echo delays (EDs) and IEIs of each acoustic stimulus are indicated above the top panels. (C) Example waveform of a neural response recorded at a single depth for the two natural stimuli in A. (D) Same as C but for the artificial stimuli in B. (E,F) Heat plot illustrating evoked response patterns across animals and depths for the two natural stimuli in A (E) and for the two artificial stimuli in B (F). (G,H) Cloud plots of delay calculations between peaks of neural responses for the two natural stimuli in A (G) and the two artificial stimuli in B (H).
Journal
of
Experimental
surface landmarks, a small hole (∼1 mm diameter) was carefully made over the IC with a scalpel blade. Neural recordings were collected using silicon probes (Neuronexus, Ann Arbor, MI, USA;
1×16 arrangement; 50μm spacing between recording sites, 75μm
probe shank thickness), which permitted simultaneous data
collection from the IC at depths spanning 800μm. The probe was
lowered into the brain through the intact dura, orthogonal to the
brain surface. Electrode penetrations were reconstructed
histologically. Recording depths were measured using a hydraulic microdrive (Stoelting Co., Wood Dale, IL, USA) mounted on a micromanipulator. The brain surface was used as a reference point (0 µm) for depth measurement, and the recording depths extended to 1610 µm. Reliable patterns that were modulated by the stimulus were detected between 300 and 1310 µm (Table 1). A silver wire, placed
1–2 cm rostral from the recording probe and underneath the skin, was
used as the ground wire. Neuronal data acquisition was achieved using an OmniPlex D Neural Data Acquisition System recording system (Plexon Inc., Dallas, TX, USA), at a sampling rate of 40 kHz per channel and 16-bit precision. The acoustic stimuli presented to the bat were amplified (Krohn-Hite 7500, Krohn-Hite, Brockton, MA, USA) and broadcast at a D/A rate of 250 kHz (National Instruments card PXIe 6358), through a custom-built ultrasonic loudspeaker that
was mounted 60 cm from the bat’s ear, opposite the recording
hemisphere. We compensated for the speaker’s frequency response
through digital filtering and subsequently obtained a flat frequency response (±1 dB up to 110 kHz). The overall maximum output for each sound file was set at 70 dB SPL. Synchronization between the neural recordings and sound broadcasts was achieved with a TTL pulse output from the National Instrument card and recorded by one of the analog channels of the Plexon data acquisition system used for neural recording.
Electrophysiological data processing
Multi-unit recordings taken from the 16 channels of the silicon probe were processed to measure local evoked auditory activity to each of the acoustic stimuli. We focused our analysis on multi-unit data to investigate the timing of responses to echoes within cascades; single units typically showed sparse spiking activity in response to separate echoes within each cascade. Two of the five bats were excluded from neural data analysis because their neural recordings were noisy and no clear response to artificial or natural stimuli could be measured (see Table 1).
Neural data collected in channels that showed stimulus-evoked
responses were digitized (40 kHz per channel), filtered (200–
2000 Hz), and then averaged over 20 presentations for the entire 50 ms window of acoustic stimulus presentation (see Fig. 3C,D).
Filtered neural responses to both natural and artificial stimuli were recorded with a temporal resolution that was sufficient to detect responses evoked by echoes at all EDs and IEIs of the presented stimuli.
Fig. 3C,D plots examples of the neural traces for a single bat at a specific depth (see Results). After filtering, data from the bats across different recording sessions (Table 1) were combined and normalized separately for the artificial or natural stimulus sets.
The data were then plotted as a heat map of depth (y-axis) across
time (x-axis) in Fig. 3E,F for each acoustic stimulus condition. Note
that recordings were not taken at all depths for each of the three animals (see Table 1 for details).
To extract the delays between neural responses to individual echoes within cascades, an amplitude peak detection threshold was set at 0.05 mV from the averaged filtered neural data using MATLAB. This threshold was established by manually analyzing one-third of the data and determining that this threshold, taken from the negative phase of the averaged evoked waveform, yielded reliable detection of neural responses to both early (strong) and later (weak) echoes in the cascades (see Fig. 3). We then calculated the time between peaks, and plotted the resulting cluster of times against each other for each condition of artificial or natural stimulus (Fig. 3G,H).
RESULTS
In the present study, we investigated how different echo flow patterns influenced flight path selection, echolocation behavior and midbrain auditory-evoked responses in the big brown bat. Below, we first outline the results of the flight behavior analysis across baseline and experimental conditions (Fig. 2). Subsequently, we describe the results of local evoked auditory responses (Fig. 3). Finally, we lay out the analysis of the echolocation behavior (Fig. 4).
Flight trajectories
Fig. 2 illustrates the average flight deviation of all bats from the midline across baseline (black) and experimental trials (colored). Positive numbers indicate deviations to the right and negative numbers indicate deviations to the left side of the corridor. In baseline trials, bats centered their flight paths in balanced echo flow conditions (Fig. 2, black; mean±s.e.m. LD-RD: 1.3±0.89 cm, LS-RS: 0.66±2.8 cm), and changed their mean flight deviation toward the more sparsely spaced corridor wall in imbalanced echo flow
conditions (mean±s.e.m. LS-RD: −6.02±1.95 cm; LD-RS: 4.73±
1.46 cm). Wrapping poles with felt to attenuate echoes did not change the flight trajectories from baseline: in experimental trials, bats continued to deviate toward the sparsely spaced corridor walls
(Fig. 2, red; mean±s.e.m. LS-RDfelt: −4.46±3.16 cm; LDfelt-RS:
4.61±1.33 cm). Crucially, this behavior persisted even when the densely spaced side was wrapped in two layers of felt (Fig. 2,
orange; mean±s.e.m. LS-RD2×felt:−6.51±2.24 cm). This indicates
that the intensity of the returning echo cascade had no statistically
reliable influence on the bats’flight paths compared with baseline
trials. A repeated measures analysis between the imbalanced baseline and experimental data confirmed that the flight deviations were different when pole spacing was manipulated
across the two sides (LS-RD versus LD-RS;F1,6=13.44,P=0.01);
however, there was no significant change of the flight deviations in
response to the felt manipulation (F1,6=0.33,P=0.58). Fig. 2A plots
the average deviation (y-axis) per condition (x-axis; baseline: black,
[image:6.612.48.301.68.190.2]experimental: colored) for each bat (individual markers) and the mean±s.e.m. Fig. 2B plots histograms of the raw distributions of flight deviation across all bats and conditions.
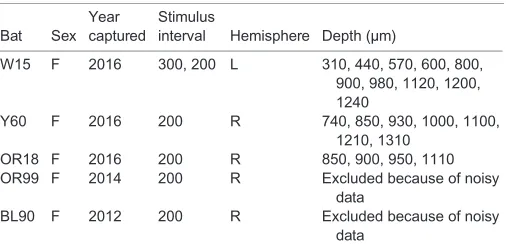
Table 1. Neural recording information
Bat Sex Year captured
Stimulus
interval Hemisphere Depth (µm)
W15 F 2016 300, 200 L 310, 440, 570, 600, 800, 900, 980, 1120, 1200, 1240
Y60 F 2016 200 R 740, 850, 930, 1000, 1100, 1210, 1310
OR18 F 2016 200 R 850, 900, 950, 1110
OR99 F 2014 200 R Excluded because of noisy data
BL90 F 2012 200 R Excluded because of noisy data
The table details the different depths that were recorded for each bat. Two bats (OR99 and BL90) were excluded from data analysis because the data were overall noisy and no response patterns could be detected.
Journal
of
Experimental
Neural responses
To investigate the bat auditory system’s response to echo cascade
patterns, we recorded local auditory-evoked potentials in the bat IC. Averaged local evoked auditory activity to the acoustic stimuli
(Fig. 3A,B) are shown in Fig. 3C–F. Fig. 3C,D plots the averaged
waveform acquired over 20 stimulus repetitions of an example response recorded in bat W15, at a depth of 1120 µm from the IC surface. In these examples, responses to the broadcasts are distinct (gray arrow), and further evident for the subsequent echoes (black arrows) of the sparse natural stimulus, as well as the artificial stimuli. Peaks in the local evoked activity occurred at the IEI for each stimulus, even when separated by only 2 ms. Fig. 3E,F presents heat plots for local evoked responses to natural (Fig. 3E) or artificial (Fig. 3F) stimuli, combining data from all bats across different
depths (y-axis; 310–1310 µm; see Table 1) for the 50 ms duration of
each acoustic stimulus (x-axis). The heat plots were normalized
across natural and artificial stimulus conditions, with darker colors indicating positive peaks and lighter colors indicating negative peaks. For both artificial stimuli (Fig. 3F, IEI: 3 and 5 ms), a striped pattern at the 3 and 5 ms intervals for each row (depth and channel) is shown, indicating that evoked responses across bats and recordings depths were modulated by the arrival time of mimicked echoes. Crucially, for the natural stimuli, the striped response pattern appears only for the echoes in the sparse stimulus, which has an IEI of about 2 ms (Fig. 3E, right), and is absent for the dense stimulus (Fig. 3E, left). The neural data are aligned to the stimulus onset and thus do not reveal latency responses for each echo cascade across depth.
To determine whether the positive and negative peaks of the neural activity followed the temporal pattern of IEI in each stimulus, Fig. 3G,H plots the results of time delay measurements between negative peak responses to artificial and natural stimuli. Note that the IEI of the dense stimulus was too short to elicit any reliable modulation of neural responses. The number of responses occurring at a specific delay is indicated by shade, with darker shades showing an increase in responses. If neural responses are tied to the interval between echoes in each of the stimuli, the IEI, we would expect there to be darker shading at time delays corresponding to the stimulus-specific IEI. Fig. 3H shows dark shading at around 3 and 5 ms (Fig. 3H, left and right, respectively, black arrows), corresponding to their respective IEI. Orange shading around
2–3 ms in Fig. 3H (right) illustrates the timing of evoked responses
to the interval between broadcast and the first echo, which are separated by the ED of 2 ms (see Fig. 3B, right; Fig. 3D, right, gray arrow). Fig. 3G (right) shows dark shading at 2 ms for the sparse
acoustic stimulus (ED: ∼2 ms, IEI:∼2 ms), while the shading is
spread comparatively evenly from 1 to 6 ms for the dense acoustic stimulus (Fig. 3G, left, ED: <1 ms, IEI: <1 ms).
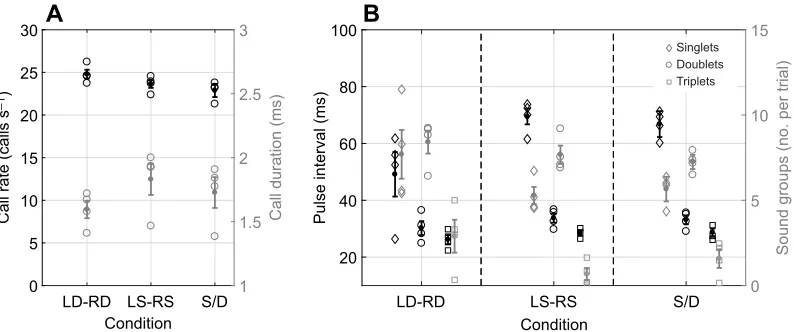
Echolocation behavior
Overall, there was no difference in call rate or call duration between baseline (bare poles) and experimental (felted poles) trials (call rate:
F1,17=0.07,P=0.79, call duration:F1,17=0,P=0.99). Bats emitted
around 24 calls s−1when flying through the corridor in baseline
trials, and around 22 calls s−1when flying in experimental trials, in
which dense poles were wrapped in felt, and there was no difference
of call rate across conditions (Fig. 4A, black;F2,17=2.51,P=0.11).
In all conditions, bats emitted very brief calls (∼1.7 ms overall), and
there was a significant difference in call duration across conditions
(Fig. 4A, gray;F2,17=6.02,P=0.01).Post hocanalyses revealed that
the shortest calls were observed in the most acoustically cluttered condition, LD-RD (mean±s.e.m. 1.59±0.07 ms), and the longest
calls were observed in LS-RS (mean±s.e.m. 1.82±0.12 ms; t=
−3.46,P=0.008). Call duration remained similar across imbalanced
corridors in both baseline and experimental trials.
In all corridor conditions, bats patterned their calls in packets of sonar sound groups, which fell into one of three categories according to previously established definitions (Kothari et al., 2014; Moss et al., 2006; Warnecke et al., 2016): grouping calls into sets of two (doublets) or three (triplets), or emitting calls that were not grouped (singlets). Overall, there was no difference between sonar sound group production in baseline or experimental trials
(F1,40=0.16,P=0.68), and so analyses for echolocation data focused
on the differences in sonar sound group patterns between different pole spacing conditions in the baseline data collection only (LD-RD, LS-RS, S/D). Across these conditions, bats emitted significantly fewer triplets than any other sound group (Fig. 4B,
gray; F3,27=21.3, P<0.0001), with about 11% of sound groups
falling into the triplet category. Most often, bats emitted calls that
were classified as a doublet sound group (∼50%), followed by
ungrouped calls (singlets, 39%). Across conditions, bats emitted calls at significantly different PIs, with generally shorter intervals in
LD-RD LS-RS S/D Condition 0
5 10 15 20 25 30
Call rate (calls s
–1
)
1 1.5 2 2.5 3
Call duration (ms)
LD-RD LS-RS S/D
Condition 20
40 60 80 100
Pulse interval (ms)
0 5 10 15
Sound groups (no. per trial)
Singlets Doublets Triplets
[image:7.612.110.507.58.224.2]A
B
Fig. 4. Results of different echolocation behaviors.(A) Mean (±s.e.m.) call rate (black, lefty-axis) and mean (±s.e.m.) call duration (gray, righty-axis) plotted for different conditions (x-axis). S/D refers to conditions creating an imbalance of echo flow patterns (LS-RD, LD-RS). (B) Mean (±s.e.m.) pulse interval (black, lefty-axis) and mean (±s.e.m.) number of sonar sound groups per trial (gray, righty-axis) plotted across different conditions for each sonar sound group (singlet, doublet, triplet).
Journal
of
Experimental
the acoustically most complex condition (Fig. 4B, black; LD-RD,
F2,27=8.6, P=0.0013). Moreover, across sonar sound groups, the
intervals differed significantly (F2,27=93, P<0.0001), and singlet
sound groups had the longest PI (mean±s.e.m. 60.7±2.56 ms), compared with the PI of doublets (mean±s.e.m. 31.9±2.56 ms;
doublet–singlet: t=−11.14, P<0.0001) and triplets (mean±s.e.m.
28±2.63 ms, triplet–singlet:t=12.32,P<0.0001).
DISCUSSION
As animals navigate through their natural environment, they exploit sensory cues to adapt their locomotion in response to objects they encounter along their flight trajectories. In a manner similar to
visually guided animals’use of optic flow cues to steer locomotion,
animals that rely largely on active hearing may use acoustic or echo flow cues to guide navigation (e.g. Kugler et al., 2016; Müller et al., 1999; Warnecke et al., 2016). For example, an echolocating bat that navigates through a densely cluttered forest or flies along a forest edge receives a cascade of echoes from trees at different distances for each sonar broadcast. Depending on the spacing between trees, the return of these echoes may arrive at short delay separations (for dense spacing of trees) or long delay separations (for sparse spacing of trees). The bat must thereby rapidly process and respond to echo cascades in complex environments and adjust its flight path to steer
around obstacles. Here, we demonstrate that the bat’s flight path
selection depends largely on the interval between echoes within a cascade, rather than on the overall intensity of echo cascades.
To date, few studies have investigated the effect of controlled echo cascades on bat sonar-guided navigation (e.g. Aharon et al., 2017; Petrites et al., 2009; Warnecke et al., 2016; Wheeler et al., 2016), and it is as yet unclear what sensory cues drive flight trajectory selection. While most of these studies focused their analyses on echolocation behavior and not flight patterns, Aharon
et al. (2017) tested whether bats flying in long (∼40 m) corridors,
built from evenly spaced plastic poles on opposite walls, use the delay separation of echoes from individual poles for distance
estimation. They trainedPipistrellus kuhliito find a platform inside
the corridor, and in test sessions determined where the bat searched for an absent platform when the density of poles was experimentally manipulated, i.e. increased or decreased relative to training. They found that experimental manipulation of the pole spacing did not
influence the bat’s estimation of the platform location. Based on
these findings, Aharon et al. (2017) proposed that bats used internal self-motion cues or path integration, rather than echo returns, to estimate flight distance. This research does not, however, provide insight into the acoustic sensory cues that guide flight trajectory selection in complex environments.
In the present study, we tested whether the intensity of echo cascades or time delay between separate echoes within an echo cascade influences bat flight path selection. To do so, we combined different spacing of poles comprising corridor walls with manipulations of echo intensity by wrapping poles with felt. The application of felt attenuated the echo cascade by up to 6.9 dB at a distance of 15 cm from the dense pole wall, relative to bare poles (Fig. S1, Table S1). To the best of our knowledge, no study has
directly measured intensity discrimination ofE. fuscus; however, it
has been demonstrated that a 1 dB change in echo intensity influences perception of target range (Bates et al., 2011; Simmons et al., 1990). Given that the double layer of felt attenuated the echo
cascade by as much as 6.9 dB, we believe thatE. fuscuswould be
sensitive to this reduction in echo strength. Overall, the bat flight data showed no difference in deviation from the midline of the corridor between baseline (no felt) and experimental (felt
application) trials (Fig. 2). These findings demonstrate that manipulating the intensity of the echo cascade did not significantly change the flight paths of echolocating bats. Flight deviation was, however, reliably modulated by the spacing of poles across echo flow corridor sides, suggesting that differences in the timing of echoes within echo cascades may drive bat flight path selection.
To investigate how the bat central nervous system processes echo cascades, we recorded local auditory-evoked activity from the big
brown bat’s IC, using stimuli representative of our echo flow
soundscape (see Materials and Methods). Previously, Sanderson and Simmons (2000) recorded auditory-evoked potentials in the IC of the anesthetized big brown bat, which was passively listening to sonar stimuli mimicking a broadcast and an echo. They gradually increased the time delay between the two sounds from 0 ms to 4 ms and showed that a discrete response to the later stimulus (mimicked echo) started to appear at inter-stimulus delays as small as 1.2 ms, although the evoked potential waveform did not return to full amplitude until the stimuli were separated by 2 ms. Given this result, we predicted that local auditory-evoked activity in the bat IC would show clear and distinct responses to individual echoes within cascades, when they were separated by intervals of 2 ms or longer, but that echoes at intervals shorter than 1.2 ms would not elicit discrete responses. The intervals between echoes from the sparsely spaced pole recordings ranged from 1.8 to around 2 ms (Fig. 3A, right), while the intervals between echoes from the densely spaced pole recordings were consistently <1 ms (Fig. 3A, left). As such, we expected the local auditory-evoked responses to the sparse pole echo recordings to show modulations for each echo, while we predicted such discrete modulations would be absent in responses to echoes from the dense pole recordings.
At every recording site in the IC, both the auditory response waveforms and heat maps of response strength across recording sites showed closely spaced positive and negative peaks at intervals that matched the IEI of the sparse echo flow stimulus (Fig. 3A,C, right). Further, the neural responses to the artificial stimuli also aligned with the IEI (Fig. 3B,D), confirming that the response patterns seen in Fig. 3C,D reflect the timing of echoes presented in each acoustic stimulus. The reliability of these modulations for each echo within a cascade is also illustrated in Fig. 3G,H, which shows that the time intervals between the peaks of the local evoked responses matches the IEI of the stimulus (black arrows). In contrast, the waveform and heat map responses to the dense echo flow stimulus (Fig. 3A,C, left) did not align with arrival times of echoes in that condition.
Both the example response waveforms in Fig. 3C,D and the heat maps in Fig. 3E,F illustrate that neural response amplitude decreased with decreasing stimulus amplitude. This is especially evident in the responses to echoes from the sparse pole corridor wall, where the decrease in stimulus amplitude was rapid. This observation suggests a relationship between stimulus strength and the amplitude of the local auditory-evoked potential. It would be of interest to follow up on this finding in future studies by experimentally manipulating echo amplitude of the natural cascades.
As the bat deviates in response to echo flow patterns, its distance and angle to the poles changes, which in turn influences the IEI within the echo cascade. When the bat deviated between 5 and 30 cm from the midline towards the sparse side (Fig. 2), echoes
within the cascade returned to it at an IEI of about 1.5–1.9 ms.
Sanderson and Simmons (2000) showed that auditory responses to closely spaced stimuli start to recover at an interval of about 1.2 ms
and are fully amplitude recovered at an interval of 2 ms. It is thus
Journal
of
Experimental
conceivable that the bat might represent echoes within the sparse cascade as separate objects. Further, when navigating imbalanced
corridor conditions and deviating 5–30 cm towards the sparse side,
the bat distances itself from the dense corridor side by
approximately 65–90 cm. At these distances, echoes from
separate poles of the dense corridor wall return to the bat at an IEI of about 0.25 ms, too close to elicit local auditory-evoked activity from each echo in the dense cascade (Sanderson and Simmons, 2000; Fig. 3A). We thus conjecture that each echo returning within the sparse echo cascade elicits separate neural onset responses (Fig. 3), which give the bat distance estimates for each of the sparsely spaced poles along its path, allowing the bat to guide its flight along these objects (see envelope in Fig. 3A, right). By contrast, the dense echo cascade elicits a single neural onset response (to the first echo of the cascade; see envelope in Fig. 3A,
left), which extends over a period of 35–40 ms. In this context, it is
worth noting that application of sound-attenuating felt to densely
spaced poles does not impact the IEI between echoes within dense cascades.
We hypothesize that midbrain responses in the echolocating bat to echo cascades returning from the sparsely spaced poles represent echoes from individual poles as discrete objects, while responses to echo cascades from the densely spaced poles represent a single
extended stimulus event that lasts over 35–40 m. When the corridor
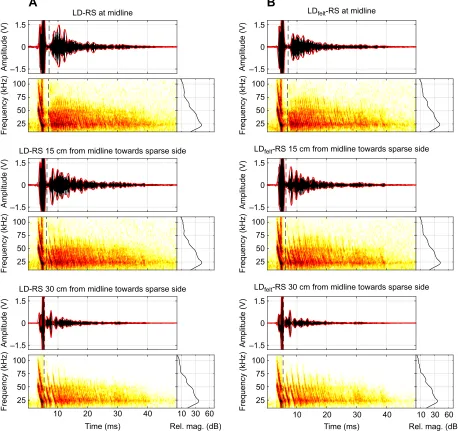
is constructed of sparsely spaced poles along one wall and densely spaced poles along the opposite wall, we hypothesize that in the center of the corridor, the bat may not be able to sufficiently resolve an acoustic pattern to guide its flight, because acoustic scattering from both corridor walls contributes to complex spectro-temporal echo patterns (Fig. 5A,B, top). However, deviation away from the densely spaced corridor wall and steering toward the side that returns cascades of echoes at resolvable IEIs (Fig. 5A,B, middle and bottom) increases the amplitude of echo cascades from that (sparse) side, decreases the amplitude of echo cascades from the dense
–1.5 0 1.5
Amplitude (V)
LD-RS at midline
25 50 75 100
Frequency (kHz)
–1.5 0 1.5
Amplitude (V)
LDfelt-RS at midline
25 50 75 100
Frequency (kHz)
–1.5 0 1.5
Amplitude (V)
LD-RS 15 cm from midline towards sparse side
25 50 75 100
Frequency (kHz)
–1.5 0 1.5
Amplitude (V)
LDfelt-RS 15 cm from midline towards sparse side
25 50 75 100
Frequency (kHz)
–1.5 0 1.5
Amplitude (V)
LD-RS 30 cm from midline towards sparse side
–1.5 0 1.5
Amplitude (V)
LDfelt-RS 30 cm from midline towards sparse side
10 20 30 40
Time (ms) 25
50 75 100
Frequency (kHz)
10 20 30 40
Time (ms) 25
50 75 100
Frequency (kHz)
10 30 60
Rel. mag. (dB)
10 30 60 Rel. mag. (dB)
[image:9.612.76.534.262.693.2]A
B
Fig. 5. Effect of deviation and felt on acoustic stimuli.(A) Acoustic recordings collected in the echo flow corridor in the baseline LD-RS condition at midline (top), 15 cm off midline towards the sparse corridor side (middle) and 30 cm off midline towards the sparse corridor side (bottom). Each plot shows the waveform (envelope: red) and spectrogram of the entire 50 ms recording, and the density spectrum of the echo cascade only (dashed line to end of recording). (B) same as A but for the experimental condition in which the dense poles were wrapped in felt.
Journal
of
Experimental
corridor side and thereby mitigates perceptual separation of sparse
echoes. Fig. 2B illustrates that bats deviate as much as 20–30 cm in
imbalanced conditions, potentially exacerbating the perceptual separation of echo cascades from the two corridor walls (Fig. 5A,B, bottom). Further, by distancing itself from the dense corridor side, the bat decreases the apparent inter-pole angle between dense poles relative to its position, which may further mitigate perceptual separation. Spectra of echo recordings from the corridor walls with dense and sparse pole spacing are remarkably similar, suggesting that the echo spectral profile may not significantly influence the behavioral and neurophysiological data reported here (Fig. 5). The acoustic basis for these findings raises questions for future research. In the flight corridor, the bat received binaural information from the two corridor walls, which was not fully captured in our free-field broadcasts of echo cascades in the neurophysiological experiments. As a first step, we recorded neural responses to monaural presentation of natural and artificial echo cascades from an ultrasound loudspeaker positioned contralateral to the neural recording site. A complete representation of binaural echo cascades remains to be explored, and provides fertile ground for future research.
Neurophysiological studies in several bat species have measured single unit responses to broadcasts of natural echolocation sequences, which contained echoes from one or more objects (Bartenstein et al., 2014; Beetz et al., 2016, 2017; Greiter and Firzlaff, 2017; Macias et al., 2018; Sanderson and Simmons, 2000). For example, researchers presented the anesthetized FM bat
Phyllostomus discolor with acoustic pulse–echo stimuli that
simulated the bat’s decreasing distance to one (Bartenstein et al.,
2014) or two (Greiter and Firzlaff, 2017) objects, and characterized single-unit responses in the auditory cortex. The results showed
changes in echo-delay (range) tuning with temporal–acoustic
alignment of pulse–echo pairs, but did not address whether single
echoes within larger echo cascades could be tracked.
Single-unit responses to echolocation sequences containing up to three echoes have been characterized in the IC and auditory cortex
of the anesthetized fruit bat Carollia perspicillata (Beetz et al.,
2016, 2017). In these studies, acoustic stimuli contained call–echo
segments of natural echolocation sequences that were recorded from a bat swinging on a pendulum, which passed by three objects. IEIs of these stimuli were always larger than 2 ms. The results show that cortical neurons responded primarily to echoes from the closest object. The suppression of responses to echoes at longer delays observed in cortical neurons was absent in the IC, and Beetz et al. (2017) suggested that parallel processing of multiple echoes at the level of the midbrain IC might drive cortical representation of the closer objects.
In the present study, we recorded multi-unit responses, instead of single-unit responses, to explore how populations of neurons in the bat brain process cascades of echoes. The neurophysiological data presented here extend previous work (e.g. Beetz et al., 2017) and suggest that many objects at very close spacing may be represented as the closest object or a single, extended object. Our work also provides the foundation to investigate neural representations of echo cascades in free-flying bats, to fully characterize responses to natural
echo flow patterns induced by an animal’s movement in the
environment (see Kothari et al., 2018).
Throughout both baseline and experimental conditions in our behavioral studies, bats mostly emitted short calls in doublet sound groups at an interval of 35 ms, which were flanked by longer,
∼60 ms intervals (Fig. 4B). This echolocation pattern was also
reported by Warnecke et al. (2016) and suggests a strategy for echo
processing. As illustrated in Fig. 3A, each broadcast is followed by
about 35–40 ms of echo cascades, and it is conceivable that the
short interval between groups of sounds is utilized by the bat specifically to hear the entire echo cascade, before emitting the subsequent call. In fact, call intervals were rarely shorter than
∼35 ms and those that were occurred at the end of the corridor where
the echo cascade was considerably shorter. Indeed, echo cascades could only have shortened in length, emphasizing that the bat should not experience any overlap between echo cascades in flight.
At a flight speed of about 3.5 m s−1and emitting calls in groups
of two at intervals of 30–35 ms, the bat travels approximately
10–12 cm between the onset of successive echo cascades. The
separation between poles at sparse spacing was 36 cm, while the separation between poles at dense spacing was 12 cm. Thus, when flying past poles at sparse spacing, the bat could receive successive echo cascades from the same set of adjacent poles when emitting doublet call groups. By contrast, when flying past poles at dense spacing, the bat would receive successive echo cascades from different sets of poles from calls within doublet sound groups as it passed adjacent poles.
Several engineering initiatives have made use of sensory-guided navigation to control autonomous vehicles (Baker et al., 2014; Conte and Doherty, 2008; Smith et al., 2013; Steckel and Peremans, 2017; Strydom et al., 2014) or create devices to help visually impaired individuals move safely within their environment (Filipe et al., 2012; Katzschmann et al., 2018; Lee and Medioni, 2011). While some of these systems use patterns of light, such as optic flow, to process information from the environment (Conte and Doherty, 2008; Strydom et al., 2014), recent work in sonar-based navigation has incorporated acoustic flow cues to automatically steer unmanned vehicles through complex corridors (Baker et al., 2014; Peremans and Steckel, 2014; Smith et al., 2014; Steckel and Peremans, 2017; Vanderelst et al., 2016). Most of the acoustic-based navigation devices have been tested in environments that contain large objects or flat surfaces, and it would be interesting to test the behavior of these systems in environments that create echo flow patterns similar to those presented here. Future experiments with new corridor configurations, which also manipulate the pattern of pole spacing, would add to our knowledge of sonar-guided path selection and trajectory planning. Building on these results would, in turn, inform the design of sonar-guided navigation systems for mobile vehicles that must operate in dark, GPS-denied environments.
Acknowledgements
We thank Grace Lee, Alexia Huggins, Sophia Murphy, Daniel Schwartzbaum, Traia Roper, Eyal Li and Sydney Donofrio for help during behavioral data collection and processing. We also thank Jinhong Luo for setting up the stimulation software, and Angeles Salles for help with neural data collection. We also thank John Hallam for assistance in conducting the echo recordings. The behavioral setup was built by James Garmon at the Johns Hopkins University Department of Psychological and Brain Sciences.
Competing interests
The authors declare no competing or financial interests.
Author contributions
Conceptualization: M.W., C.F.M.; Methodology: M.W., S.M., B.F., C.F.M.; Software: M.W., B.F.; Validation: M.W.; Formal analysis: M.W.; Investigation: M.W., S.M., B.F.; Resources: M.W., C.F.M.; Data curation: M.W.; Writing original draft: M.W.; Writing -review & editing: M.W., S.M., B.F., C.F.M.; Visualization: M.W.; Supervision: C.F.M.; Project administration: C.F.M.; Funding acquisition: M.W., C.F.M.
Funding
This research was supported by the ERP Graduate Fellowship of the Studienstiftung des Deutschen Volkes to M.W.; the National Science Foundation IOS1460149 and 1734744, the Human Frontier Science Program RGP0040; the Office of Naval
Journal
of
Experimental
Research N00014-12-1-0339; N00014-17-1-2736; and the Air Force Office of Scientific Research FA9550-14-1-0398.
Supplementary information
Supplementary information available online at
http://jeb.biologists.org/lookup/doi/10.1242/jeb.191155.supplemental
References
Aharon, G., Sadot, M. and Yovel, Y.(2017). Bats use path integration rather than
acoustic flow to assess flight distance along flyways.Curr. Biol.27, 3650-3657.e3.
Baird, E., Srinivasan, M. V., Zhang, S. and Cowling, A.(2005). Visual control of
flight speed in honeybees.J. Exp. Biol.208, 3895-3905.
Baird, E., Kornfeldt, T. and Dacke, M.(2010). Minimum viewing angle for visually
guided ground speed control in bumblebees.J. Exp. Biol.213, 1625-1632.
Baker, C. J., Smith, G. E., Balleri, A., Holderied, M. and Griffiths, H. D.(2014).
Biomimetic echolocation with application to radar and sonar sensing.Proc. IEEE 102, 447-458.
Bartenstein, S. K., Gerstenberg, N., Vanderelst, D., Peremans, H. and Firzlaff, U.(2014). Echo-acoustic flow dynamically modifies the cortical map of target range in bats.Nat. Commun.5, 4668.
Bates, M. E., Simmons, J. A. and Zorikov, T. V.(2011). Bats use echo harmonic
structure to distinguish their targets from background clutter. Science 333, 627-630.
Beetz, M. J., Hechavarrı́a, J. C. and Kössl, M.(2016). Cortical neurons of bats
respond best to echoes from nearest targets when listening to natural biosonar multi-echo streams.Sci. Rep.6, 35991.
Beetz, M. J., Kordes, S., Garcı́a-Rosales, F., Kössl, M. and Hechavarrı́a, J. C.
(2017). Processing of natural echolocation sequences in the inferior colliculus of Seba’s fruit eating bat, Carollia perspicillata.eNeuro4, ENEURO-0314.
Bhagavatula, P. S., Claudianos, C., Ibbotson, M. R. and Srinivasan, M. V.(2011).
Optic flow cues guide flight in birds.Curr. Biol.21, 1794-1799.
Conte, G. and Doherty, P.(2008). An integrated UAV navigation system based on
aerial image matching. In 2008 IEEE Aerospace Conference, Big Sky, Montana, pp. 1-10.
David, C. T.(1982). Compensation for height in the control of groundspeed by
Drosophila in a new,‘barber’s pole’wind tunnel.J. Comp. Physiol.147, 485-493.
Dyhr, J. P. and Higgins, C. M.(2010). The spatial frequency tuning of
optic-flow-dependent behaviors in the bumblebee Bombus impatiens.J. Exp. Biol.213, 1643-1650.
Falk, B., Jakobsen, L., Surlykke, A. and Moss, C. F.(2014). Bats coordinate sonar
and flight behavior as they forage in open and cluttered environments.J. Exp. Biol. 217, 4356-4364.
Falk, B., Kasnadi, J. and Moss, C. F.(2015). Tight coordination of aerial flight
maneuvers and sonar call production in insectivorous bats.J. Exp. Biol.218, 3678-3688.
Filipe, V., Fernandes, F., Fernandes, H., Sousa, A., Paredes, H. and Barroso, J. (2012). Blind navigation support system based on microsoft kinect.Procedia Comput. Sci.14, 94-101.
Gibson, J. J.(1979).The Ecological Approach To Visual Perception. Boston, MA:
Houghton Mifflin.
Greiter, W. and Firzlaff, U.(2017). Echo-acoustic flow shapes object representation
in spatially complex acoustic scenes.J. Neurophysiol.117, 2113-2124.
Griffin, D. R.(1958).Listening in the Dark: the Acoustic Orientation of Bats and Men.
Dover Publications Inc.
Hiryu, S., Bates, M. E., Simmons, J. A. and Riquimaroux, H.(2010). FM
echolocating bats shift frequencies to avoid broadcast-echo ambiguity in clutter. Proc. Natl. Acad. Sci. USA107, 7048-7053.
Hope, G. M. and Bhatnagar, K. P.(1979). Electrical response of bat retina to
spectral stimulation: comparison of four microchiropteran species.Experientia35, 1189-1191.
Katzschmann, R. K., Araki, B. and Rus, D.(2018). Safe local navigation for
visually impaired users with a time-of-flight and haptic feedback device.IEEE Trans. Neural Syst. Rehabil. Eng.26, 583-593.
Kothari, N. B., Wohlgemuth, M. J., Hulgard, K., Surlykke, A. and Moss, C. F. (2014). Timing matters: Sonar call groups facilitate target localization in bats. Front. Physiol.5, 1-13.
Kothari, N. B., Wohlgemuth, M. J. and Moss, C. F.(2018). Dynamic representation
of 3D auditory space in the midbrain of the free-flying echolocating bat.Elife7, e29053.
Kugler, K., Greiter, W., Luksch, H., Firzlaff, U. and Wiegrebe, L.(2016).
Echo-acoustic flow affects flight in bats.J. Exp. Biol.219, 1793-1797.
Lawrence, B. D. and Simmons, J. A.(1982). Echolocation in bats: the external ear
and perception of the vertical positions of targets.Science218, 481-483.
Lee, Y. H. and Medioni, G.(2011). RGB-D camera based navigation for the visually
impaired. In Proceedings of the RSS.
Linander, N., Baird, E. and Dacke, M.(2015). Bumblebee flight performance in
environments of different proximity.J. Comp. Physiol. A Neuroethol. Sensory Neural Behav. Physiol.202, 1-7.
Macias, S., Luo, J. and Moss, C. F.(2018). Natural echolocation sequences evoke
echo-delay selectivity in the auditory midbrain of the FM bat, Eptesicus fuscus. J. Neurophysiol.120, 1323-1339.
Moss, C. F., Bohn, K., Gilkenson, H. and Surlykke, A.(2006). Active listening for
spatial orientation in a complex auditory scene.PLoS Biol.4, 615-626.
Moss, C. F., Cechetto, C., Warnecke, M., Chiu, C., Xian, W. and Falk, B.(2014).
Echolocating bats face a cocktail party nightmare when they fly together in cluttered environments.J. Acoust. Soc. Am.135, 2150-2151.
Müller, R., Schnitzler, H.-U. and Mu, R.(1999). Acoustic flow perception in cf-bats:
properties of the available cues.J. Acoust. Soc. Am.105, 2958-2966.
Neuweiler, G.(1990). Auditory adaptations for prey capture in echolocating bats.
Physiol. Rev.70, 615-641.
Peremans, H. Steckel, J. (2014). Acoustic flow for robot motion control.
Proceedings of the IEEE International Conference on Robotics and Automation, pp. 316-321.
Petrites, A. E., Eng, O. S., Mowlds, D. S., Simmons, J. A. and Delong, C. M. (2009). Interpulse interval modulation by echolocating big brown bats (Eptesicus fuscus) in different densities of obstacle clutter.J. Comp. Physiol. A Neuroethol. Sensory Neural Behav. Physiol.195, 603-617.
Sanderson, M. I. and Simmons, J. A.(2000). Neural responses to overlapping FM
sounds in the inferior colliculus of echolocating bats. J. Neurophysiol. 83, 1840-1855.
Scholtyssek, C., Dacke, M., Kröger, R. and Baird, E.(2014). Control of self-motion
in dynamic fluids: fish do it differently from bees.Biol. Lett.10, 20140279.
Simmons, J. A.(1973). The resolution of target range by echolocating bats.
J. Acoust. Soc. Am.54, 157-173.
Simmons, J. A., Kick, S. A., Lawrence, B. D., Hale, C., Bard, C. and Escudié, B.
(1983). Acuity of horizontal angle discrimination by the echolocating bat, Eptesicus fuscus.J. Comp. Physiol. A153, 321-330.
Simmons, J. A., Ferragamo, M., Moss, C. F., Stevenson, S. B. and Altes, R. A. (1990). Discrimination of jittered sonar echoes by the echolocating bat, Eptesicus fuscus: the shape of target images in echolocation.J. Comp. Physiol. A167, 589-616.
Smith, G. E., Baker, C. J., Li, G. and Baker, (2013). Coupled Echoic Flow for Cognitive Radar Sensing. Proceedings of the 2013 IEEE Radar Conference, pp. 1-6.
Smith, G. E., Alsaif, S. and Baker, C. J.(2014). Echoic flow for cognitive radar
guidance. IEEE National Radar Conference Proceedings. pp. 490-495.
Srinivasan, M. V., Lehrer, M., Kirchner, W. H. and Zhang, S. W.(1991). Range
perception through apparent image speed in freely flying honeybees. Vis. Neurosci.6, 519-535.
Srinivasan, M., Zhang, S., Lehrer, M. and Collett, T.(1996). Honeybee navigation
en route to the goal: visual flight control and odometry.J. Exp. Biol.199, 237-244.
Steckel, J. and Peremans, H.(2017). Acoustic flow-based control of a mobile
platform using a 3D sonar sensor.IEEE Sens. J.17, 1.
Strydom, R., Thurrowgood, S. and Srinivasan, M. V.(2014). Visual odometry:
autonomous uav navigation using optic flow and stereo. In Proceedings of Australasian Conference on Robotics and Automation.
Vanderelst, D., Steckel, J., Boen, A., Peremans, H. and Holderied, M. W.(2016).
Place recognition using batlike sonar.Elife5, 1-23.
Warnecke, M., Lee, W.-J., Krishnan, A. and Moss, C. F.(2016). Dynamic echo
information guides flight in the big brown bat.Front. Behav. Neurosci.10, 1-11. Wheeler, A. R., Fulton, K. A., Gaudette, J. E., Simmons, R. A., Matsuo, I. and
Simmons, J. A.(2016). Echolocating big brown bats, eptesicus fuscus, modulate
pulse intervals to overcome range ambiguity in cluttered surroundings.Front. Behav. Neurosci.10, 125.