Comparison of HapMap and 1000 Genomes
Reference Panels in a Large-Scale
Genome-Wide Association Study
Paul S. de Vries1,2, Maria Sabater-Lleal3, Daniel I. Chasman4,5, Stella Trompet6,7,
Tarunveer S. Ahluwalia8,9, Alexander Teumer10, Marcus E. Kleber11, Ming-Huei Chen12,13, Jie Jin Wang14, John R. Attia15,16, Riccardo E. Marioni17,18,19, Maristella Steri20,
Lu-Chen Weng21, Rene Pool22,23, Vera Grossmann24, Jennifer A. Brody25,
Cristina Venturini26,27, Toshiko Tanaka28, Lynda M. Rose4, Christopher Oldmeadow15,16, Johanna Mazur29, Saonli Basu30, Mattias Frånberg3,31, Qiong Yang13,32, Symen Ligthart1, Jouke J. Hottenga22, Ann Rumley33, Antonella Mulas20, Anton J. M. de Craen7,
Anne Grotevendt34, Kent D. Taylor35,36, Graciela E. Delgado11, Annette Kifley14, Lorna M. Lopez17,37,38, Tina L. Berentzen39, Massimo Mangino27,40, Stefania Bandinelli41, Alanna C. Morrison1, Anders Hamsten3, Geoffrey Tofler42, Moniek P. M. de Maat43, Harmen H. M. Draisma22,44, Gordon D. Lowe45, Magdalena Zoledziewska20, Naveed Sattar46, Karl J. Lackner47, Uwe Vo¨ lker48
, Barbara McKnight49, Jie Huang50, Elizabeth G. Holliday51, Mark A. McEvoy16, John M. Starr17,52, Pirro G. Hysi27, Dena G. Hernandez53,
Weihua Guan30, Fernando Rivadeneira1,54, Wendy L. McArdle55, P. Eline Slagboom56, Tanja Zeller57,58, Bruce M. Psaty59,60, Andre´ G. Uitterlinden1,54, Eco J. C. de Geus22,23, David J. Stott61, Harald Binder62, Albert Hofman1,63, Oscar H. Franco1, Jerome I. Rotter64,65, Luigi Ferrucci28, Tim D. Spector27, Ian J. Deary17,66, Winfried Ma¨rz11,67,68, Andreas Greinacher69, Philipp S. Wild70,71,72, Francesco Cucca20, Dorret I. Boomsma22, Hugh Watkins73, Weihong Tang21, Paul M. Ridker4,5, Jan W. Jukema6,74,75, Rodney J. Scott76,77, Paul Mitchell14, Torben Hansen78, Christopher J. O’Donnell13,79, Nicholas L. Smith60,80,81, David P. Strachan82, Abbas Dehghan1,83*
1 Department of Epidemiology, Erasmus MC, Rotterdam, the Netherlands, 2 University of Texas Health Science Center at Houston, Houston, TX, United States of America, 3 Cardiovascular Medicine Unit,
Department of Medicine, Karolinska Institutet, Stockholm, Sweden, 4 Division of Preventive Medicine, Brigham and Women’s Hospital, Boston, MA, United States of America, 5 Harvard Medical School, Boston, MA, United States of America, 6 Department of Cardiology, Leiden University Medical Center, Leiden, the Netherlands, 7 Department of Gerontology and Geriatrics, Leiden University Medical Center, Leiden, the Netherlands, 8 Steno Diabetes Center Copenhagen, Gentofte, Denmark, 9 Novo Nordisk Foundation Center For Basic Metabolic Research, Section of Metabolic Genetics, Faculty of Health and Medical Sciences, University of Copenhagen, Copenhagen, Denmark, 10 Institute for Community Medicine, University Medicine Greifswald, Greifswald, Germany, 11 Vth Department of Medicine, Medical Faculty Mannheim, Heidelberg University, Mannheim, Germany, 12 Department of Neurology, Boston University School of Medicine, Boston, MA, United States of America, 13 Framingham Heart Study, Population Sciences Branch, Division of Intramural Research National Heart Lung and Blood Institute, National Institutes of Health, Framingham, MA, United States of America, 14 Centre for Vision Research, Department of Ophthalmology, and Westmead Institute for Medical Research, University of Sydney, Sydney, Australia, 15 Public Health Stream, Hunter Medical Research Institute, University of Newcastle, Newcastle, Australia, 16 School of Medicine and Public Health, University of Newcastle, Newcastle, Australia, 17 Centre for Cognitive Ageing and Cognitive Epidemiology, University of Edinburgh, Edinburgh, United Kingdom, 18 Centre for Genomic and Experimental Medicine, University of Edinburgh, Edinburgh, United Kingdom, 19 Queensland Brain Institute, University of Queensland, Brisbane, Australia, 20 Istituto di Ricerca Genetica e Biomedica, Consiglio Nazionale delle Ricerche, Monserrato, Cagliari, Italy, 21 Division of Epidemiology and Community Health, University of Minnesota, Minneapolis, MN, United States of America, 22 Department of Biological Psychology, Netherlands Twin Register, VU University, Amsterdam, the Netherlands, 23 EMGO+ institute, VU University & VU medical center, Amsterdam, the Netherlands, 24 Center for Thrombosis and Hemostasis (CTH), University Medical Center of the Johannes Gutenberg University Mainz, Mainz, Germany, 25 Department of Medicine, University of Washington, Seattle WA, United States of America, 26 Division of Infection and Immunology, UCL, London, United Kingdom, 27 Department of Twin Research and Genetic Epidemiology, Kings College London, London, United Kingdom, 28 Translational Gerontology Branch, National Institute on Aging, Baltimore, MD, United States of America, a1111111111 a1111111111 a1111111111 a1111111111 a1111111111 OPEN ACCESS
Citation: de Vries PS, Sabater-Lleal M, Chasman
DI, Trompet S, Ahluwalia TS, Teumer A, et al. (2017) Comparison of HapMap and 1000 Genomes Reference Panels in a Large-Scale Genome-Wide Association Study. PLoS ONE 12 (1): e0167742. doi:10.1371/journal.pone.0167742
Editor: Yong-Gang Yao, Kunming Institute of
Zoology, Chinese Academy of Sciences, CHINA
Received: July 4, 2016 Accepted: November 19, 2016 Published: January 20, 2017
Copyright: This is an open access article, free of all
copyright, and may be freely reproduced, distributed, transmitted, modified, built upon, or otherwise used by anyone for any lawful purpose. The work is made available under theCreative Commons CC0public domain dedication.
Data Availability Statement: Many of the
participating studies are restricted in their ability to deposit individual-level data due to restrictions from their respective ethical committees, national laws, and/or informed consent. Specific information on the restrictions and how to request access to these data can be found in the Supporting Information files.
Funding: Steno Diabetes Center and Synlab
29 Institute of Medical Biostatistics, Epidemiology and Informatics, University Medical Center of the
Johannes Gutenberg University Mainz, Mainz, Germany, 30 Division of Biostatistics, University of Minnesota, Minneapolis, MN, United States of America, 31 Department of Numerical Analysis and Computer Science, Stockholm University, Stockholm, Sweden, 32 Department of Biostatistics, Boston University School of Public Health, Boston, MA, United States of America, 33 Institute of Cardiovascular and Medical Sciences, University of Glasgow, Glasgow, United Kingdom, 34 Institute of Clinical Chemistry and Laboratory Medicine, University Medicine Greifswald, Greifswald, Germany, 35 Institute for Translational Genomics and Population Sciences, Los Angeles Biomedical Research Institute at Harbor/UCLA Medical Center, Torrance, CA, United States of America, 36 Division of Genomic Outcomes, Department of Pediatrics, Harbor-UCLA Medical Center, Torrance, CA, United States of America, 37 Royal College of Surgeons in Ireland, Department of Psychiatry, Education and Research Centre, Beaumont Hospital, Dublin, Ireland, 38 University College Dublin, UCD Conway Institute, Centre for Proteome Research, UCD, Belfield, Dublin, Ireland, 39 Institute of Preventive Medicine, Bispebjerg and Frederiksberg Hospital, The Capital Region, Copenhagen, Denmark, 40 NIHR Biomedical Research Centre at Guy’s and St. Thomas’ Foundation Trust, London, United Kingdom, 41 Geriatric Unit, Azienda Sanitaria Firenze (ASF), Florence, Italy, 42 Royal North Shore Hospital, Sydney University, Sydney, Australia, 43 Department of Hematology, Erasmus MC, Rotterdam, the Netherlands, 44 Neuroscience Campus Amsterdam, Amsterdam, the Netherlands, 45 Institute of Cardiovascular and Medical Sciences, University of Glasgow, Glasgow, United Kingdom, 46 BHF Glasgow Cardiovascular Research Centre, Faculty of Medicine, Glasgow, United Kingdom, 47 Institute of Clinical Chemistry and Laboratory Medicine, University Medical Center, Johannes Gutenberg University Mainz, Mainz, Germany, 48 Interfaculty Institute for Genetics and Functional Genomics, University Medicine Greifswald, Greifswald, Germany, 49 Department of Biostatistics, University of Washington, Seattle, WA, United States of America, 50 Department of Human Genetics, Wellcome Trust Sanger Institute, Hinxton, Cambridge, United Kingdom, 51 Public Health Stream, Hunter Medical Research Institute, and School of Medicine and Public Health, University of Newcastle, Newcastle, Australia, 52 Alzheimer Scotland Dementia Research Centre, University of Edinburgh, Edinburgh, United Kingdom, 53 Laboratory of Neurogenetics, National Institute on Aging, Bethesda, MD, United States of America, 54 Department of Internal Medicine, Erasmus MC, Rotterdam, the Netherlands, 55 School of Social and Community Medicine, University of Bristol, Bristol, United Kingdom, 56 Department of Molecular Epidemiology, Leiden University Medical Center, Leiden, the Netherlands, 57 Department of General and Interventional Cardiology, University Heart Centre, University Medical Center Hamburg-Eppendorf, Hamburg, Germany, 58 German Center for Cardiovascular Research (DZHK), Partner Site Hamburg, Lu¨beck, Kiel, Hamburg, Germany, 59 Department of Medicine, Epidemiology, and Health Services, University of Washington, Seattle WA, United States of America, 60 Group Health Research Institute, Group Health Cooperative, Seattle WA, United States of America, 61 Institute of Cardiovascular and Medical Sciences, Faculty of Medicine, University of Glasgow, Glasgow, United Kingdom, 62 Institute of Medical Biostatistics, Epidemiology and Informatics, University Medical Center of the Johannes Gutenberg University Mainz, Mainz, Germany, 63 Department of Epidemiology, Harvard T.H. Chan School of Public Health, Boston, MS, United States of America, 64 Los Angeles BioMedical Research Institute at Harbor-UCLA Medical Center, Institute for Translational Genomics and Population Sciences, Torrance, CA, United States of America, 65 Division of Genomic Outcomes, Departments of Pediatrics & Medicine, Harbor-UCLA Medical Center, Torrance, CA, United States of America, 66 Department of Psychology, University of Edinburgh, Edinburgh, United Kingdom, 67 Synlab Academy, Synlab Holding Deutschland GmbH, Mannheim, Germany, 68 Clinical Institute of Medical and Chemical Laboratory Diagnostics, Medical University of Graz, Graz, Austria, 69 Institute for Immunology and Transfusion Medicine, University Medicine Greifswald, Greifswald, Germany, 70 Preventive Cardiology and Preventive Medicine, Center for Cardiology, University Medical Center of the Johannes Gutenberg-University Mainz, Mainz, Germany, 71 Center for Thrombosis and Hemostasis (CTH), University Medical Center of the Johannes Gutenberg-University Mainz, Mainz, Germany, 72 German Center for Cardiovascular Research (DZHK), Partner Site RhineMain, Mainz, Germany, 73 Cardiovascular Medicine Dept/Radcliffe Dept of Medicine, Wellcome Trust Centre for Human Genetics, University of Oxford, Oxford, United Kingdom, 74 Durrer Center for Cardiogenetic Research, Amsterdam, the Netherlands, 75 Interuniversity Cardiology Institute of the Netherlands, Utrecht, the Netherlands, 76 Information based Medicine Program, Hunter Medical Research Institute, University of Newcastle, Newcastle, Australia, 77 School of Biomedical Sciences and Pharmacy, University of Newcastle, Newcastle, Australia, 78 Novo Nordisk Foundation Centre for Basic Metabolic Research, Section of Metabolic Genetics, Faculty of Health and Medical Sciences, University of Copenhagen, Copenhagen, Denmark, 79 Cardiology Division, Massachusetts General Hospital, Boston, MA, United States of America, 80 Department of Epidemiology, University of Washington, Seattle WA, United States of America, 81 Seattle Epidemiologic Research and Information Center, Department of Veteran Affairs Office of Research and Development, Seattle, WA, United States of America, 82 Population Health Research Institute, St George’s, University of London, London, United Kingdom, 83 Department of Epidemiology and Biostatistics, Imperial College London, London, United Kingdom
respectively, but did not have any additional role in the study design, data collection and analysis, decision to publish, or preparation of the manuscript. The specific roles of these authors are articulated in the ‘author contributions’ section. Infrastructure for the CHARGE Consortium is supported in part by the National Heart, Lung, and Blood Institute grant R01HL105756. ARIC is carried out as a collaborative study supported by National Heart, Lung, and Blood Institute (NHLBI) contracts HHSN268201100005C,
HHSN268201100006C, HHSN268201100007C, HHSN268201100008C, HHSN268201100009C, HHSN268201100010C, HHSN268201100011C, and HHSN268201100012C, R01HL087641, R01HL59367 and R01HL086694; National Human Genome Research Institute contract
Abstract
An increasing number of genome-wide association (GWA) studies are now using the higher resolution 1000 Genomes Project reference panel (1000G) for imputation, with the expecta-tion that 1000G imputaexpecta-tion will lead to the discovery of addiexpecta-tional associated loci when com-pared to HapMap imputation. In order to assess the improvement of 1000G over HapMap imputation in identifying associated loci, we compared the results of GWA studies of circulat-ing fibrinogen based on the two reference panels. Uscirculat-ing both HapMap and 1000G imputa-tion we performed a meta-analysis of 22 studies comprising the same 91,953 individuals. We identified six additional signals using 1000G imputation, while 29 loci were associated using both HapMap and 1000G imputation. One locus identified using HapMap imputation was not significant using 1000G imputation. The genome-wide significance threshold of 5×10⁻⁸is based on the number of independent statistical tests using HapMap imputation, and 1000G imputation may lead to further independent tests that should be corrected for. When using a stricter Bonferroni correction for the 1000G GWA study (P-value<2.5×10⁻⁸), the number of loci significant only using HapMap imputation increased to 4 while the number of loci significant only using 1000G decreased to 5. In conclusion, 1000G imputation
enabled the identification of 20% more loci than HapMap imputation, although the advan-tage of 1000G imputation became less clear when a stricter Bonferroni correction was used. More generally, our results provide insights that are applicable to the implementation of other dense reference panels that are under development.
Introduction
Most genome-wide association (GWA) studies to date have used their genotyped single nucle-otide polymorphisms (SNPs) to impute about 2.5 million SNPs detected in the Phase 2 version of the HapMap Project (HapMap) [1–13], including mostly common SNPs with a minor allele frequency (MAF) of over 5%. HapMap imputation enabled the interrogation of most common SNPs possible, even while meta-analyzing studies that used different genotyping arrays with low overlap [1]. However, low-frequency and rare variants are not well covered in the HapMap panel [14]. In addition, genetic variants other than SNPs, such as small insertion/deletions (indels) and large structural variants, are not included in HapMap-based imputed projects, and may be possible sources of missing explained heritability.
In contrast, the more recently released Phase 1 version 3 of the 1000 Genomes Project (1000G) is based on a larger set of individuals [15], and comprises nearly 40 million variants, including 1.4 million indels. 1000G allows the interrogation of most common and low-fre-quency variants (MAF>1%), and rare variants (MAF<1%) that were previously not covered [16]. In general, improving reference panels can lead to the identification of additional signifi-cant loci both through the addition of new variants and the improved imputation of known variants. 1000G imputation may thus have several advantages, but given that the denser 1000G imputation comes at the cost of an increased computational and analytical burden, it is impor-tant to estimate the observed benefits in practice. Furthermore, such empirical data is needed to make informed decisions in the future on the use of newer reference panels such as UK10K, and the Haplotype Reference Consortium [17,18]. While several GWA studies using 1000G imputation have been published or are in progress, their sample size differs from the previous
Excellence in Translational Clinical Research in Eye Diseases, CCRE in TCR-Eye, grant ID 529923); In addition, funding by the Wellcome Trust, UK (to A Viswanathan, P McGuffin, P Mitchell, F Topouzis, P Foster) has supported the genotyping costs of the entire BMES population. This CHS research was supported by NHLBI contracts
GWA studies using HapMap imputation, making comparison difficult. Therefore, with the aim of evaluating the benefits of using 1000G imputation in GWA studies compared to Hap-Map imputation, we carried out meta-analyses of GWA studies of circulating fibrinogen con-centration (a quantitative trait), using both HapMap and 1000G imputed data on the same set of 91,953 individuals.
Results
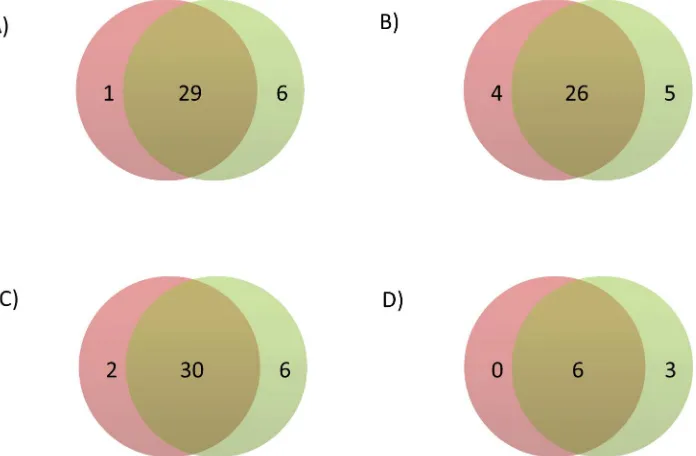
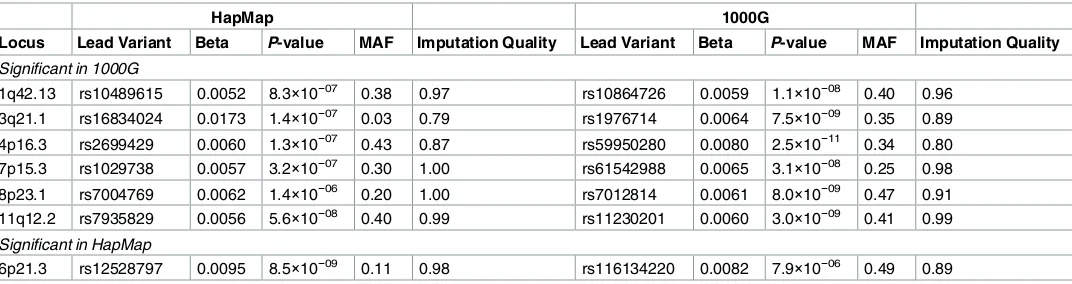
Baseline characteristics of the participants for each of the included studies are shown inS1 Table, and genomic inflation factors are shown separately for the HapMap and 1000G GWA studies inS2 Table. The HapMap GWA study included 2,749,429 SNPs, and the 1000G GWA study included 10,883,314 variants. Summary statistics for all variants in the HapMap and 1000G GWA studies are available via the dbGAP CHARGE Summary Results site [19]. Using a genome-wide significance threshold of 5×10⁻⁸, a total of 1,210 SNPs across 30 loci were associated with circulat-ing fibrinogen concentration in the HapMap imputed GWA study compared with 4,096 variants across 35 loci in the 1000G imputed GWA study (S1 FigandS2 Fig). These loci are described in further detail inS3 Table. Of these loci, six were associated only in the 1000G GWA study and one was associated only in the HapMap GWA study, while 29 were overlapping (Fig 1A). The HapMap and 1000G lead variants of non-overlapping loci are described inTable 1, and leads var-iants of overlapping loci are described inTable 2. Among significant loci, the correlation coeffi-cient across cohorts of the beta coefficoeffi-cients,P-values, and imputation quality scores of HapMap and 1000G lead variants were 0.925, 0.998, and 0.435 respectively (S3 Fig).
Non-overlapping loci
[image:4.612.206.554.425.653.2]The lead variants for the seven non-overlapping loci always differed between the HapMap and 1000G GWA studies, and allP-value differences were greater than one order of magnitude
Fig 1. Venn diagram of the number of loci significant using HapMap (left circle) and 1000G (right circle) imputation in A) the main analysis, B) the sensitivity analysis applying a significance threshold of 2.5×10⁻⁸to the 1000G GWA analysis, C) the sensitivity analysis without using genomic control corrections, and D) the sensitivity analysis excluding studies that used different imputation software, analysis software, or covariates in the HapMap and 1000G GWA analyses.
doi:10.1371/journal.pone.0167742.g001 PHILIPS Medical Systems, including an
unrestricted grant for the Gutenberg Health Study. VG, PSW are funded by the Federal Ministry of Education and Research (BMBF 01EO1003). The InCHIANTI study baseline (1998-2000) was supported as a "targeted project" (ICS110.1/ RF97.71) by the Italian Ministry of Health and in part by the U.S. National Institute on Aging (Contracts: 263 MD 9164 and 263 MD 821336); This research was supported in part by the Intramural Research Program of the NIH, National Institute on Aging. The whole genome association study in LBC1936 and LBC1921 was funded by the Biotechnology and Biological Sciences Research Council (BBSRC; Ref. BB/F019394/1). The LBC1936 research was supported by Age UK. The LBC1921 data collection was funded by the BBSRC. The work was undertaken by The University of Edinburgh Centre for Cognitive Ageing and Cognitive Epidemiology (MR/K026992/ 1), part of the cross council Lifelong Health and Wellbeing Initiative. Funding from the BBSRC, and MRC is gratefully acknowledged. LURIC has received funding from the 6th Framework Program (integrated project Bloodomics, grant LSHM-CT-2004-503485) and from the 7th Framework Program (Atheroremo, grant agreement number 201668 and RiskyCAD, grant agreement number 305739) of the European Union as well as from the INTERREG IV Oberrhein Program (Project A28, Genetic mechanisms of cardiovascular diseases) with support from the European Regional Development Fund (ERDF) and the
(for example: from 5×10⁻⁸to 5×10⁻⁹or less). Differences between HapMap and 1000G impu-tation for the seven non-overlapping loci are summarized inFig 2.
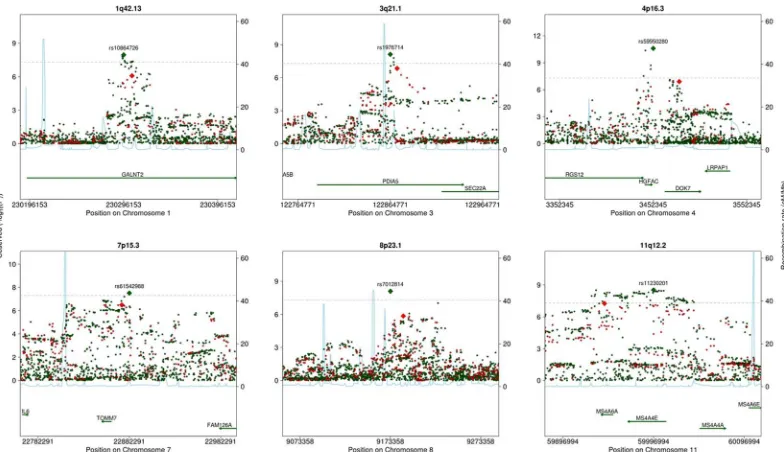
Regional plots of the six loci significant only in the 1000G GWA study are shown inFig 3. For four of these six loci, the correlation r2between allelic dosages of the most associated vari-ants imputed using HapMap and 1000G was less than 0.8 (S4 Table). None of the 1000G lead variants among these four loci were included in the HapMap GWA study, and neither were any good proxies (S5 Table).
A regional plot of the 6p21.3 locus, which was significant only in the HapMap GWA study, is shown inFig 4. The most significantP-value at the locus was 8.5×10⁻⁹in the HapMap GWA study compared to 7.9×10⁻⁶in the 1000G GWA study. The correlation r2between imputed dosages of the HapMap and 1000G lead variants was low (0.07). The HapMap lead SNP was included in the 1000G GWA study under a different name, rs114339898, but the imputation quality was only sufficient for inclusion in seven of the studies (S5 Table).
Overlapping loci
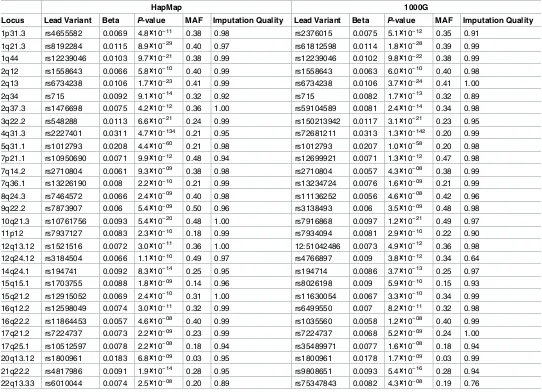
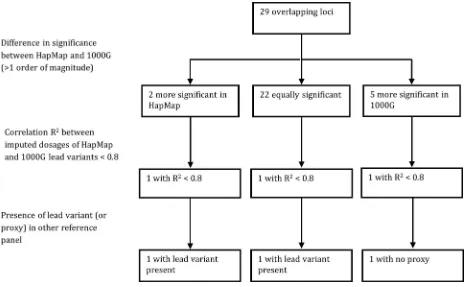
Regional plots of the 29 overlapping loci are shown inS4 Table. The lead variants of eight of the 29 overlapping loci were the same for the HapMap and 1000G GWA studies.P-value dif-ferences between the HapMap and 1000G GWA studies were often small: they were smaller than or equal to one order of magnitude for 22 loci.P-values differed by more than one order of magnitude for seven loci. Five of these loci were more significant in the 1000G GWA study (2q37.3, 4q31.3, 10q21.3, 12q24.12, and 21q22.2), while two of these loci were more significant in the HapMap GWA study (5q31.1 and 8q24.3).
Among the five overlapping loci with lowerP-values in the 1000G GWA study, the correla-tion r2between imputed dosages of lead variants from HapMap and 1000G was higher than 0.8 for 4 loci, but was 0.68 for the 12q24.12 locus (S4 Table). There was no good proxy of the 1000G lead variant at the 12q24.12 locus included in the HapMap GWA study.
The 5q31.1 and 8q24.3 loci had lowerP-values in the HapMap GWA study. The correlation r2between imputed dosages from HapMap and 1000G was almost perfect for 5q31.1, but was 0.75 for 8q24.3. The HapMap lead variant of the 8q24.3 locus was also included in the 1000G GWA study. These differences between HapMap and 1000G imputation for the 29 overlapping loci are summarized inFig 5.
Sensitivity analyses
Because more independent variants are included in the 1000G GWA study [20,21], using the conventional genome-wide significance threshold of 5×10⁻⁸may result in an increased type I error rate. When we used a more stringent genome-wide significance threshold of 2.5×10⁻⁸for the 1000G GWA study as suggested by Huang et al. [20], there were 4 loci significant only in the HapMap GWA study, 5 loci significant only in the 1000G GWA study, and 26 overlapping loci (Fig 1B). Three loci that were significant using both HapMap and 1000G imputation thus became non-significant when the stricter significance threshold was applied to the 1000G results.
Genomic inflation factors to correct for genomic control were calculated separately for the HapMap and 1000G analyses of each study. Thus, differences in the genomic inflation factors could explain some of the differences between the HapMap and 1000G results. When we repeated the HapMap and 1000G GWA study without applying genomic control corrections, 2 loci were associated only with circulating fibrinogen concentration in the HapMap GWA study, 6 were only associated in the 1000G GWA study, and 30 were associated in both GWA studies (Fig 1CandS6 Table).
For practical reasons, not all of the studies used the same imputation software, analysis soft-ware, or covariates for the HapMap and 1000G analyses. Specifically, fewer studies used princi-pal components in the HapMap GWA study. When we restricted the analysis to those studies that used the same imputation software, analysis software, and covariates in the HapMap and 1000G GWA studies (S7 TableandS8 Table), 3 loci were associated only in the 1000G GWA study, and 6 were associated in both the HapMap and the 1000G GWA studies (Fig 1DandS9 Table). No loci were associated only in the HapMap GWA study.
Discussion
In our fibrinogen GWA study of 91,953 individuals, using 1000G instead of HapMap imputa-tion led to the identificaimputa-tion of six addiimputa-tional fibrinogen loci, suggesting an improvement in the detection of associated signals. Nevertheless, there was also one locus that was only identi-fied when using HapMap imputation, and the advantage of 1000G imputation was attenuated when using a more stringent Bonferroni correction for the 1000G GWA study. The inclusion of indels in the 1000G GWA study did not lead to the identification of any new loci. Only one locus in our 1000G GWA study was led by an indel, and it was in strong linkage disequilibrium with a SNP present in HapMap.
While this is the first study of the impact of HapMap and 1000G imputation on genome-wide associations using exactly the same individuals in a large-scale consortium setting, four previous studies have addressed this question on a smaller scale. In the Wellcome Trust Case Control Consortium, consisting of 2000 for seven diseases (bipolar disorder, coronary artery disease, Crohn’s disease, hypertension, rheumatoid arthritis, type 1 and 2 diabetes) and 3000 shared controls, Huang et al. re-analyzed GWA studies of these seven diseases with 1000G imputation, and found two novel loci: one for type 1 diabetes and one for type 2 diabetes [20]. A more conservative genome-wide significance threshold of 2.5×10⁻⁸was used in the 1000G GWA studies, while the MAF inclusion threshold was the same at 1%. The second study was a 1000G imputed GWA study of around 2000 cases of venous thrombosis and 2400 controls [22]. Using a conservative P-value threshold of 7.4×10⁻⁹, but no MAF threshold, Germain et al. identified an uncommon variant at a novel locus that was not identified in the HapMap GWA study [22]. Third, the National Cancer Institute Breast and Prostate Cancer Cohort Consortium found no new loci by applying 1000G imputation to their existing dataset of 2800 cases and 4500 controls [23,24]. The conventional genome-wide significance threshold of 5×10⁻⁸was used, but no MAF threshold was used. Fourthly, Wood et al. compared HapMap and 1000G imputation for a total of 93 quantitative traits in 1210 individuals from the InCHIANTI study [25]. Using a significance threshold of 5×10⁻⁸for both the HapMap and 1000G GWA studies, they found 20 overlapping associations, 13 associations that were only significant using 1000G imputation, and one association that was only significant using Hap-Map imputation. For the association significant only in HapHap-Map, theP-value difference between HapMap and 1000G lead variants was less than one order of magnitude. When the authors lowered their significance threshold to 5×10⁻¹¹to reflect the number of tests being done in analyzing multiple traits, 9 associations remained significant based on HapMap impu-tation and 11 associations remained significant based on 1000G impuimpu-tation.
All four of these comparison studies used an earlier 1000 genomes reference panel. The present study adds to the literature as it is based on the widely implemented Phase 1 Version 3 of 1000G. Crucially, the large sample size allowed us to examine differences at many non-over-lapping and overnon-over-lapping loci, and improved the generalizability of our results, as ongoing GWA studies are often conducted in large consortia.
Intramural Research Program of the NIH, National Institute on Aging, by Sardinian Autonomous Region (L.R. no. 7/2009) grant cRP3-154, and by grant FaReBio2011 “Farmaci e Reti
Biotecnologiche di Qualità”. SHIP is part of the Community Medicine Research net of the University of Greifswald, Germany, which is funded by the Federal Ministry of Education and Research (grants no. 01ZZ9603, 01ZZ0103, and 01ZZ0403), the Ministry of Cultural Affairs as well as the Social Ministry of the Federal State of Mecklenburg - West Pomerania. Genome- wide data have been supported by the Federal Ministry of Education and Research (grant no. 03ZIK012) and a joint grant from Siemens Healthcare, Erlangen, Germany and the Federal State of Mecklenburg West Pomerania. Computing resources have been made available by the Leibniz Supercomputing Centre of the Bavarian Academy of Sciences and Humanities (HLRB project h1231). The University of Greifswald is a member of the ’Center of Knowledge Interchange’ program of the Siemens AG and the Cache´ Campus program of the InterSystems GmbH. This work is also part of the research project Greifswald Approach to Individualized Medicine (GANI_MED). The GANI_MED consortium is funded by the Federal Ministry of Education and Research and the Ministry of Cultural Affairs of the Federal State of Mecklenburg – West Pomerania (03IS2061A). TwinsUK. The study was funded by the Wellcome Trust; European Community’s Seventh Framework Programme (FP7/2007-2013). The study also receives support from the National Institute for Health Research (NIHR) Clinical Research Facility at Guy’s & St Thomas’ NHS Foundation Trust and NIHR Biomedical Research Centre based at Guy’s and St Thomas’ NHS Foundation Trust and King’s College London. Tim Spector is an NIHR senior Investigator and is holder of an ERC Advanced Principal Investigator award. SNP Genotyping was performed by The Wellcome Trust Sanger Institute and National Eye Institute via NIH/CIDR. The WGHS is supported by HL043851 and HL080467 from the National Heart, Lung, and Blood Institute and CA047988 from the National Cancer Institute, the Donald W. Reynolds Foundation and the Fondation Leducq, with collaborative scientific support and funding for genotyping provided by Amgen.
Competing Interests: Dr. BM Psaty serves on the
Two further studies with different approaches also provide insights. First, Springelkamp et al. found a novel locus using 1000G imputation even though the sample size was smaller than the previous HapMap GWA study [26,27]. The same genome-wide significance (5×10⁻⁸) and MAF (1%) thresholds were used. The lowestP-value at the locus was 1.9×10⁻⁸. Because different individuals were included in these GWA studies, the difference between HapMap and 1000G may partially be explained by sampling variability. Second, Shin et al. identified 299 SNP-metabolite associations based on HapMap imputation, and reexamined the associ-ated loci using 1000G imputation in the same individuals [28]. They found that HapMap and 1000G imputation yielded similarP-values and variance explained for all but one loci. For that locus, the 1000G imputation based association was considerably stronger: the explained vari-ance increased from 10% to 16%, and theP-value decreased from 8.8×10−113to 7.7×10−244. Although Shin et al. did not compare loci identified using HapMap and 1000G, their results do support our finding that large differences in association strengths are possible, albeit not at every locus. All these studies, along with the current study, suggest that additional signals not previously identified in HapMap GWA studies can be found using the 1000G GWA study, with the same sample size.
In the current study we demonstrate that, although 1000G imputation was overall more effective at identifying associated loci, HapMap imputation may outperform 1000G imputa-tion for specific loci. The 6p21.3 locus, corresponding to the major histocompatibility complex (MHC), was significant in the HapMap GWA study but not in the 1000G GWA study. The MHC locus is highly polymorphic and hosts many repetitive sequences, rendering it difficult to genotype and sequence [29–31]. The HapMap reference panel was based largely on the gen-otyping of variants that were known at that time, whereas the 1000G reference panel is based entirely on low-coverage sequencing. This may explain the rather large discrepancy between HapMap and 1000G at this locus.
[image:7.612.37.573.511.653.2]Differences in associations when GWA studies are based on different participants can be explained by sampling variability, even with the same sample size. Hence, by using exactly the same participants in the HapMap and 1000G comparisons in the present project, we rule out both statistical power and sampling variability as possible explanations for differences between the HapMap and 1000G GWA studies. Several real differences between the HapMap and 1000G reference panels may underlie the net benefit of 1000G imputation. The HapMap
Table 1. Non-overlapping loci that were significant in either the HapMap or 1000G GWA studies.
HapMap 1000G
Locus Lead Variant Beta P-value MAF Imputation Quality Lead Variant Beta P-value MAF Imputation Quality
Significant in 1000G
1q42.13 rs10489615 0.0052 8.3×10−07 0.38 0.97 rs10864726 0.0059 1.1×10−08 0.40 0.96
3q21.1 rs16834024 0.0173 1.4×10−07 0.03 0.79 rs1976714 0.0064 7.5×10−09 0.35 0.89
4p16.3 rs2699429 0.0060 1.3×10−07 0.43 0.87 rs59950280 0.0080 2.5×10⁻¹¹ 0.34 0.80 7p15.3 rs1029738 0.0057 3.2×10−07 0.30 1.00 rs61542988 0.0065 3.1×10−08 0.25 0.98 8p23.1 rs7004769 0.0062 1.4×10−06 0.20 1.00 rs7012814 0.0061 8.0×10−09 0.47 0.91
11q12.2 rs7935829 0.0056 5.6×10−08 0.40 0.99 rs11230201 0.0060 3.0×10−09 0.41 0.99
Significant in HapMap
6p21.3 rs12528797 0.0095 8.5×10−09 0.11 0.98 rs116134220 0.0082 7.9×10−06 0.49 0.89
Further detail about these loci and the lead variants is provided inS3 Table. Abbreviations: HapMap refers to the GWA study using imputation based on the HapMap project. 1000G refers to the GWA study using imputation based on the 1000 Genomes Project. Variants were coded according to the fibrinogen increasing allele. MAF refers to minor allele frequency.
reference panel was largely based on genotypes of known variants, whereas the 1000G refer-ence panel was primarily based on low-pass whole genome sequencing, enhancing the inclu-sion of novel variants. Additionally, most studies used only a small number of European-ancestry participants for HapMap imputation, whereas they used a larger number of partici-pants of all available ancestries for 1000G imputation, introducing further haplotypes into the imputation process.
[image:8.612.35.577.88.480.2]Nevertheless, some analytical differences between the HapMap and 1000G analyses were not controlled for in our main analysis and therefore remain as potential alternative explana-tions. First, genomic control corrections were applied to the results of each of the studies before meta-analysis, separately for the HapMap and 1000G GWA studies. As a result, for any given study, there could be differences between the correction applied to the HapMap GWA analysis and to the 1000G GWA analysis. As these differences do not appear to differ Table 2. Overlapping loci that were significant in both the HapMap and 1000G GWA studies.
HapMap 1000G
Locus Lead Variant Beta P-value MAF Imputation Quality Lead Variant Beta P-value MAF Imputation Quality
1p31.3 rs4655582 0.0069 4.8×10⁻¹¹ 0.38 0.98 rs2376015 0.0075 5.1×10⁻¹² 0.35 0.91
1q21.3 rs8192284 0.0115 8.9×10⁻²⁹ 0.40 0.97 rs61812598 0.0114 1.8×10⁻²⁸ 0.39 0.99
1q44 rs12239046 0.0103 9.7×10⁻²¹ 0.38 0.99 rs12239046 0.0102 9.8×10⁻²² 0.38 0.99 2q12 rs1558643 0.0066 5.8×10⁻¹⁰ 0.40 0.99 rs1558643 0.0063 6.0×10⁻¹⁰ 0.40 0.98 2q13 rs6734238 0.0106 1.7×10⁻²³ 0.41 0.99 rs6734238 0.0106 3.7×10⁻²⁴ 0.41 1.00
2q34 rs715 0.0092 9.1×10⁻¹⁴ 0.32 0.92 rs715 0.0082 1.7×10⁻¹³ 0.32 0.89
2q37.3 rs1476698 0.0075 4.2×10⁻¹² 0.36 1.00 rs59104589 0.0081 2.4×10⁻¹⁴ 0.34 0.98 3q22.2 rs548288 0.0113 6.6×10⁻²¹ 0.24 0.99 rs150213942 0.0117 3.1×10⁻²¹ 0.23 0.95 4q31.3 rs2227401 0.0311 4.7×10−134 0.21 0.95 rs72681211 0.0313 1.3×10−142 0.20 0.99
5q31.1 rs1012793 0.0208 4.4×10−60 0.21 0.98 rs1012793 0.0207 1.0×10−58 0.20 0.98
7p21.1 rs10950690 0.0071 9.9×10⁻¹² 0.48 0.94 rs12699921 0.0071 1.3×10⁻¹² 0.47 0.98 7q14.2 rs2710804 0.0061 9.3×10−09 0.38 0.98 rs2710804 0.0057 4.3×10−08 0.38 0.99 7q36.1 rs13226190 0.008 2.2×10⁻¹⁰ 0.21 0.99 rs13234724 0.0076 1.6×10−09 0.21 0.99
8q24.3 rs7464572 0.0066 2.4×10−09 0.40 0.98 rs11136252 0.0056 4.6×10−08 0.42 0.96
9q22.2 rs7873907 0.006 5.4×10−09 0.50 0.96 rs3138493 0.006 3.5×10−09 0.48 0.98 10q21.3 rs10761756 0.0093 5.4×10⁻²⁰ 0.48 1.00 rs7916868 0.0097 1.2×10⁻²¹ 0.49 0.97 11p12 rs7937127 0.0083 2.3×10⁻¹⁰ 0.18 0.99 rs7934094 0.0081 2.9×10⁻¹⁰ 0.22 0.90
12q13.12 rs1521516 0.0072 3.0×10⁻¹¹ 0.36 1.00 12:51042486 0.0073 4.9×10⁻¹² 0.36 0.98
12q24.12 rs3184504 0.0066 1.1×10⁻¹⁰ 0.49 0.97 rs4766897 0.009 3.8×10⁻¹² 0.34 0.64 14q24.1 rs194741 0.0092 8.3×10⁻¹⁴ 0.25 0.95 rs194714 0.0086 3.7×10⁻¹³ 0.25 0.97 15q15.1 rs1703755 0.0088 1.8×10−09 0.14 0.96 rs8026198 0.009 5.9×10⁻¹⁰ 0.15 0.93
15q21.2 rs12915052 0.0069 2.4×10⁻¹⁰ 0.31 1.00 rs11630054 0.0067 3.3×10⁻¹⁰ 0.34 0.99
16q12.2 rs12598049 0.0074 3.0×10⁻¹¹ 0.32 0.99 rs6499550 0.007 8.2×10⁻¹¹ 0.32 0.98 16q22.2 rs11864453 0.0057 4.6×10−08 0.40 0.99 rs1035560 0.0058 1.2×10−08 0.40 0.99 17q21.2 rs7224737 0.0073 2.2×10−09 0.23 0.99 rs7224737 0.0068 5.2×10−09 0.24 1.00
17q25.1 rs10512597 0.0078 2.2×10−08 0.18 0.94 rs35489971 0.0077 1.6×10−08 0.18 0.94
20q13.12 rs1800961 0.0183 6.8×10−09 0.03 0.95 rs1800961 0.0178 1.7×10−09 0.03 0.99
21q22.2 rs4817986 0.0091 1.9×10⁻¹⁴ 0.28 0.95 rs9808651 0.0093 5.4×10⁻¹⁶ 0.28 0.94 22q13.33 rs6010044 0.0074 2.5×10−08 0.20 0.89 rs75347843 0.0082 4.3×10−08 0.19 0.76
Further detail about these loci and the lead variants is provided inS3 Table. Abbreviations: HapMap refers to the GWA study using imputation based on the HapMap project. 1000G refers to the GWA study using imputation based on the 1000 Genomes Project. Variants were coded according to the fibrinogen increasing allele. MAF refers to minor allele frequency.
systematically between the HapMap and 1000G GWA analyses in our study, the genomic con-trol corrections are unlikely to explain our results. The results from our sensitivity analysis were concordant with this interpretation: when no genomic control corrections were applied Fig 2. Summary of the differences between HapMap and 1000G imputation for the seven non-overlapping loci.
doi:10.1371/journal.pone.0167742.g002
Fig 3. Regional plots of non-overlapping loci that were more significantly associated with fibrinogen in the 1000G GWA study, including variants from both the HapMap (red) and 1000G (green) GWA studies.
[image:9.612.182.574.464.690.2]there were 6 loci only significant in the 1000G GWA study compared to 2 loci only significant in the HapMap GWA study.
[image:10.612.200.445.77.276.2]The second difference between the HapMap and 1000G GWA studies that may explain our findings is that in the 1000G GWA study more studies were adjusted for ancestry-informative Fig 4. Regional plot of 6p21.3, a non-overlapping locus that was more significantly associated with fibrinogen in the HapMap GWA study, including variants from both the HapMap (red) and 1000G (green) GWA studies.
doi:10.1371/journal.pone.0167742.g004
Fig 5. Summary of the differences between HapMap and 1000G imputation for the 29 overlapping loci.
[image:10.612.112.576.408.695.2]principal components. This difference reflects common practice, as population stratification is suspected to have a stronger influence on variants with lower MAF, and 1000G includes more of these [32]. However, the adjustments are applied to variants across the spectrum of minor allele frequencies, which may have influenced our results.
Thirdly, some studies used different software for HapMap and 1000G imputation (S1 Table). The imputation quality metrics used by IMPUTE and MACH differ, and this has tradi-tionally been dealt with by applying different imputation quality thresholds:>0.3 for MACH and>0.4 for IMPUTE [5,33]. In studies that used different imputation software for the Hap-Map and 1000G GWA studies, the filtering of variants can therefore differ. There may, addi-tionally, be real differences in imputation quality. Finally, some studies used different analysis software (S3 Table). When we restricted our analysis to only those studies that used the same covariates, analysis software, and imputation software for the HapMap and 1000G GWA stud-ies, 3 loci were only significant in the 1000G GWA study, while all loci significant in the Hap-Map GWA study were also significant in the 1000G GWA study. This suggests that differences in imputation software, analysis software, and covariates do not fully explain the observed dif-ference between the HapMap and 1000G GWA studies, and that there are real difdif-ferences resulting from choice of reference panel.
1000G GWA studies include more independent statistical tests than HapMap GWA studies [20,21]. Thus, while aP-value threshold of 5×10⁻⁸, correcting for 1 million independent tests, maintains the type I error rate at 5% for HapMap GWA studies, this may not be the case for 1000G GWA studies. Using 1000G pilot data, Huang et al. estimated that 2 million indepen-dent tests were being done, and thus suggested aP-value threshold of 2.5×10⁻⁸[20]. In our study we used aP-value threshold of 5×10⁻⁸for both the HapMap and 1000G GWA studies, in accordance with the majority of published 1000G GWA studies [26,34–37]. When we used the threshold of 2.5×10⁻⁸in the 1000G imputed GWA study, the difference between the Hap-Map and 1000G GWA studies became smaller. Thus, while we expect applying 1000G imputa-tion may lead to novel findings using the convenimputa-tional genome-wide significance threshold, this expectation may not be met when using stricter, and perhaps more appropriate thresholds. In other words, using the traditional significance threshold for 1000G may increase the type 1 error rate, which may account for some additional significant loci detected in 1000G GWA studies.
In this study we only examined variants with a MAF of greater than 1%. This restriction was common practice for HapMap GWA studies, but given the improved coverage of rare var-iants in 1000G, this may not remain the case for 1000G GWA studies. Different MAF thresh-olds have been used in published 1000G GWA studies, although many have used 1% [20,22, 23,26,27,34–40]. Therefore, an advantage of 1000G not illustrated by this study may be the identification of rare variants, at new loci or as secondary signals at known loci. The advantage of 1000G imputation will then in part depend on the importance and impact of rare variants in the trait being studied, as well as the distribution of these variants. Rare and uncommon var-iants are often clustered in genes with previously associated common varvar-iants, limiting the new biology revealed through their identification [41,42]. This appears to be the case for fibrinogen concentration as well [43,44].
for. Given that the bulk of the new information provided by 1000G imputation relates to low-frequency variants, we expect the penalty increased multiple testing burden to become less rel-evant in future studies as the power to examine these low-frequency variants increases with larger sample sizes and enhanced imputation quality. Imputation using the Haplotype Refer-ence Consortium referRefer-ence panel improves the imputation quality of low-frequency variants when compared to 1000G, and future reference panels based on the wealth of whole-genome sequencing data currently being generates by efforts such as TOPMed are likely to continue this trend [45].
Methods
Population
the Medical Ethics Committee of the University of Greifswald. The TwinsUK study was approved by the NRES Committee London-Westminster (formerly St Thomas’ Ethics Com-mittee). The WGHS was approved by Brigham and Women’s Hostpital IRB.
Genotyping and imputation
Genotyping and pre-imputation quality control methods for each study are shown inS7 Table. Studies imputed dosages of genetic variants using reference panels from the 1000 genomes project with MACH [47,48] or IMPUTE [49]. Studies imputed variant dosages using Phase 2 reference panels from the HapMap project with MACH [47,48], IMPUTE [49], or BIMBAM [50]. We excluded variants with MACH imputation quality<0.3, IMPUTE/BIMBAM impu-tation quality<0.4, or MAF<0.01 from each study.
Fibrinogen measurement
Fibrinogen concentration was measured in citrated or EDTA plasma samples using a variety of methods including the Clauss method, immunonephelometric methods, immunoturbidimetric methods, and other functional methods. Fibrinogen concentration was measured in g/L and natural log transformed. Details about the fibrinogen measurement are shown inS10 Table.
Genome-wide association analysis
All analyses were adjusted for age and sex, and study specific covariates such as center or case/ control status. In family studies, linear mixed models were used to account for family struc-ture. Some studies adjusted the analysis for principle components to account for population structure and cryptic relatedness. Some studies used a different number of principle compo-nents in the HapMap and 1000G analyses. The adjustments and analysis software used by each study are shown inS8 Table. We applied a genomic control correction to the results of each of the studies before meta-analysis to remove any remaining genomic inflation. The genomic inflation factor used in this correction was calculated separately in the HapMap and 1000G analyses for each study. We meta-analyzed the results using an inverse-variance model with fixed effects implemented in METAL [51]. Loci were defined as the 500 Kb area on either side of lead variants (the variant with the smallestP-value). Build 36 positions of HapMap SNPs were converted to build 37 using the UCSC genome browser (http://genome.ucsc.edu/cgi-bin/ hgLiftOver). Variants were annotated to genes using ANNOVAR version 2013Mar07. At the meta-analysis level, the imputation quality of each variant was defined as the sample-size weighted mean imputation quality across the studies, not including studies where the variant was filtered out.
Comparison of HapMap and 1000G
When a locus was significant in both the HapMap and 1000G GWA studies we defined it as an overlapping locus. When a locus was significant in only one of the two analyses we defined it as a non-overlapping locus. To compare the strength of association in the HapMap and 1000G GWA studies, we identified loci withP-value differences of 1 order of magnitude or greater (for example: from 5×10⁻⁸compared to 5×10⁻⁹or less).
1000G lead variant or a proxy was included in the HapMap GWA study. Second, we examined the correlation R2between HapMap and 1000G lead variants in the form of imputed genotype dosages. This was performed for 5966 individuals from the Rotterdam Study (see study description inS1 Text) [52].
Sensitivity analysis
First, we compared the results of the HapMap and 1000G GWA studies when applying a stric-ter Bonferroni-correctedP-value threshold of 2.5×10⁻⁸to the 1000G GWA study. This thresh-old was suggested by Huang et al. to keep the type 1 error rate at 5% when using 1000G data [20]. Second, we repeated the analysis without using genomic control corrections. Third, we repeated the analysis in 34,098 participants using only the 10 studies that used the same impu-tation and analysis software as well as the same covariates for the HapMap and 1000G GWA studies.
Supporting Information
S1 Fig. Quantile-Quantile (QQ) plots comparing the HapMap and 1000G GWA studies.
(DOCX)
S2 Fig. Manhattan plot comparing the HapMap (red) and 1000G (green) GWA studies.
(DOCX)
S3 Fig. Comparison of lead variants of the HapMap and 1000G GWA studies of significant loci.
(DOCX)
S4 Fig. Regional plots of overlapping signals that were significant in both the HapMap (red) and 1000G (green) GWA studies.
(DOCX)
S1 Table. Characteristics of the included studies and their participants.
(XLSX)
S2 Table. Genomic inflation factors by study and imputation panel.
(XLSX)
S3 Table. Annotation of loci significant in the HapMap GWA study, 1000G GWA study, or both.
(XLSX)
S4 Table. Correlation between the lead variants from the HapMap and 1000G GWA stud-ies.
(XLSX)
S5 Table. Differences between HapMap and 1000G for loci with a correlation R2<0.8 between imputed dosages of the HapMap and 1000G lead variants.
(XLSX)
S6 Table. Loci that were significant in either the HapMap or 1000G GWA studies with genomic control corrections.
(XLSX)
S7 Table. Genotyping and imputation methods of the included studies.
S8 Table. Analysis software and covariates used by the included studies.
(XLSX)
S9 Table. Loci that were significant in either the HapMap or 1000G GWAS excluding stud-ies that did not use the same imputation software, analysis software, or covariates.
(XLSX)
S10 Table. Sample and array type used for the fibrinogen measurement in each of the included studies.
(XLSX)
S1 Text. Supplementary Methods.
(DOCX)
Acknowledgments
The authors acknowledge the essential role of the Cohorts for Heart and Aging Research in Genome Epidemiology (CHARGE) Consortium in development and support of this manu-script. The authors thank the staff and participants of the ARIC study for their important con-tributions. We would like to thank the University of Minnesota Supercomputing Institute for use of the calhoun supercomputers. A full list of principal CHS investigators and institutions can be found at CHS-NHLBI.org. The analyses reflect intellectual input and resource develop-ment from the Framingham Heart Study investigators participating in the SNP Health As-sociation Resource (SHARe) project. The authors would like to thank the men and women participating in the HCS as well as The University of Newcastle, Vincent Fairfax Family Foun-dation and The Hunter Medical Research Institute. We thank the LBC1936 and LBC1921 par-ticipants and research team members. We thank the nurses and staff at the Wellcome Trust Clinical Research Facility, where subjects were tested and the genotyping was performed. We thank the LURIC study team who were either temporarily or permanently involved in patient recruitment as well as sample and data handling, in addition to the laboratory staff at the Lud-wigshafen General Hospital and the Universities of Freiburg and Ulm, Germany. This work was performed as part of an ongoing collaboration of the PROSPER study group in the univer-sities of Leiden, Glasgow and Cork. The authors are grateful to the study participants, the staff from the Rotterdam Study and the participating general practitioners and pharmacists. We thank Pascal Arp, Mila Jhamai, Marijn Verkerk, Lizbeth Herrera, Marjolein Peters and Caro-lina Medina-Gomez for their help in creating the GWAS database, and Karol Estrada and Carolina Medina-Gomez for the creation and analysis of imputed data. We thank the many individuals who generously participated in this study, the Mayors and citizens of the Sardinian towns involved, the head of the Public Health Unit ASL4, and the province of Ogliastra for their volunteerism and cooperation. In addition, we are grateful to the Mayor and the adminis-tration in Lanusei for providing and furnishing the clinic site. We are grateful to the physicians Angelo Scuteri, Marco Orru`, Maria Grazia Pilia, Liana Ferreli, Francesco Loi, nurses Paola Loi, Monica Lai and Anna Cau who carried out participant physical exams; the recruitment personnel Susanna Murino; Mariano Dei, Sandra Lai, Andrea Maschio, Fabio Busonero for genotyping; Maria Grazia Piras and Monia Lobina for fibrinogen phenotyping.
Lung, and Blood Institute grant R01HL105756. ARIC is carried out as a collaborative study sup-ported by National Heart, Lung, and Blood Institute (NHLBI) contracts HHSN268201100005C, HHSN268201100006C, HHSN268201100007C, HHSN268201100008C, HHSN268201100009C, HHSN268201100010C, HHSN268201100011C, and HHSN268201100012C, R01HL087641, R01HL59367 and R01HL086694; National Human Genome Research Institute contract U01HG004402; and National Institutes of Health contract HHSN268200625226C. Infrastruc-ture was partly supported by Grant Number UL1RR025005, a component of the National Institutes of Health and NIH Roadmap for Medical Research. LITE is supported by
HL0597367 from the NHLBI. B58C acknowledges use of phenotype and genotype data from the British 1958 Birth Cohort DNA collection, funded by the Medical Research Council grant G0000934 and the Wellcome Trust grant 068545/Z/02. Genotyping for the B58C-WTCCC subset was funded by the Wellcome Trust grant 076113/B/04/Z. The B58C-T1DGC genotyp-ing utilized resources provided by the Type 1 Diabetes Genetics Consortium, a collaborative clinical study sponsored by the National Institute of Diabetes and Digestive and Kidney Dis-eases (NIDDK), National Institute of Allergy and Infectious DisDis-eases (NIAID), National Human Genome Research Institute (NHGRI), National Institute of Child Health and Human Development (NICHD), and Juvenile Diabetes Research Foundation International (JDRF) and supported by U01 DK062418. B58C-T1DGC GWAS data were deposited by the Diabetes and Inflammation Laboratory, Cambridge Institute for Medical Research (CIMR), University of Cambridge, which is funded by Juvenile Diabetes Research Foundation International, the Wellcome Trust and the National Institute for Health Research Cambridge Biomedical Re-search Centre; the CIMR is in receipt of a Wellcome Trust Strategic Award (079895). The B58C-GABRIEL genotyping was supported by a contract from the European Commission Framework Programme 6 (018996) and grants from the French Ministry of Research. The
BMES has been supported by the Australian National Health & Medical Research Council,
from the European Union’s Seventh Framework Programme (FP7/2007-2013) under grant agreement n˚ HEALTH-F2-2009-223004. For a part of the genotyping we received funding from the Netherlands Consortium of Healthy Aging (NGI: 05060810). Measurement of serum fibrinogen was supported by a grant from the Scottish Executive Chief Scientist Office, Health Services Research Committee grant number CZG/4/306. Prof. Dr. J.W. Jukema is an Estab-lished Clinical Investigator of the Netherlands Heart Foundation (2001 D 032). The generation and management of GWAS genotype data for the Rotterdam Study is supported by the Nether-lands Organisation of Scientific Research NWO Investments (nr. 175.010.2005.011, 911-03-012). This study is funded by the Research Institute for Diseases in the Elderly (014-93-015; RIDE2), the Netherlands Genomics Initiative (NGI)/Netherlands Organisation for Scientific Research (NWO) project nr. 050-060-810. The Rotterdam Study is funded by Erasmus Medical Center and Erasmus University, Rotterdam, Netherlands Organization for the Health Research and Development (ZonMw), the Research Institute for Diseases in the Elderly (RIDE), the Min-istry of Education, Culture and Science, the MinMin-istry for Health, Welfare and Sports, the Euro-pean Commission (DG XII), and the Municipality of Rotterdam. Abbas Dehghan is supported by NWO grant (veni, 916.12.154) and the EUR Fellowship. The SardiNIA (‘‘ProgeNIA”) team was supported by Contract NO1-AG-1–2109 from the NIA. This research was supported by the Intramural Research Program of the NIH, National Institute on Aging, by Sardinian Autono-mous Region (L.R. no. 7/2009) grant cRP3-154, and by grant FaReBio2011 “Farmaci e Reti Biotecnologiche di Qualità”. SHIP is part of the Community Medicine Research net of the Uni-versity of Greifswald, Germany, which is funded by the Federal Ministry of Education and Research (grants no. 01ZZ9603, 01ZZ0103, and 01ZZ0403), the Ministry of Cultural Affairs as well as the Social Ministry of the Federal State of Mecklenburg—West Pomerania. Genome-wide data have been supported by the Federal Ministry of Education and Research (grant no. 03ZIK012) and a joint grant from Siemens Healthcare, Erlangen, Germany and the Federal State of Mecklenburg West Pomerania. Computing resources have been made available by the Leibniz Supercomputing Centre of the Bavarian Academy of Sciences and Humanities (HLRB project h1231). The University of Greifswald is a member of the ’Center of Knowledge Inter-change’ program of the Siemens AG and the Cache´ Campus program of the InterSystems GmbH. This work is also part of the research project Greifswald Approach to Individualized Medicine (GANI_MED). The GANI_MED consortium is funded by the Federal Ministry of Education and Research and the Ministry of Cultural Affairs of the Federal State of Mecklen-burg–West Pomerania (03IS2061A). TwinsUK. The study was funded by the Wellcome Trust; European Community’s Seventh Framework Programme (FP7/2007-2013). The study also receives support from the National Institute for Health Research (NIHR) Clinical Research Facility at Guy’s & St Thomas’ NHS Foundation Trust and NIHR Biomedical Research Centre based at Guy’s and St Thomas’ NHS Foundation Trust and King’s College London. Tim Spector is an NIHR senior Investigator and is holder of an ERC Advanced Principal Investigator award. SNP Genotyping was performed by The Wellcome Trust Sanger Institute and National Eye Institute via NIH/CIDR. The WGHS is supported by HL043851 and HL080467 from the National Heart, Lung, and Blood Institute and CA047988 from the National Cancer Institute, the Donald W. Reynolds Foundation and the Fondation Leducq, with collaborative scientific support and funding for genotyping provided by Amgen.
Author Contributions
Formal analysis: PSdV MSL DIC ST TSA AT MEK MHC REM MS LCW RP VG JAB CV TT
LMR CO JM S. Basu JJH GED AK LML MM ACM HHMD BM JH PGH WG PES HB WT JWJ DPS AD.
Investigation: DIC JW JRA S. Bandinelli A. Hamsten PSW BMP AGU EJCdG A. Hofman
OHF TDS IJD WM A. Greinacher FC DIB HW WT PMR JWJ PM TH CJOD DPS AR AM AJMdC A. Grotevendt TLB MPMdM GDL NS MAM JMS TZ DJS KJL LF NLS ST MEK MF JJH KDT MZ UV JH EGH DGH FR WLM PES RJS.
Supervision: DPS AD.
Visualization: PSdV MSL SL AD.
Writing – original draft: PSdV MSL AD.
Writing – review & editing: PSdV MSL DIC ST TSA AT MEK MHC JJW JRA REM MS LCW
RP VG JAB CV TT LMR CO JM S. Basu MF QY SL JJH AR AM AJMdC A. Greinacher KDT GED AK LML TLB MM S. Bandinelli ACM A. Hamsten GT MPMdM HHMD GDL MZ NS KJL UV BM JH EGH MAM JMS PGH DGH WG FR WLM PES TZ BMP AGU EJCdG DJS HB A. Hofman OHF JIR LF TDS IJD WM A. Grotevendt PSW FC DIB HW WT PMR JWJ RJS PM TH CJOD NLS DPS AD.
References
1. International HapMap Consortium. The International HapMap Project. Nature. 2003; 426(6968):789– 96. doi:10.1038/nature02168PMID:14685227
2. Wood AR, Esko T, Yang J, Vedantam S, Pers TH, Gustafsson S, et al. Defining the role of common var-iation in the genomic and biological architecture of adult human height. Nat Genet. 2014; 46(11):1173– 86. Epub 2014/10/06. PubMed Central PMCID: PMC4250049. doi:10.1038/ng.3097PMID:25282103
3. Global Lipids Genetics C, Willer CJ, Schmidt EM, Sengupta S, Peloso GM, Gustafsson S, et al. Discov-ery and refinement of loci associated with lipid levels. Nat Genet. 2013; 45(11):1274–83. Epub 2013/10/ 08. PubMed Central PMCID: PMC3838666. doi:10.1038/ng.2797PMID:24097068
4. Smith NL, Huffman JE, Strachan DP, Huang J, Dehghan A, Trompet S, et al. Genetic predictors of fibrin D-dimer levels in healthy adults. Circulation. 2011; 123(17):1864–72. Epub 2011/04/20. PubMed Cen-tral PMCID: PMC3095913. doi:10.1161/CIRCULATIONAHA.110.009480PMID:21502573
5. Locke AE, Kahali B, Berndt SI, Justice AE, Pers TH, Day FR, et al. Genetic studies of body mass index yield new insights for obesity biology. Nature. 2015; 518(7538):197–206. Epub 2015/02/13. PubMed Central PMCID: PMC4382211. doi:10.1038/nature14177PMID:25673413
6. International Consortium for Blood Pressure Genome-Wide Association Studies, Ehret GB, Munroe PB, Rice KM, Bochud M, Johnson AD, et al. Genetic variants in novel pathways influence blood pres-sure and cardiovascular disease risk. Nature. 2011; 478(7367):103–9. Epub 2011/09/13. PubMed Cen-tral PMCID: PMC3340926. doi:10.1038/nature10405PMID:21909115
7. Huang J, Sabater-Lleal M, Asselbergs FW, Tregouet D, Shin SY, Ding J, et al. Genome-wide associa-tion study for circulating levels of PAI-1 provides novel insights into its regulaassocia-tion. Blood. 2012; 120 (24):4873–81. Epub 2012/09/20. PubMed Central PMCID: PMC3520624. doi: 10.1182/blood-2012-06-436188PMID:22990020
8. Huang J, Huffman JE, Yamakuchi M, Trompet S, Asselbergs FW, Sabater-Lleal M, et al. Genome-wide association study for circulating tissue plasminogen activator levels and functional follow-up implicates endothelial STXBP5 and STX2. Arterioscler Thromb Vasc Biol. 2014; 34(5):1093–101. Epub 2014/03/ 01. PubMed Central PMCID: PMC4009733. doi:10.1161/ATVBAHA.113.302088PMID:24578379
9. Estrada K, Styrkarsdottir U, Evangelou E, Hsu YH, Duncan EL, Ntzani EE, et al. Genome-wide meta-analysis identifies 56 bone mineral density loci and reveals 14 loci associated with risk of fracture. Nat Genet. 2012; 44(5):491–501. Epub 2012/04/17. PubMed Central PMCID: PMC3338864. doi:10.1038/ ng.2249PMID:22504420
11. Dehghan A, Dupuis J, Barbalic M, Bis JC, Eiriksdottir G, Lu C, et al. Meta-analysis of genome-wide association studies in>80 000 subjects identifies multiple loci for C-reactive protein levels. Circulation. 2011; 123(7):731–8. Epub 2011/02/09. PubMed Central PMCID: PMC3147232. doi:10.1161/ CIRCULATIONAHA.110.948570PMID:21300955
12. Smith NL, Chen MH, Dehghan A, Strachan DP, Basu S, Soranzo N, et al. Novel associations of multiple genetic loci with plasma levels of factor VII, factor VIII, and von Willebrand factor: The CHARGE (Cohorts for Heart and Aging Research in Genome Epidemiology) Consortium. Circulation. 2010; 121 (12):1382–92. Epub 2010/03/17. PubMed Central PMCID: PMC2861278. doi:10.1161/
CIRCULATIONAHA.109.869156PMID:20231535
13. Loth DW, Artigas MS, Gharib SA, Wain LV, Franceschini N, Koch B, et al. Genome-wide association analysis identifies six new loci associated with forced vital capacity. Nat Genet. 2014; 46(7):669–77. Epub 2014/06/16. PubMed Central PMCID: PMC4140093. doi:10.1038/ng.3011PMID:24929828
14. Zuk O, Schaffner SF, Samocha K, Do R, Hechter E, Kathiresan S, et al. Searching for missing heritabil-ity: designing rare variant association studies. Proc Natl Acad Sci U S A. 2014; 111(4):E455–64. Epub 2014/01/21. PubMed Central PMCID: PMC3910587. doi:10.1073/pnas.1322563111PMID:24443550
15. 1000 Genomes Project Consortium, Abecasis GR, Auton A, Brooks LD, DePristo MA, Durbin RM, et al. An integrated map of genetic variation from 1,092 human genomes. Nature. 2012; 491(7422):56–65. PubMed Central PMCID: PMC3498066. doi:10.1038/nature11632PMID:23128226
16. Zheng HF, Rong JJ, Liu M, Han F, Zhang XW, Richards JB, et al. Performance of genotype imputation for low frequency and rare variants from the 1000 genomes. PLoS One. 2015; 10(1):e0116487. PubMed Central PMCID: PMC4306552. doi:10.1371/journal.pone.0116487PMID:25621886
17. Loh PR, Danecek P, Palamara PF, Fuchsberger C, Y AR, H KF, et al. Reference-based phasing using the Haplotype Reference Consortium panel. Nat Genet. 2016; 48(11):1443–8. PubMed Central PMCID: PMCPMC5096458. doi:10.1038/ng.3679PMID:27694958
18. Consortium UK, Walter K, Min JL, Huang J, Crooks L, Memari Y, et al. The UK10K project identifies rare variants in health and disease. Nature. 2015; 526(7571):82–90. PubMed Central PMCID: PMCPMC4773891. doi:10.1038/nature14962PMID:26367797
19. Rich SS, Wang ZY, Sturcke A, Ziyabari L, Feolo M, O’Donnell CJ, et al. Rapid evaluation of phenotypes, SNPs and results through the dbGaP CHARGE Summary Results site. Nat Genet. 2016; 48(7):702–3. doi:10.1038/ng.3582PMID:27350599
20. Huang J, Ellinghaus D, Franke A, Howie B, Li Y. 1000 Genomes-based imputation identifies novel and refined associations for the Wellcome Trust Case Control Consortium phase 1 Data. Eur J Hum Genet. 2012; 20(7):801–5. Epub 2012/02/02. PubMed Central PMCID: PMC3376268. doi:10.1038/ejhg.2012. 3PMID:22293688
21. Li MX, Yeung JM, Cherny SS, Sham PC. Evaluating the effective numbers of independent tests and sig-nificant p-value thresholds in commercial genotyping arrays and public imputation reference datasets. Hum Genet. 2012; 131(5):747–56. Epub 2011/12/07. PubMed Central PMCID: PMC3325408. doi:10. 1007/s00439-011-1118-2PMID:22143225
22. Germain M, Saut N, Oudot-Mellakh T, Letenneur L, Dupuy AM, Bertrand M, et al. Caution in interpreting results from imputation analysis when linkage disequilibrium extends over a large distance: a case study on venous thrombosis. PLoS One. 2012; 7(6):e38538. Epub 2012/06/08. PubMed Central PMCID: PMC3366937. doi:10.1371/journal.pone.0038538PMID:22675575
23. Machiela MJ, Chen C, Liang L, Diver WR, Stevens VL, Tsilidis KK, et al. One thousand genomes impu-tation in the National Cancer Institute Breast and Prostate Cancer Cohort Consortium aggressive pros-tate cancer genome-wide association study. Prospros-tate. 2013; 73(7):677–89. Epub 2012/12/21. PubMed Central PMCID: PMC3962143. doi:10.1002/pros.22608PMID:23255287
24. Schumacher FR, Berndt SI, Siddiq A, Jacobs KB, Wang Z, Lindstrom S, et al. Genome-wide associa-tion study identifies new prostate cancer susceptibility loci. Hum Mol Genet. 2011; 20(19):3867–75. Epub 2011/07/12. PubMed Central PMCID: PMC3168287. doi:10.1093/hmg/ddr295PMID:21743057
25. Wood AR, Perry JR, Tanaka T, Hernandez DG, Zheng HF, Melzer D, et al. Imputation of variants from the 1000 Genomes Project modestly improves known associations and can identify low-frequency vari-ant-phenotype associations undetected by HapMap based imputation. PLoS One. 2013; 8(5):e64343. PubMed Central PMCID: PMC3655956. doi:10.1371/journal.pone.0064343PMID:23696881
26. Springelkamp H, Iglesias AI, Cuellar-Partida G, Amin N, Burdon KP, van Leeuwen EM, et al. ARH-GEF12 influences the risk of glaucoma by increasing intraocular pressure. Hum Mol Genet. 2015. Epub 2015/02/01.
28. Shin SY, Fauman EB, Petersen AK, Krumsiek J, Santos R, Huang J, et al. An atlas of genetic influences on human blood metabolites. Nat Genet. 2014; 46(6):543–50. Epub 2014/05/13. PubMed Central PMCID: PMC4064254. doi:10.1038/ng.2982PMID:24816252
29. Major E, Rigo K, Hague T, Berces A, Juhos S. HLA typing from 1000 genomes whole genome and whole exome illumina data. PLoS One. 2013; 8(11):e78410. Epub 2013/11/14. PubMed Central PMCID: PMC3819389. doi:10.1371/journal.pone.0078410PMID:24223151
30. Hosomichi K, Jinam TA, Mitsunaga S, Nakaoka H, Inoue I. Phase-defined complete sequencing of the HLA genes by next-generation sequencing. BMC Genomics. 2013; 14:355. Epub 2013/05/30. PubMed Central PMCID: PMC3671147. doi:10.1186/1471-2164-14-355PMID:23714642
31. de Bakker PI, Raychaudhuri S. Interrogating the major histocompatibility complex with high-throughput genomics. Hum Mol Genet. 2012; 21(R1):R29–36. Epub 2012/09/15. PubMed Central PMCID: PMC3459647. doi:10.1093/hmg/dds384PMID:22976473
32. Mathieson I, McVean G. Differential confounding of rare and common variants in spatially structured populations. Nat Genet. 2012; 44(3):243–6. Epub 2012/02/07. PubMed Central PMCID: PMC3303124. doi:10.1038/ng.1074PMID:22306651
33. Shungin D, Winkler TW, Croteau-Chonka DC, Ferreira T, Locke AE, Magi R, et al. New genetic loci link adipose and insulin biology to body fat distribution. Nature. 2015; 518(7538):187–96. Epub 2015/02/13. PubMed Central PMCID: PMC4338562. doi:10.1038/nature14132PMID:25673412
34. Verhaaren BF, Debette S, Bis JC, Smith JA, Ikram MK, Adams HH, et al. Multi-Ethnic Genome-Wide Association Study of Cerebral White Matter Hyperintensities on MRI. Circ Cardiovasc Genet. 2015. Epub 2015/02/11.
35. Geller F, Feenstra B, Carstensen L, Pers TH, van Rooij IA, Korberg IB, et al. Genome-wide association analyses identify variants in developmental genes associated with hypospadias. Nat Genet. 2014; 46 (9):957–63. Epub 2014/08/12. doi:10.1038/ng.3063PMID:25108383
36. Feenstra B, Pasternak B, Geller F, Carstensen L, Wang T, Huang F, et al. Common variants associated with general and MMR vaccine-related febrile seizures. Nat Genet. 2014; 46(12):1274–82. Epub 2014/ 10/27. PubMed Central PMCID: PMC4244308. doi:10.1038/ng.3129PMID:25344690
37. Germain M, Chasman DI, de Haan H, Tang W, Lindstrom S, Weng LC, et al. Meta-analysis of 65,734 Individuals Identifies TSPAN15 and SLC44A2 as Two Susceptibility Loci for Venous Thromboembo-lism. Am J Hum Genet. 2015; 96(4):532–42. Epub 2015/03/17. PubMed Central PMCID:
PMC4385184. doi:10.1016/j.ajhg.2015.01.019PMID:25772935
38. Surakka I, Horikoshi M, Magi R, Sarin AP, Mahajan A, Lagou V, et al. The impact of low-frequency and rare variants on lipid levels. Nat Genet. 2015.
39. Horikoshi M, Mgi R, van de Bunt M, Surakka I, Sarin AP, Mahajan A, et al. Discovery and Fine-Mapping of Glycaemic and Obesity-Related Trait Loci Using High-Density Imputation. PLoS Genet. 2015; 11(7): e1005230. Epub 2015/07/02. PubMed Central PMCID: PMC4488845. doi:10.1371/journal.pgen. 1005230PMID:26132169
40. Nikpay M, Goel A, Won HH, Hall LM, Willenborg C, Kanoni S, et al. A comprehensive 1,000 Genomes-based genome-wide association meta-analysis of coronary artery disease. Nat Genet. 2015; 47 (10):1121–30. PubMed Central PMCID: PMCPMC4589895. doi:10.1038/ng.3396PMID:26343387
41. Panagiotou OA, Evangelou E, Ioannidis JP. Genome-wide significant associations for variants with minor allele frequency of 5% or less—an overview: A HuGE review. Am J Epidemiol. 2010; 172(8):869– 89. Epub 2010/09/30. doi:10.1093/aje/kwq234PMID:20876667
42. de Vries PS, Boender J, Sonneveld MA, Rivadeneira F, Ikram MA, Rottensteiner H, et al. Genetic vari-ants in the ADAMTS13 and SUPT3H genes are associated with ADAMTS13 activity. Blood. 2015; 125 (25):3949–55. doi:10.1182/blood-2015-02-629865PMID:25934476
43. Huffman JE, de Vries PS, Morrison AC, Sabater-Lleal M, Kacprowski T, Auer PL, et al. Rare and low-frequency variants and their association with plasma levels of fibrinogen, FVII, FVIII, and vWF. Blood. 2015. Epub 2015/06/25.
44. de Vries PS, Chasman DI, Sabater-Lleal M, Chen MH, Huffman JE, Steri M, et al. A meta-analysis of 120,246 individuals identifies 18 new loci for fibrinogen concentration. Hum Mol Genet. 2015. Epub 2015/11/13.
45. Abecasis G, Natarajan P, Peloso G, Lee S, NHLBI Trans-Omics for Precision Medicine and TOPMed Anthropometry and Lipids Working Groups. TOPMed: Early insights from sequencing and analysis of 45,934 deep human genomes. 66th Annual Meeting of The American Society of Human Genetics; Vancouver2016.