Do tourists value different cycling infrastructure?
Gerard Deenihan Trinity College Dublin
Brian Caulfield Trinity College Dublin
Abstract
This paper seeks to examine how tourists value different types of cycling infrastructure. An intercept stated preference survey that was carried out amongst tourists in Dublin, was conducted to answer this question. The attributes used in the stated preference scenarios were time, facility type, weather, and route gradient and a nested logit model was created to analyse the data.
It was found that a tourist is willing to increase their cycling time by approximately 100% in order to cycle upon a fully segregated from traffic cycling facility rather than along a road without cycling infrastructure, and are willing to increase their time by 40-50% to be able to cycle along a road with a cycle lane rather than a road without cycling facilities. Younger, male tourists, who own one or more bikes are more likely to choose a road without cycling facilities, while older, female tourists, who do not own any bikes, are more likely to choose a road with cycle lanes or a segregated from traffic cycling facility.
Presently, research into cycling and tourism has not been overly developed. In recent years, there has been an increased focus on research into this area. The research that presently exists is aligned more towards large scale events such as the Tour de France, and adventure tourism in general. This paper casts a light onto the area of cycling for tourist purposes and develops a value based system that can be used in the planning of cycling infrastructure in tourist locations and rural areas.
Introduction
Presently cycling in Ireland is undergoing a renaissance. Between 2006 and 2011, cycling in Ireland’s capital, Dublin has increased by 45% (Dublin City Council, 2012). This large scale increase has been replicated nationwide with an increase in cycling of 15% (Central Statistics Office, 2012). This has led to an increased focus on cycling for commuting, leisure and tourist purposes at both local and national levels. In the past, the area of cycle tourism in Ireland received very little attention, however, in recent times the importance of this sector of the tourism market has become apparent. In 2009, it was estimated that cycling tourists
spent €97 million while in Ireland (Fáilte Ireland, 2009). The majority of the cyclists that were
surveyed were just satisfied with cycling in Ireland, however; 12% of those surveyed were either dissatisfied or very dissatisfied.
In 2009, Ireland’s first National Cycling Policy Framework was adopted. The specific objectives were to promote the development of walking and cycling in Ireland. One objective
was to “Provide designated rural signed cycle networks providing especially for visitors and
recreational cycling” (Smarter Travel Office, 2009). From this Framework, the National Cycle Network Scoping study was created (National Roads Authority, Ireland (2010). The document outlined some 2,000 kilometres of corridors along which high quality cycling facilities were to be constructed. One such project is the Great Western Greenway in the north west of Ireland. The first phase of this project, an 18 km route from Newport to Mulranny was opened in April 2010. This phase was a “huge success” (Fáilte Ireland,
Smarter Travel Office 2010) and a €3.5 million package was agreed to expand the route to
42 km. The 42 km route is currently the longest off-road cycling and walking trail in the republic of Ireland. Deenihan et al (2013) estimated that this section of cycleway has a payback period of 6 years. Given the success of this infrastructural facility has led to many other potential facilities to be considered for construction. Most of these proposals are along disused railway lines and canal towpaths.
the areas. Lamont (2009) claims that there has been relationship between cycling and tourism since the 1890s, but it is only in recent years that these areas are being researched academically. It is important that research be carried out in these areas, as a lack of knowledge leads to misleading conclusions when categories of tourists are not defined properly. This can cause falsification, exaggeration, and an understatement of facts when it comes to the analysis of certain cycling groups. Burkart and Medlik (1981) also state why it’s important that research into tourism be carried out. It is necessary for three specific reasons. They are as follows:
• To evaluate the value and significance of tourism to a particular area
• To use in the design and planning of infrastructure and service for tourists
• To plan and create effective marketing campaigns
The Irish National Cycle Network, identifies the corridors along which cycling infrastructure should proceed. In many cases, there are several options along which these routes could be constructed. There is an extensive disused rail network in Ireland, along with many disused canals and their towpaths. In the past decade there has also been a relatively large extensive motorway construction programme which has led to many previously wide national roads with hard shoulders reverting to local and regional use. In order for the correct routes to be selected, it is crucial that the attitudes and perceptions of the potential users of these facilities be fully understood. One significant user group are tourists. The research presented in this paper examines the preferences of tourists for different standards of cycling infrastructure. The results were retrieved from analysis on a stated preference intercept survey carried out among tourists in the summer of 2012. One section of the intercept survey presented the tourists with various scenarios. In these scenarios the respondent was presented with different standards of cycling infrastructure that contained individual conditions for each piece of infrastructure. The respondent then selected their preferred option. Analysis was performed on these choices and is presented later in this text. The respondents’ demographic information was also noted in the survey. It was also analysed whether people’s choices and preferences alter between demographic categories.
Methodology
Having identified studies that completed similar analysis in the literature review (Reilly et al (2010), Downward et al (2009), Caulfield et al (2012), it became apparent that a discrete choice survey was required. Discrete choice explains and allows choices to be predicted when presented with a series of alternatives. This usually translates into a range of scenarios presented to a respondent with several options. The respondent is then requested to pick one of the presented options. Louvierre et al (2000) provides a clear description of the theory that underlies discrete choice models. As mentioned in the literature review the fractional factorial design is a very effective way of designing scenarios for a survey. Louviere et al (2000) and Hensher et al (2005) develop the factorial design process very comprehensively. The process for designing the fractional factorial design that is to be used in the development of the scenarios for the survey is split into five stages.
Stage 1: Problem definition refinement
The initial “problem” that needed to be solved was whether tourists would be willing to sacrifice time, comfort and energy in order to travel upon perceived safer cycling infrastructure. There are models that have been used to evaluate similar questions for cycling for commuting purposes (Caulfield et al (2012), Stinson and Bhat (2004), Stinson and Bhat (2003)). However, to the best of the author’s knowledge, no research has been conducted to model to access cycling for touristic and leisure purposes. From this point it was fundamental to determine the key attributes that could be used in the evaluation of this. These attributes were identified from studies completed around the world and were compiled into a list of the ten most relevant attributes (Stinson and Bhat (2003), Caulfield et al (2012), Morris (2004), Downward et al (2009)), which are as follows:
• Vehicle Parking
• Directness
• Comfort
• Weather
• Type of Facility
• Ancillary Facilities
• Time
• Cost
• Route Slope
• Route Length
Stage 2: Stimuli refinement
Bhat (2003), Caulfield et al (2012), Morris (2004), Downward et al (2009)), and investigating the potential infrastructure, it was decided that the attributes to be included in the scenarios would be:
• Type of facility • Time • Weather • Route Slope
Cost and route length were omitted from the scenarios as cost, time and route length would be highly correlated. This is because these attributes are intrinsically connected. For example, as the route length increases, so too would the time and cost. It was decided that time would be used as it can act as a proxy for both route length and cost. As the fundamental attributes that are to be included in the scenarios are identified, the attribute levels need to be decided.
Stage 3: Experimental design considerations
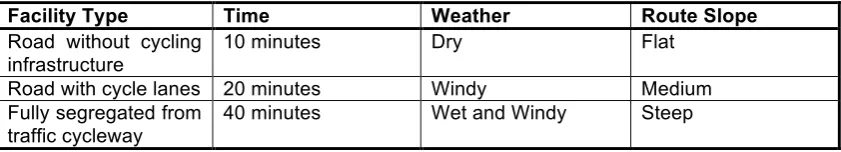
[image:3.595.110.531.285.361.2]From reviewing similar literature on cycling (Stinson and Bhat (2003), Caulfield et al (2012), Morris (2004), Downward et al (2009)), it was deduced that there would be three attribute levels per attribute. The attribute levels were selected to reflect the times, and facility options that would be potentially encountered by the respondents in these areas. The attribute levels can be seen in Table 1.
Table 1 Attributes and Attribute Levels
Facility Type Time Weather Route Slope
Road without cycling infrastructure
10 minutes Dry Flat
Road with cycle lanes 20 minutes Windy Medium
Fully segregated from traffic cycleway
40 minutes Wet and Windy Steep
From Louvierre et al (2000), it is known that a full factorial design would not be practical in designing the scenarios section of the proposed survey. If a full factorial were to be used with the attributes and the attribute levels outlined in Stage 2, there would be in total 19,683 combinations. As one would expect, this would prove very unrealistic to get a respondent to the survey to complete all the combinations. Therefore, a fractional factorial design was used.
If one were to select randomly different combinations, it would most likely produce a sub-optimal or statistically inefficient design. If one produces an orthogonal design from the combinations, this will allow for a more optimal and efficient design.
Stage 4: Generating experimental designs
It was decided that main effects and two way interactions should be included in the design of the survey. Hensher et al (2005) specify exactly how an orthogonal design is produced in SPSS. This process was followed and produced an orthogonal design with 32 different combinations. A “blocking variable” was included in the formation of the orthogonal design. This was included in the design in order to reduce the choice sets each decision maker would be presented with. This allowed the different combinations of the scenarios to be placed into eight groups of four scenarios.
Stage 5: Allocating attributes to design columns – The Survey
At this point, the basic skeleton for the scenarios has been formed. Each individual scenario could now be formed and organised into one of the eight blocks. Each block would represent one version of the survey and contain four scenarios. This ensured that the survey could be completed quickly and without inducing respondent fatigue. Having formed the scenarios, the focus could move onto developing the rest of the survey. The survey was split into three sections. They were as follows:
• Section 1 – General Questions
• Section 2 – Scenarios
• Section 3 – Personal Details
Section 1 consisted of questions that focused on aspects of the tourist’s trip whilst they were in the country such as trip purpose and trip length. The tourist’s perception of cycling in Ireland was also examined by proposing questions such as, “Would improvements to cycling facilities encourage (the respondent) to visit again” and, “Whether a hotel’s proximity to a high quality cycling facility made one hotel preferable to another”.
Section 2 consisted of four scenarios. Each scenario consisted of the same three options; however the conditions that were attached to each option varied between the scenarios. The three options were as follows:
• Option 1 – Road with cycling infrastructure
• Option 2 – Road with a cycle lane
• Option 3 – A fully segregated from traffic cycling facility.
The respondent was asked to imagine that they were sightseeing in rural Ireland by bicycle and that they were travelling between two locations. They were then asked to choose between the options with the various conditions. The conditions that varied for the scenarios were time, weather and route gradient. Images accompanied the scenarios in order for the respondent to more comprehensively visualise each option presented. The respondents were presented with scenario containing images of the options along with the conditions attached to each option. The respondent then ticked which option they would prefer under the circumstances presented. It can be seen how the options were presented in Figure 2.
Option A – Road with no cycling facilities
Option B – Road with cycle lanes
Option C – Fully segregated facility
The time on this facility is 10
minutes
The time on this facility is 40
minutes
The time on this facility is 10
minutes
The weather is windy The weather is dry The weather is dry
The gradients along this facility are moderate
The gradients along this facility
are flat
The gradients along this facility
[image:4.595.66.533.321.542.2]are flat
Figure 1 Example of a Scenario Presented to the Tourists
Section 3 consisted of questions that revolved around the personal details of the respondents. The questions of gender, age, country of residence, relationship status, household income, etc., were included along with some cycling related questions. The cycling related questions were about them in their country of residence. The respondent’s confidence as a cyclist, how many bicycle their household owned, and whether they cycled for work/education or recreational purposes were enquired about. There was also a comments box at the end of the survey that allowed anything the respondent felt they needed to communicate to be noted.
Methodology for Analysis of Responses
attributes of that alternative. This is not realistic in many situations. In nested logit, the
unobserved component of utility is correlated. This allows for differential degrees of
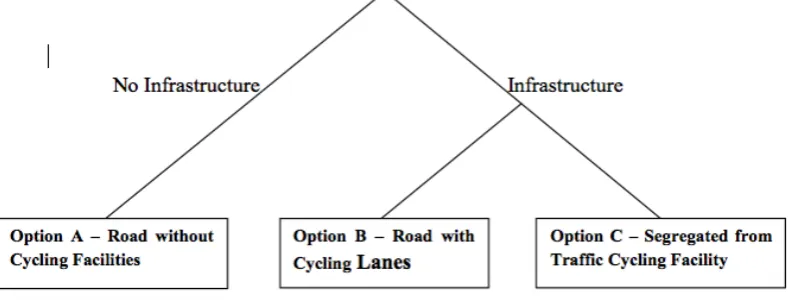
[image:5.595.118.514.151.302.2]interdependence among subsets of alternatives in a choice set. Where the multinomial model would miss correlations between alternatives, the nested model can identify these correlations. The tree structure of the nested model used in the analysis later in this paper can be viewed in Figure 3.
Figure 2 Tree Structure of the Nest Model
In order to model the data, utility functions needed to be formed and inputted into NLogit. The model takes the following functional format:
(1)
where n represents the cycle facility chosen and i the individual. Xin represents the set of
explanatory variables specific to cycling facility option n and by individual i. Uin is the utility
obtained by individual i and is a random error term, which is assumed to be identically
and independently distributed using the Gumbel distribution method (Train, 2003). The utility equation structure in Eq (1) will estimate a utility value for each of the presented route options and therefore allow the potential utility of the options to be compared. The probability that individual i chooses route n can be expressed as:
(2) Eq. 3 states that the individual will choose cycle facility n over the other cycle facility j providing the utility that’s derived from this facility is greater than the alternative facility. When performing regression analysis such as nested logit, it is important to keep the structure of the analysis as simple as possible. For the analysis performed in this paper, the weather and gradient attributes are not linear or numerically quantifiable. Therefore it was decided to simplify these variables into binary variables. Weather was simplified to if it were dry or not (Weather dry = 1 if flat, 0 if not), and gradient was simplified to whether it was flat or not (Slope Flat = 1 if flat, 0 if not). Time was a linear and numerically quantifiable attribute and therefore did not need to be simplified.
The models estimated in the analysis section of this paper use a maximum likelihood estimation approach. The models were divided to provide an insight as to how the various attributes of the facilities and how various personal characteristics of the respondents affect
choices. From for each of the options with the value of time known from the National
Roads Authority (Ireland) (2011), the “Willingness to Pay” for the different standards of facility can be assessed.
Algers et al (1998) and Hensher et al (2005) estimate the value of time by dividing the estimated marginal utility of time with the estimated value of cost. The formula can be seen in Eq. 3.
(3)
From the estimates in Table 6, it can be seen that has been estimated for the three
facility. This allows the “Willingness to Pay” for each option to be calculated. By using “Option A - Road without cycling facilities” as our reference category, we can determine ratio for the other two options. The willingness to pay for each facility then can be estimated by multiplying the ratios between Option A and the other options, by the original value of time. By multiplying these two together, the amount a person would be willing to sacrifice in order to travel upon the options can be quantified.
Data Collection
The intercept stated preference survey was undertaken in the summer of 2012. The intercepts occurred at two locations in Dublin City, Ireland. The first location was adjacent to the Trinity Walking Tours Kiosk in Trinity College Dublin. The second location was adjacent to an adventure tour company kiosk in a hostel in Dublin city centre. Dublin city was a very suitable location for these intercept surveys as the city contains six out of the ten most popular fee paying visitor attractions and nine out of the ten most popular free tourist attractions in Ireland. Trinity College is currently also in the top five tourist attractions in the country and the hostel was opposite another of the top tourist attractions in the country (Failte Ireland (2012)). These two locations allowed for a large representative sample of tourists to be retrieved from the intercept surveys. The survey was also translated into German, French and Spanish. In total there were 282 valid responses to the surveys which were approximately 35 responses per version of the survey. There were another five surveys that were invalid where sections were either incomplete or skipped by the respondent. From the Central Statistics Office (Ireland) (2013) it is known that Ireland had 6.6 million visits by overseas residents.
ANALYSIS
With a 5% margin for error, the sample size would need to be 271 in order to have a 90% confidence level. With 282 valid responses, and a 90% confidence level, the margin for error is 4.9%. From the literature review, it was seen that the sample sizes for similar stated preference surveys from around the world varied from 88 to 1872 responses. A response level of approximately 300 was deemed to be sufficient in estimating results and conclusions.
In Table 2 contains the demographic results of the respondents. The gender is skewed slightly as there were more female respondents than male. The age category of 12-24 years has the largest percentage of responses. This could be attributed to some of the surveys being undertaken in a hostel (most likely due to the average age of guests in a hostel being lower than the average age of tourists visiting the country). Other than these three areas, all other personal questions had a reasonable and expected spread of responses. The actual numbers and their percentage of the total responses can be observed in Table 2.
Table 2 Personal Information of Respondents
Gender Numbers Percentage
Male 112 39
Female 169 59
No response 6 2
Total 287 100
Age
12-24 114 40
25-34 68 24
35-44 21 7
45-54 35 12
55-64 29 10
65+ 13 5
No response 7 2
Total 287 100
Where from?
Great Britain 16 6
Other Europe 136 47
USA and Canada 86 30
Other areas 43 15
No response 6 2
Total 287 100
In your country of residence, do you cycle for: (a.) Work/Education purposes?
Yes 92 32
No 151 53
No response 44 15
Total 287 100
(b.) Recreational purposes?
Yes 201 70
No 59 21
No response 27 9
Total 287 100
Bikes in Household
Zero 34 12
One 54 19
Two 73 25
Three or more 87 30
No response 39 14
Table 3 Results and percentages from Questions posed in Section 1 of the Tourist Intercept Survey completed in the summer of 2012
Main reason for this Visit? Numbers Percentage
Holiday/Recreation 244 85
Business 4 1
Visiting friends/relatives 11 4
Mix 17 6
Other (please specify) 10 4
No response 1 0
Total 287 100
Trip Length
Less than 5 days 70 24
5 to 8 days 53 18
9 to 12 days 85 30
More than 12 days 69 24
No response 10 4
Total 287 100
Cycled while in Ireland?
Yes 56 20
No 225 78
No response 6 2
Total 287 100
Recommend Ireland from your experience of cycling?
Yes 85 30
No 51 18
No response 151 53
Total 287 100
Improvements to cycling facilities encourage you to visit again?
Yes 100 35
No 48 17
No response 139 48
Total 287 100
If where you are staying there was a high quality Greenway would you use the it?
Yes 207 72
No 14 5
No response 66 23
Total 287 100
Choose a hotel near a high quality Greenway/cycle path over a hotel that is not?
Yes 181 63
No 52 18
No response 54 19
Total 287 100
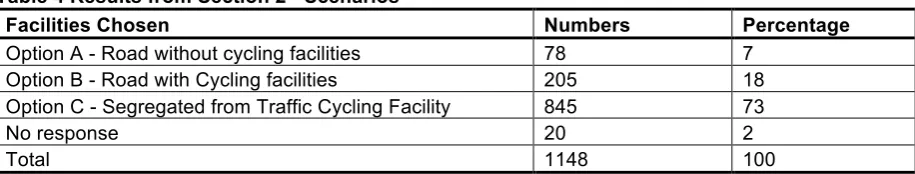
[image:8.595.72.526.123.635.2]chosen and time, weather, and route slope is further developed in the next part of this paper. Table 4 outlines the numbers and percentage from the scenarios section.
Table 4 Results from Section 2 - Scenarios
Facilities Chosen Numbers Percentage
Option A - Road without cycling facilities 78 7
Option B - Road with Cycling facilities 205 18
Option C - Segregated from Traffic Cycling Facility 845 73
No response 20 2
Total 1148 100
Stated Preference Analysis
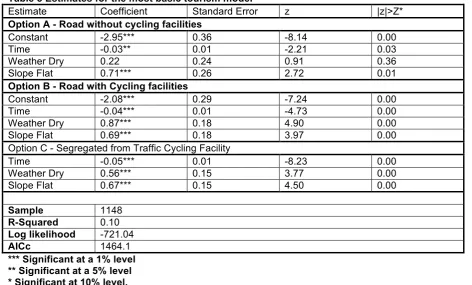
As seen in Table 4, the choices for the scenarios are known along with the conditions attached to each scenario. This data is inputted into NLogit along with the utility functions from Equations 1,2 and 3. Nested logit analysis was performed on the data and functions, and resulted in Table 6. NLogit estimates the coefficients for the constants and parameters. The results in Table 5 show that all the estimates except one had good significance in this model. Only the weather parameter for “Option A – Road without Cycling Facilities” was found not to be significant. This could be due to people choosing a road without cycling facilities only if time is an issue and weather is not an overly influential factor. The coefficients are the beta value estimates for the utility functions specified in the methodology sections. The standard error is the standard deviation for the estimates. The Z score is the number of standard deviations by which the estimates for the coefficients differ from the mean. |z|>Z* indicates the significance. The results from Table 5 make intuitive sense with all the beta coefficients being negative for time, and positive for both weather and slope. This implies that for all options, as time increases for an option, respondents are less likely to choose that option and the more flat and the better the weather is for an option, the more likely that respondent will choose that facility. The Log-Likelihood (LL) value for this model is -721.04 The model tested is better than a constants only model as the LL value for a constants only model was -803.44473. The r-squared value to the model in Table 5 was 0.1026. This r-squared value is reasonable for the model, however this model is the most simple of the models tested and therefore will be improved upon in the next model. The Akaike Information Criterion coefficient (AICc) is the measure of the relative quality of the model. The AICc for this model is 1464.1.
From Table 5, it can be seen that when all else is held equal, the time coefficients for Option A is approximately half of the time coefficient for Option C. This implies that a tourist would be willing to increase their time approximately by 100% in order to travel upon a perceived to be safer segregated from traffic cycling facility rather than upon a road without any cycling infrastructure. The time coefficient for Option A is approximately 60% of the time coefficient for Option B. This implies that a tourist would be willing to increase their travel time approximately 40% in order to travel along a road with a cycle lane rather than upon a road without any cycling infrastructure.
It can seen how weather impacts choices. Dry weather has the biggest impact on Option B, this is followed by Option C. This implies that dry weather would be mostly the reason why a respondent would choose Option B, whereas dry weather would seemingly not be an overly controlling factor when choosing Option C. This is most likely due to tourists willing to persevere through inclement weather (sacrifice some comfort) in order to travel upon the segregated from traffic cycling facility. The dry weather coefficient is lowest for Option A, implying that it is not an overly influential factor relative to the other options, in the decision to choose Option A. This infers that tourists would mostly select a road without cycling infrastructure when time and the route gradient are the main issues.
Table 5 Estimates for the most basic tourism model
Estimate Coefficient Standard Error z |z|>Z*
Option A - Road without cycling facilities
Constant -2.95*** 0.36 -8.14 0.00
Time -0.03** 0.01 -2.21 0.03
Weather Dry 0.22 0.24 0.91 0.36
Slope Flat 0.71*** 0.26 2.72 0.01
Option B - Road with Cycling facilities
Constant -2.08*** 0.29 -7.24 0.00
Time -0.04*** 0.01 -4.73 0.00
Weather Dry 0.87*** 0.18 4.90 0.00
Slope Flat 0.69*** 0.18 3.97 0.00
Option C - Segregated from Traffic Cycling Facility
Time -0.05*** 0.01 -8.23 0.00
Weather Dry 0.56*** 0.15 3.77 0.00
Slope Flat 0.67*** 0.15 4.50 0.00
Sample 1148
R-Squared 0.10
Log likelihood -721.04
AICc 1464.1
*** Significant at a 1% level ** Significant at a 5% level * Significant at 10% level.
Conclusions
As mentioned previously, research into cycling and tourism has not been overly developed. In recent years, there has been an increased focus on research into this area. The research that presently exists is aligned more towards large scale events such as the Tour de France and the Olympics, and adventure tourism in general. This paper casts a light onto the area of cycling for tourist purposes and develops a value based system that can be used in the planning of cycling infrastructure in tourist locations and rural areas.
References
Burkart, A. and Medlik, S. (1981) Tourism: Past, Present, and Future. Heinemenn, London.
Central Statistics Office, Ireland (2012) POWCAR. Central Statistics Office, Skehard Road, Cork, Ireland..
Central Statistics Office, Ireland (2013) Tourism and Travel. Central Statistics Office, Skehard Road, Cork, Ireland.
Deenihan, G., Caulfield, B., O'Dwyer, D., Measuring the success of the Great Western Greenway in Ireland. Tourism Management Perspectives, 2013.
Downward, P., Lumsdon, L., Weston, R. (2009) Visitor Expenditure: The case of Cycle Recreation and Tourism. In Journal of Sustainable Tourism, 14:1, 25-42.
Fáilte Ireland (2009) A Strategy for the Development of Irish Cycle Tourism, Conclusions Report. Department of Transport, Tourism and Sport.
Fáilte Ireland (2012) Tourism Facts 2011. Department of Transport, Tourism and Sport.
Failte Ireland and Smarter Travel Office (2010) €3.5m announced to finish Great Western
Lamont, M.J. (2009). Reinventing the Wheel: A definitional Discussion of Bicycle Tourism. Journal of Sports and Tourism 14:1, 5 – 23.
Morris, H. (2004) Commute Rate on Urban Trails: Indicators From the 2000 Census. In Transportation Research Record: Journal of the Transportation Research Board, No. 256, Transportation Research Board of the National Academies, Washington, D.C., 2004, pp 116 – 121.
Louviere, J., Hensher, D., Swait, J. (2000) Stated Choice Methods. Analysis and Application. Cambridge Univeristy Press, Cambridge.
National Roads Authority (2011) Project Appraisal Guidelines. Unit 13.0 Walking and Cycling Facilities. Department of Transport, Tourism and Sport.
Reilly, J., Williams, P., Haider, W. (2010) Moving towards more eco-efficient tourist transportation to a resort destination: The case of Whistler, British Columbia. In Research in Transportation Economics, 26:1, 66 – 73.
Smarter Travel Office (2009) Ireland’s First National Cycle Policy Framework. Department of Transport, Tourism and Sport.
Stinson, M.A., and Bhat, C. (2004) An Analysis of the Frequency of Bicycle Commuting Using an Internet Based Survey. In Transportation Research Record: Journal of the Transportation Research Board, No. 1493, Transportation Research Board of the National Academies, Washington, D.C., 2004, pp 122 -130.
Stinson, M.A. and Bhat, Chandra (2003) An Analysis of Commuter Bicyclist Route Choice Using a Stated Preference Survey. In Transportation Research Record: Journal of the Transportation Research Board, No. 1301, Transportation Research Board of the National Academies, Washington, D.C., 2003, pp 107 – 115.