V
i vapour-phase fugacity coefRcient for componenti
i activity coefRcient for componenti
See Colour Plate 5.
Further Reading
Geankoplis CJ (1993)Transport Processes and Unit Op-erations. New Jersey: PTR Prentice Hall.
King CJ (1980)Separation Processes. New York: McGraw-Hill.
Kister HZ (1992) Distillation Design. New York: McGraw-Hill.
Seader JD and Henley EJ (1998)Separation Process Prin-ciples. New York: John Wiley.
Stichlmair JG and Fair JR (1998)Distillation Principles and Practice. New York: Wiley-VCH.
ELECTROPHORESIS
D. Perrett, St Bartholomew’s and the Royal London School of Medicine and Dentistry,
St Bartholomew’s Hospital, London, UK
Copyright^ 2000 Academic Press
An Outline of the Historical
Background to Electrophoretic
Separations
The movement of charged particles under the inS u-ence of an electricReld was observed as long ago as 1807 by Ferdinand Frederic Reuss. In 1909, the term, electrophoresis, was introduced by Michaelis as a de-scription of this phenomenon and is derived from the Greek word elektron meaning amber (i.e. electric) and phoremeaning bearer. Yet it was not until the 1930s that electrophoresis, as we know it today, developed from the work of Tiselius, who, in 1948, was awarded the Nobel Prize for this development. Table 1charts the development of the technique over the last century. By the 1950s electrophoresis was a common laboratory technique equivalent in useful-ness to planar chromatography techniques such as paper and thin layer. However, with the advent of high-performance liquid chromatography (HPLC) in the 1970s, analytical electrophoresis became some-thing of a ‘Cinderella’ technique. Only in biochemical and clinical laboratories did electrophoresis continue in use as a qualitative separation technique for mac-romolecules, such as proteins and DNA.
It has been claimed that currently at least half of all separations are performed by electrophoresis since separations of blood proteins and DNA digests are routinely performed by the technique. The technique is now so routine in biomedicine and related disci-plines that it is rarely referred to in the abstracts and titles of papers where it is a core technology, for example DNA sequencing. Even so, it is mentioned by name in almost as many papers as is chromatogra-phy (Table 2). However, with the development of
capillary electrophoresis after 1981 electrophoresis has returned as a substantial topic of interest to main-stream analytical chemistry.
Fundamentals of Electrophoresis
Unlike chromatography, there is no formal Interna-tional Union of Pure and Applied Chemistry (IUPAC) deRnition of electrophoresis, although one is being developed at the time of writing. However, through teaching the subject over the past 10 years, I have developed the following deRnition:
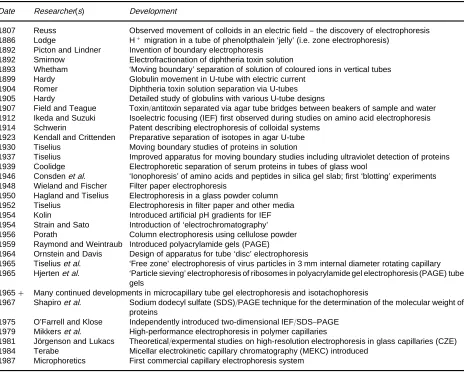
‘Electrophoresis is a mainly analytical method in which separations are based on the differing mobilities (i.e. speed plus direction of movement) of two or more charged analytes (ionic com-pounds) or particles held in a conducting medium under the inSuence of an applied direct current electricReld’ (Figure 1).
Electrophoresis therefore contrasts to chromatog-raphy which is deRned as a method used primarily for the separation of two or more components of a mix-ture, in which the components are distributed be-tween two phases, one of which is stationary while the other moves. Another difference is that in chromatography the modelling of the separation from Rrst principles is complex, difRcult and im-precise whereas a relatively simple theoretical back-ground to electrophoresis has been developed and is reproduced below. For a more complete discussion of electrophoretic theory see Mosheret al. (1992).
Table 1 An outline history of electrophoresis Date Researcher(s) Development
1807 Reuss Observed movement of colloids in an electric field}the discovery of electrophoresis 1886 Lodge H#migration in a tube of phenolpthalein ‘jelly’ (i.e. zone electrophoresis)
1892 Picton and Lindner Invention of boundary electrophoresis 1892 Smirnow Electrofractionation of diphtheria toxin solution
1893 Whetham ‘Moving boundary’ separation of solution of coloured ions in vertical tubes 1899 Hardy Globulin movement in U-tube with electric current
1904 Romer Diphtheria toxin solution separation via U-tubes 1905 Hardy Detailed study of globulins with various U-tube designs
1907 Field and Teague Toxin/antitoxin separated via agar tube bridges between beakers of sample and water 1912 Ikeda and Suzuki Isoelectric focusing (IEF) first observed during studies on amino acid electrophoresis 1914 Schwerin Patent describing electrophoresis of colloidal systems
1923 Kendall and Crittenden Preparative separation of isotopes in agar U-tube 1930 Tiselius Moving boundary studies of proteins in solution
1937 Tiselius Improved apparatus for moving boundary studies including ultraviolet detection of proteins 1939 Coolidge Electrophoretic separation of serum proteins in tubes of glass wool
1946 Consdenet al. ‘Ionophoresis’ of amino acids and peptides in silica gel slab; first ‘blotting’ experiments 1948 Wieland and Fischer Filter paper electrophoresis
1950 Hagland and Tiselius Electrophoresis in a glass powder column 1952 Tiselius Electrophoresis in filter paper and other media 1954 Kolin Introduced artificial pH gradients for IEF 1954 Strain and Sato Introduction of ‘electrochromatography’ 1956 Porath Column electrophoresis using cellulose powder 1959 Raymond and Weintraub Introduced polyacrylamide gels (PAGE)
1964 Ornstein and Davis Design of apparatus for tube ‘disc’ electrophoresis
1965 Tiseliuset al. ‘Free zone’ electrophoresis of virus particles in 3 mm internal diameter rotating capillary 1965 Hjertenet al. ‘Particle sieving’ electrophoresis of ribosomes in polyacrylamide gel electrophoresis (PAGE) tube
gels
1965# Many continued developments in microcapillary tube gel electrophoresis and isotachophoresis
1967 Shapiroet al. Sodium dodecyl sulfate (SDS)/PAGE technique for the determination of the molecular weight of proteins
1975 O’Farrell and Klose Independently introduced two-dimensional IEF/SDS}PAGE 1979 Mikkerset al. High-performance electrophoresis in polymer capillaries
1981 JoKrgenson and Lukacs Theoretical/expermental studies on high-resolution electrophoresis in glass capillaries (CZE) 1984 Terabe Micellar electrokinetic capillary chromatography (MEKC) introduced
1987 Microphoretics First commercial capillary electrophoresis system
Table 2 Separation techniques in biomedicine and related areas
Separation mode Type Total number of papers Electrophoresis All modes 150 000
Simple planar 13 800 Sodium dodecyl sulfate}polyacrylamide gel electrophoresis (SDS}PAGE) 78 000
Immuno 19 700
Isoelectric focusing 14 400 Pulsed field 1 600 Two-dimensional PAGE 4 800 Capillary electrophoresis 6 700 Chromatography All modes 250 000
Planar 52 000
Column 98 000
High-performance liquid chromatography 62 500 Gas chromatography 32 000 Papers in Medline and on the author’s database from 1976 to 1999.
may diffuse from the load position or be carried by electroosmoticSow.
The rate of migration (velocity) of any charged particle in an electric Reld can, at its simplest, be
[image:2.568.50.518.536.699.2]Figure 1 The basic principle of all electrophoretic separations is that charged ions attempt to move in an electric field towards the electrode of opposite polarity. Neutral compounds do not move.
Figure 2 A vector diagram for movement in an electric field at equilibrium.
under appropriate conditions. In simple solutions, ions will move freely toward the electrode of opposite charge and the product of the charge on the ion and the applied electric Reld (E) gives the electric force experienced by the ion. However, since even a simple ion can be considered as a particle this movement is opposed by a frictional drag given by Stokes’ law.
The driving force is represented by the potential gradient along which the charged particle moves and is given by the electricReld strength (E):
E" applied voltage
distance between electrodes" V
D [1]
The appliedReld (Fef):
Fef"qE [2]
whereqis the total charge on the ion. The friction (Ffr) drag is given by:
Ffr"6rv [3]
whereis the viscosity of the media,ris the ‘radius’ of the molecule andvis the velocity.
On applying a voltage there is a rapid acceleration of all the molecules and equilibrium is achieved in a few microseconds. A vector diagram at equilibrium for movement in an electricReld is shown inFigure 2, and under such circumstances the following equilib-rium conditions apply:
E at equilibrium:
Fef"Ffr [4]
E therefore:
qE"6rv [5]
E so the velocity is given by:
v"qE
6r [6]
Mobility () is deRned as the average velocity with which an ion moves under unit applied electricReld under deRned conditions:
"average migration velocityelectric field strength "Ev [7]
Substituting forvfrom eqn [3]:
"6q
r [8]
Mobility can therefore be interpreted as propor-tional to a charge-to-size ratio for a molecule in a given buffer at a set pH. Absolute mobility is the apparent or measured mobility corrected by any other effects adding to or subtracting from the absolute mobility (an example is electroosmotic drift). Sometimes, the term relative mobility is used when the apparent mobility of one compound is calculated in relation to another compound.
The units of are cm s\1divided by V cm\1and are therefore cm2V\1s\1. The magnitude of for typical small ions is of the order of 10\6cm2V\1s\1, e.g. for the sodium ion,"5;10\6cm2V\1s\1or for the protein albumin,"!1.5;10\4cm2V\1s\1. Note the difference in the sign of the mobility and hence the direction of movement.
A small, highly charged species, for example, an ion, will have a high mobility and a large ionizable compound, such as a protein, will have a low mobil-ity. It is clear that electrophoresis can readily separate large and small ionic species. Then, for two or more closely related ionic species, if the basic descriptors used in eqn [6] are known, it should be a simple matter to calculate the separation conditions and the degree of resolution that can be achieved. The charge on an ionizable molecule, such as an amino acid, is determined by the pH of the electrophoretic medium. The viscosity of the medium at a given temperature will also be known precisely. The difRculty from a theoretical predictive standpoint is to determine the radius of a molecule. Many attempts have been made to calculate this value from Rrst principles and these are discussed later. It is also clear that the distance moved is proportional to the applied voltage and the time period over which the voltage is applied.
Figure 3 (See Colour Plate 6) The principle of moving bound-ary electrophoresis.
due to simple frictional drag but can also include effects such as:
E size and shape of the molecule; E electrolyte concentration; E solubility;
E adsorption to surfaces;
E complexation with species in the electrolyte solu-tion.
The two basic electrical equations that govern elec-trophoresis are Rrst Ohm’s law which states that
V"iR, whereiis the current andRis the resistance.
Secondly, power, that is the product of current and voltage or, alternatively, the heat generated is given
by i2R"W where W is power measured in watts.
This heating effect is termed Joule heating. The quantity of heat generated is, of course, time depen-dent. The development of heat and then temperature gradients in electrophoresis leads to:
E convection currents;
E diffusional/thermal broadening; E evaporation;
E viscosity changes; E pH variations;
E thermal degradation of analytes especially proteins and matrices.
These changes all result in band broadening and the lower resolution of separated analytes. Heat can also lead to gels drying, buffers boiling and in extreme situations evenRres.
The effect of heating processes on elec-trophoretic separations is complex and often vari-able. Traditionally, workers have countered these effects by using buffers that generate low currents, for example dilute buffer solutions, low conductivity buffers, by operating at low volt-ages (100}500 V), operating in constant current or constant power modes and, of course, using external cooling systems, such as circulating cold water around the instrument.
Electroendosmosis
The second important effect in electrophoresis is electroosmotic Sow (EOF) or electroendosmosis. If ionized groups cannot migrate in an electrical Reld (e.g. when part of a static support medium) then the liquid adjacent must move in order to maintain ther-modynamic equilibrium. This EOF is seen as a bulk movement of liquid over a solid surface. In the case of silica or the carboxyl residues on a sheet of paper, the water will move in the direction of the cathode with a characteristic mobility (eof) depending on pH. The
eofis related to the zeta-potential of the solid surface and the dielectric constant of the electrolyte. As with mobility of an ion,eofalso varies with the viscosity of the electrolyte. The magnitude of the EOF is pH dependent. EOF leads to diffusional broadening of separated bands in slab electrophoresis but is used to good effect in capillary electrophoresis (see later section).
The Modes of Electrophoresis
There are four fundamental modes of electrophoresis, at least, in the traditional planar formats, namely moving boundary electrophoresis, zone electrophor-esis, isoelectric focusing and isotachophoresis.
Moving Boundary Electrophoresis
This was the method that was studied by Tiselius in his detailed development of electrophoresis.
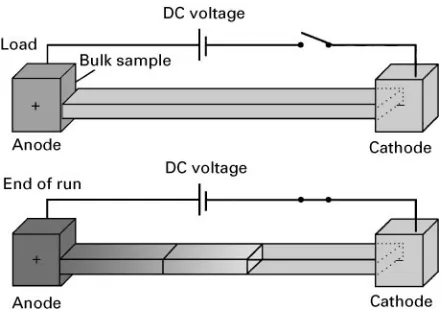
Figure 5 An example of the change in charge for a number of different peptides.䊏, AT1;䊐, AT2;䉬, AT3;䉫, AT4;䉱, AT5,䉭, AT6;
[image:5.568.79.488.449.685.2]䊉, AT7;䊊, AT9;;, AT10;;, AT11;, AT14.
Figure 4 (See Colour Plate 7) The principle of zone elec-trophoresis.
Zone Electrophoresis
This is probably the most common form of elec-trophoresis in both slab and capillary formats (see Figure 4). The sample is loaded as a discrete plug or zone into a buffered electrolyte Rlled media such as a gel. The load point is somewhere between the electrodes in the middle if the charge on the analytes is not known or nearer to one than the other if the ionic nature of the analytes is known. The two elec-trode chambers and the matrix contain the same buffer. On application of the voltage, which in traditional systems is 100}500 V DC, the compo-nents of the sample migrate at different speeds and possibly in differing directions due to their differing
mobilities and their respective charges. So, after an appropriate time period, they will have separated into (hopefully) distinct zones. Turning off the volt-age terminates the separation. The degree of separ-ation will depend on the voltage applied, the distance over which the sample separates and the time as well as the nature of the analytes and the buffer. The resultant zones will most often be of a distribution that is broader than the original loading zone due to the thermal mixing and so on that will have occurred during the separation process. With few exceptions some means of revealing the zones such as staining will be necessary.
The major factor controlling the mobility of the analytes in zone electrophoresis is the pH of the buffering electrolyte. For most ionic species the buffer controls the degree of ionization via the relationship expressed in the following equation (Henderson}Hasselbach equation):
pH"pKa#log(1/!1) for anions,
!log(1/!1) for cations [9] For analytes such as peptides or proteins which con-tain a number of independently ionizable groups, the overall charge on the molecule is given by summing the contribution from each group at the pH in question:
eff"imi [10]
where mi"iof each completely ionized form and
Figure 6 (See Colour Plate 8) The principle of isoelectric focusing.
Since the mobility of an ion is a charge-to-size ratio (eqn [8]), one way to modify this for macromolecules is to change the size and shape of the molecules. For proteins this may be brought about by conRguration changes due to changes in the pH, and in the case of DNA by incorporating an intercalating agent such as ethidium bromide. It is less simple to change the size and shape of small molecules, but one possible technique is complexation. For example, sugars will complex with borate ions in borate buffers and metal ions can complex with both peptides and nucleotides.
Equation [8] also indicates that mobility is depen-dent on the frictional drag exerted by the background electrolyte; in other words its viscosity. Adding agents such as polyethylene glycol (PEG) or cellulose deriva-tives to the buffer can increase viscosity and hence change the separation achieved.
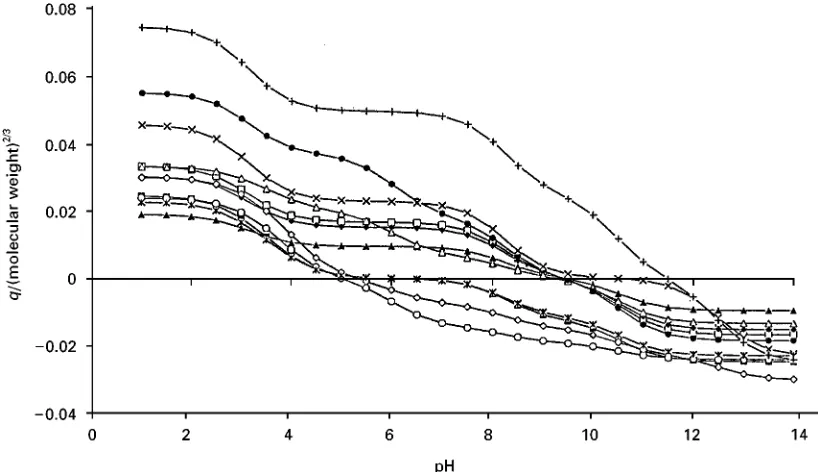
Isoelectric Focusing
Isoelectric focusing (IEF) is steady-state electrophor-esis in a pH gradient. Ionic compounds migrate to the point in the gradient where they have zero overall charge and therefore zero net mobility. For proteins this means that they migrate to their isoelectric point (PI value). The pH gradients used can be linear or nonlinear and cover either wide pH ranges, for example, 2}10 or narrow ranges ((2 pH units). The pH gradient is formed by the application of a voltage to a mixture of amphoteric compounds (ampholytes) with closely spaced pIs encompassing a chosen pH range. A mix of at least 200 individual ampholyte species is required to establish a pH gradient of 4}10. Typically, the protein mixture is mixed with am-pholytes and the resultant mixture is placed between the electrodes (Figure 6). The synthesis of such carrier ampholytes by attaching carboxylic acid moieties to polyvalent amines was perfected by Vesterberg in the
Karolinska Institute in 1964. Even theRrst applica-tion showed the remarkable resolving power of IEF when two myoglobin molecules differing in pI by only 0.05 pH units were resolved.
The resolving power of IEF is very high and is described by the following equation:
pI"
D(dpH/dx)!E(d/dpH)
[11]whereDis the diffusion coefRcient,Eis the electric Reld strength and is the mobility of the proteins. Good resolution between analytes is therefore fa-voured Rrst by low diffusion coefRcients (i.e. ideal for proteins) and a steep mobility proRle through their pI, and secondly by highReld strengths and a shallow pH gradient.
Once a protein has reached its pI position in the pH gradient, effects such as diffusion and EOF will cause some drift from the focused zone. This drift is countered by the fact that the protein will develop a small amount of ionization and migrate back to its pI position in the pH gradient and so become re-focused. Focusing takes time, depending on the voltage used and the nature of the analytes: elec-trophoresis may need several hours before a steady-state is reached. Proteins are therefore resolved into narrow concentrated bands. In fact this concen-trating effect is such that solubility problems can occur.
IEF was commercialized by LKB and the carrier ampholytes marketed under the tradename of Ampholine. The use of polyacrylamide gels was intro-duced to simplify the IEF methodologies. Although commercialized, the early ampholyte systems were in simple solution but separations tended to be irre-producible due to drifting towards the electrodes due to EOF effects. Modern IEF uses immobilized ampholytes that were developed by Righetti and co-workers in 1982. In such systems the ampholytes are immobilized to a gel matrix usually contained in a thin cylinder and so giving stable pH gradients in an easy to use format. The resolving power of these new gels with immobilized pH gradients (IPG) was much improved and permitted resolution to 0.001 pH units. More recent systems, such as the Pharmacia IPGphore, use ampholytes immobilized on Sexible plastic strips. Once focused, the strips can be easily transferred to a second dimension or even used as the target in mass spectrometry.
Isotachophoresis
Figure 7 (See Colour Plate 9) The principle of isotachophor-esis.
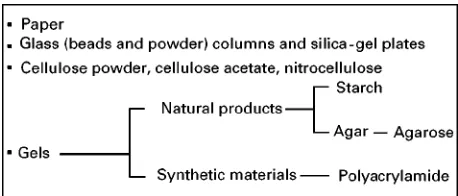
Figure 8 Common stabilized media used in electrophoresis.
using buffers of differing mobility at constant current is used. It is therefore a discontinuous system. Electrophoresis proceeds until all ionic analytes are migrating with the same (iso) speed (tacho) (Figure 7). The theory is dependent on the Kohlraush regulatory function (1897), which deRnes the condi-tions at the boundary between two different ions A and L such that
[A]"[L];a constant
For ITP to occur, an unbuffered sample should be placed between a leading electrolyte whose
buffer ionsample and a terminating electrolyte with a buffer ionsample. Leading electrolytes are usually small ions such as chloride and the terminating electrolytes are larger buffer ions such as histidine.
Applying the voltage causes the analytes to separ-ate into zones according to their mobilities, but they must remain adjacent in order for the current to be carried. From Ohm’s law all zones including the ter-minating and leading electrolytes must carry the same current so R and V must increase. When a steady-state is obtained all bands have the same ionic con-centration because they must have the sameRso they will be of differing lengths. Zones must therefore increase in concentration to match the concentration of the leading electrolyte. The resultant output is usually observed as a series of steps in a conductivity trace in which the length of each band is proportional to the amount of analyte. Since analysts are usually happier looking at peaks, these traces are often dif-ferentiated in order to generate a proRle with peaks so that the distance between the peaks can be measured. The development time is proportional to the amount of sample injected and to the differences in of the sample components.
LKB devoted considerable sums of money to devel-op a commercial ITP system (the Tachdevel-ophore) in the late 1970s but this was a commercial failure. Com-mercial systems are still available from Japan (Shimadzu) and the Czech Republic (Villa Labco). Although ITP is little used today as an analytical tool, it is commonly encountered in many zone elec-trophoresis protocols when the loading of samples in solutions differing from the BGE is recommen-ded. ITP will often occur transiently in the loading band leading to a concentration of some analytes at the front or rear of the loading band.
Electrophoretic Separation Media
Electrophoresis can be performed in free solution, but thermal and diffusional mixing are usually too great to give satisfactory resolution of the compo-nents. It has long been recognized that it is usually necessary to use some type of static support in order to contain the background electrolyte, contain the sample and limit diffusion. The primary function of the stabilized support media is to limit the disper-sion that results from convective disturbances. The stabilization should not change the mobility of the ions signiRcantly provided that neither absorption onto the support occurs nor do large analytes become physically trapped.
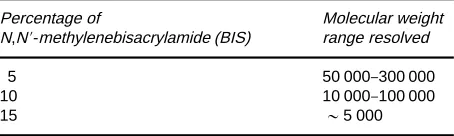
[image:7.568.289.518.595.693.2]Table 3 Effect of cross-linking on pore size of acylamide gels Percentage of
N,N-methylenebisacrylamide (BIS)
Molecular weight range resolved 5 50 000}300 000 10 10 000}100 000
15 &5 000
Slab Gel Electrophoresis
Subsequently naturally occurring gels were investi-gated particularly for the separation of plasma pro-teins. Agar gels, especially in the form of the highly puriRed subunit agarose, are still a popular medium for protein separations. Agar forms gels at relatively low concentrations, but due to its high number of sulfate and carboxylic groups it generates a signiR -cant EOF. The sulfate and carboxylic fraction can be removed chemically to leave agarose, which has much reduced EOF and gives a better resolution of proteins. The gels are formed as slabs by pouring a liquid gel into a mould and letting it set before placing in an electrophoresis system.
In 1955 Smithies, modifying an earlier method, introduced the technique of starch gel electrophoresis and its superior resolving power for proteins was immediately apparent. The starch was derived from hydrolysed potato starch and poured to a thickness of 5}10 mm. In addition, the pores in the starch gel matrix are close to the molecular size of proteins so that in this form electrophoretic movement is accom-panied by some molecular sieving, but the effect was irreproducible.
In 1955 Raymond and Weintraub introduced a synthetic polymer gel made from the monomer polyacrylamide, as a replacement for starch. Poly-acrylamide gels have many advantages over starch being tougher, more Sexible, naturally clearer and chemically inert. Acrylamide gels are formed by the polymerization of the monomer acrylamide in the presence of an N,N-methylenebisacrylamide (BIS). The reaction requires initiators and a catalyst (cross-linking reagent). Commonly used catalysts are ammonium or potassium persulfate (for chemical polymerization) or light and riboSavin (for photo-polymerization). A common initiator is N,N,N,N -tetramethylethyldiamine (TEMED). The polymeriz-ation should be performed at above 203C to prevent incomplete polymerization. The reaction takes place via vinyl polymerization and gives a randomly coiled gel structure. The concentration of polyacrylamide can be varied over a wide range without making the gels unmanageable. The pore size can also be control-led exactly by varying the amount of BIS used in the polymerization (Table 3) so the precision of the mo-lecular sieving is enhanced.
The use of such gels for electrophoresis is com-monly referred to as polyacrylamide gel electrophor-esis (PAGE). In addition to the tight control of pore size other advantages of polyacrylamide gels com-pared to starch gels are that the adsorption of macro-molecules to polyacrylamide is negligible, there is little EOF associated with polyacrylamide and strong,
but thin, transparent gels can be cast permitting faster separation. A disadvantage is that the monomers are toxic and need to be handled with caution.
Development of the gel system followed rapidly. In 1964 Ornstein and Davis simultaneously introduced discontinuous (DISC) electrophoresis, which im-proved both the solubility of the proteins in the gel as well as improving the resolution. In DISC elec-trophoresis the gel is formed in two sections, a stacking gel and a resolving gel. The resolving gel has small pores Rlled with a buffer of pH 8.8 high mobility buffer (e.g. 2-amino-2-hydroxy-methylpropane-1,3-diol}hydrochloric acid (TRIS}HCl)) and a large pore stacking gel contains a buffer of about pH 6.8. The sample is loaded at approximately pH 8.8. These conditions induce the proteins to mi-grate according to isotachophoresis through the stacking gel, then stacked at the interface with the resolving gel before slowly destacking and resolving as they pass through that gel.
The size and shape of macromolecules complicates their separation, so special buffer/electrolyte conditions are employed. Non-dissociating (native) buffer systems, as described earlier for DISC electrophoresis, are used to separate the native forms of proteins and double-stranded DNA. Dissociating (denaturing) buffer systems can also be used, for example, double-stranded DNA is denatured using urea, formamide, sodium hydroxide or intercalating agents such as ethidium bromide prior to application to the gel.
Although it is appreciated that the use of gels not only aided the electrophoretic separation, for macro-molecules it also introduced a size-sieving effect equivalent to gel Rltration in chromatography. This can be used to ‘size’ molecules, particularly proteins. So if the conditions are correct and if the pores are of the appropriate dimensions could PAGE also be used to determine the molecular weight of proteins?
Sodium Dodecyl Sulfate
+
Polyacrylamide Gel Electrophoresis
(SDS
+
PAGE)
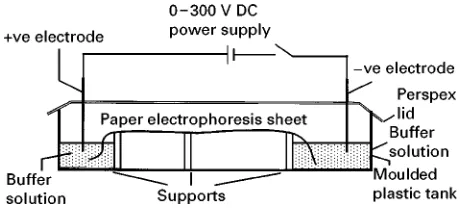
Figure 9 Schematic diagram for a paper or membrane elec-trophoresis system.
Depending on pH, their charge can range from basic to anionic and from hydrophobic to hydrophillic, and their shapes can vary from globular to linear with varying degrees of cross-linking. Shapiro introduced electrophoresis in the presence of sodium dodecyl sulfate (SDS) which is an anionic surfactant that is used to solubilize proteins. Proteins are Rrst de-natured with SDS which binds to the hydrophobic backbone of proteins in a regular fashion. Almost regardless of the type of protein, 1.4 g of SDS binds to 1 g of protein and solublizes it. In addition, the charge on the SDS overwhelms the charges on the protein. The degree and type of denaturing can also be en-hanced by using SDS solutions which also contain urea and/or a thiol such as dithiothreitol (DTT). The complex is now more or less linear with an overall negative charge so all proteins migrate in a single direction. The denatured unknown proteins are then electrophoresed by PAGE in a buffer system in-corporating 0.1% SDS. By running a series of known standards in a parallel lane, the technique can be used to derive molecular weight information since there is a Rxed relationship between the relative migration distance of SDS}protein complex and the molecular weight of the native protein.
Pulsed Field for DNA
Agarose gel electrophoresis is the method of choice to resolve DNA restriction fragments provided the frag-ments are between 1000 and 23 000 bp in size. For larger fragments, Schwartz and Cantor developed the technique of pulsedReld gel electrophoresis (PFG) in 1984. In PFG DNA fragments greater than 23 kbp are forced to change their structure during elec-trophoresis by pulsing the appliedReld so causing the molecules to relax and expand regularly and thereby interact with the gel pores. DNA molecules up to the size of chromosomes can be electrophoresed in this manner, but the separation can take many hours or even days.
Basic Instrumentation for
Electrophoresis
Instrumentation for performing electrophoresis is both cheap and simple. It consists of a means of generating a DC voltage, a buffer tank which also has some means of holding the separation media between the two electrodes. A schematic diagram of such a horizontal tank is shown inFigure 9. Such an apparatus needs to be levelled in order to prevent the electrolyte from siphoning from one end to the other and so disturbing the electrophoretic resolution. The
power supply can be as simple as a 12 V battery, but is usually a mains electricity transformer delivering 100}500 V DC. The required voltage is selected by a digital potentiostat combined with a polarity switch, the run time can also be selected digitally. Usually there are controls to select constant voltage, constant current and constant power modes of opera-tion. If the instrument’s designed maxima in any of these modes are exceeded there is a cut-off (safety) trip. Electrical power is usually taken to the electrophoresis tank via a pair of suitably rated copper cables. The tank itself is typically made of a waterproof and electrically insulated plastic mater-ial covered with a lid to prevent evaporation and contamination of the system. The size of the tank will depend on the type of separation being undertaken and can range from as small as 100 mm square to as large as 500 mm;300 mm. The tank is divisible into a number of compartments with plastic spaces. The outer two hold the electrodes. The electrodes are usually made of Rne platinum wire connected through the tank wall to the leads from the power supply. Suitable safety devices are included in the tank to prevent operator accidents, for example the power is cut-off if the lid is removed.
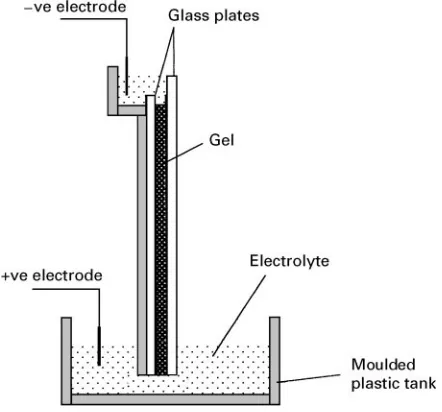
Figure 10 Schematic diagram of a vertical gel electrophoresis system.
depending on the application. At the top, a sample well comb is used to create indentations into which samples can be placed. Following the setting and/or polymerization of the gel, the comb is carefully re-moved and sample(s) (5}10L) are loaded into each well. Molecular weight markers, known proteins or DNA fragments, are usually applied to one or both of the two outer lanes. The upper and lower buffer chambers are thenRlled and the system is connected to the power supply. Appropriate voltages are se-lected and the power is turned on for the appropriate time. In order to monitor the progress of the separ-ation it is common practice to include a marker dye in the sample. When the dye reaches the end of the gel (normally after some hours) the power is disconnected. The buffer is drained and the gel removed from between the plates prior to staining or blotting (Figure 10).
As well as vertical formats it is also possible to run horizontal slab gels either completely immersed in electrolyte solution (so-called submarine gels) or with suitable wetted connectors.
Although it is relatively easy to construct your own low-voltage electrophoresis system, especially the tanks, systems are available from a large number of suppliers, such as Amersham-Pharmacia, Bio-Rad, Hoeffer, and so on. The cost of commercial sys-tems range from a few hundred pounds to about C5000 depending on size, conRguration, maximum voltage and whether or not cooling systems are included. Today, even the preparation of gels can be simpliRed. Premixed reagents are available to simplify the production of reproducible gels and it is
now possible to buy precast gels which only need to be mounted in a suitable holder.
Detection Methods in Electrophoresis
At the end of an electrophoretic run the analytes are distributed over a two-dimensional surface or included within a thin three-dimensional gel. With only a few exceptions, the majority of analytes will not be visible to the naked eye and many methods for both the detection, localization and quantitation of separated bands and spots have been developed.
Direct optical methods can be applied in some cases. For example, the bands of haemoglobin separ-ated by electrophoresis on a nitrocellulose membrane can be observed directly. In some cases placing the paper or gel on a ultraviolet (UV) lightbox or under a UV lamp can reveal UV absorbing bands, UVS u-orescence bands and sometimes bands that quench the background UVSuorescence.
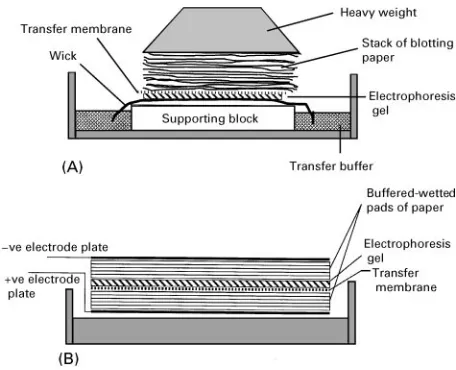
Since the analytes are often trapped within a fragile gel, then some means of extracting them from that matrix often is necessary before a visualization method can be applied. For this purpose, one of the blotting techniques is applied. Blotting involves the transfer of the sample bands or spots from a gel to a sensitized membrane using either physical or electri-cal mechanisms. Nitrocellulose, Nylon or poly-vinylidene diSuoride (PVDF) are the most common membranes because they provide hydrophobic surfa-ces on which proteins readily adhere, as well as being physicaly strong. In 1975 Professor Ed Southern described theRrst of these procedures, which is com-monly called Southern blotting, for use with DNA. In this method, diffusion of DNA from a continuously wetted electrophoresis gel to a membrane is achieved by pressure applied to a sandwich of wetted wick-gel-membrane}stack of blotting paper (Figure 11). The DNA in the gel is carried into the membrane that binds the DNA giving a faithful image of the original gel. The process takes up to 24 h but can be speeded by using a vacuum to draw the buffer through the gel.
Figure 11 The principles of two types of blotting: (A) Southern blotting and (B) semi-dry Western blotting.
Applying a voltage causes the proteins/DNA to mi-grate to the membrane. If Rlter papers wetted with buffer are used instead of buffer, then this is called semi-dry blotting. Once the analytes have been stabilized on the membrane they then can be probed in order to detect the analytes (this is discussed fur-ther below).
If separations were performed on sheets or have been blotted, then the position of the analytes can be determined by the following methods. If radioactivity has been incorporated in the analytes prior to elec-trophoresis, then the position of the analytes on the membrane can be determined by autoradiography. The membrane is placed with the gel in contact with photographicRlm and left to expose (hours to weeks) in the dark and possibly the cold. The Rlm is de-veloped and the position of the analytes is revealed by the exposed parts of the negative. If required, the original membrane or gel can then be overlaid on the negative and the radioactive spots obtained by cutting-up the gel followed by elution and scintilla-tion counting.
It is often necessary to revel analytes of interest using some form of derivatization. This may mean spraying the blot or membrane with a speciRc reagent that chemically reacts with the analyte to give a col-oured product, for example, ninhydrin gives a purple product with amino acids, peptides and some pro-teins. For macromolecules it is more common to refer to this process as staining using either appropriate dyes or other reagents. Proteins can be detected in gels with a large number of dyes of which the most common is Coomassie brilliant blue which can detect as little as 0.3g of protein in a spot. DNA is usually detected using the Suorescent intercalating dye ethidium bromide. The process involves staining
fol-lowed by destaining to remove unbound dye and then Rxing of the image. Both proteins and DNA can react with silver ions to form black silver precipitates. This method is some 100 times more sensitive than the current dye methods and can detect as little as 2 ng of some proteins.
The above methods are relatively non-selective, although for simple mixture comparisons against standards they may be sufRcient to identify pro-teins. More speciRc methods of detection include zymography and immunoelectrophoresis. Early methods include immonodiffusion in which an antiserum is allowed to diffuse into a gel so generating precipitin bands and rocket electrophor-esis. Today the most common application of immunotechniques is in Western blotting with immunodetection; this is so common that many workers believe it is Western blotting. After blotting, the immobilized proteins are probed with primary antibodies speciRc for the protein(s) of interest. This is followed by an enzyme-linked second antibody directed against theRrst antibody, for example sheep anti-mouse immunglobin G (IgG). The enzyme is usually a peroxidase or alkaline phosphatase. The blotted membrane is Rrst soaked in a solution to block non-speciRc binding sites followed by incuba-tion with a suitably diluted soluincuba-tion of theRrst anti-body for up to 1 h. The antianti-body solution is then washed off before incubating with the secondary antibody complex. Again, following washing, the proteins are revealed by incubation with an appropri-ate visualization reagent. Depending on the antibod-ies available such methods can be very selective and also very sensitive.
Finally, the most modern methods of both detec-tion and protein characterizadetec-tion involve mass sepec-trometry and are dealt with below.
Quantitation
The above methods are usually indirect and qualitat-ive, so if you wish to obtain quantitative analytical data from electrophoretic separations or blots it is necessary to determine the area of the separated bands. The amount of analyte present is related to the area of the spot or band when compared to standard solutions. The areas of bands can be obtained using densitometry or digital image analysis to scan the gels or blots. However, even modern densitometry is only semi-quantitative with coefRcients of variation of 10}20% at best.
Two-dimensional Separations
combined. The use of orthogonal techniques in-creases the resolution of the systems in proportion to the product of the resolution of each dimension as-suming the two modes are truly orthogonal. For example, separations that each give 10 bands in a single direction/mode will theoretically give 100 spots if combined. The sacriRce is, of course, speed, it will take twice as long, and increases the number of manipulations involved.
Early work such as peptide mapping often used high-voltage electrophoresis in the Rrst dimension and then chromatography in the second. For a decade or more this was the standard method for generating tryptic maps for studies on such areas as haemoglobin variant analysis. However, each sample would take nearly two days to run, a day for each dimension.
The most popular two-dimensional electrophoretic method is the combination of IEF with SDS}PAGE. O’Farrell and Klose independently introduced this system in 1975. In O’Farrell’s original system isoelec-tric focusing in ampholytes was used in the Rrst dimension and the resulting tube gel was then careful-ly attached to a slab gel followed by running in the SDS}PAGE mode. This method was able to separate up to 1000 protein spots from a protein extract of a tissue. However, the system required considerable expertise to use due to the variation in the IEF step; many workers found it irreproducible. With the de-velopment of immobilized IPGs the ease of operation of the IEF component was, as already discussed, greatly improved and relatively simple two-dimen-sional systems are now available commercially. For gels of 250 mm;250 mm up to 3000}4000 protein spots can be revealed by silver staining from extracts of tissues such as liver. In this mode electrophoresis is probably the separation technique with the highest resolution available to the modern researcher.
Proteome analysis (proteomics) is a major newReld of biomedical research. The proteome is deRned as the total complement of proteins found within an organism, cell, tissue or bioSuid. While the human genetic code will soon be known, its relationship to cell function will only be ascertained by advances within proteomics. For example, DNA sequences are not predictive of post-translational modiRcations such as glycosylation within the encoded proteins. Proteomics is the method of qualitatively determining this large number of proteins. It combines the high-resolution two-dimensional electrophoretic tech-niques mentioned above with digital image analysis, some elements of HPLC and modern mass spectro-metry plus on-line bioinformatics to search databases. For example, two-dimensional proteome maps can be produced for a tissue such as liver and then digitally compared with the same tissue taken
from a diseased subject. The differences in the complex pattern, which may contain 1000#spots, can be highlighted automatically and then mass spec-trometry either of the MALDI-ToF and/or electro-spray variety can be used to identify the variant proteins. By using such approaches it is now possible to identify known proteins using bioinformatic tools over the Internet in a matter of minutes, and to determine the structure of an unknown protein may only take a day or two.
Fields of Application
Although almost every class of molecule, especially those of a biochemical nature, has been separated by planar electrophoretic methods few are now done so. Early textbooks on electrophoresis detail separations of amino acids, sugars, purines and pyrimidines, nu-cleotides, some drugs, carboxylic acids, vitamins, and so on, but today’s analyst would now use HPLC or capillary electrophoresis for such quantitative stud-ies. Only for protein and DNA molecules is planar electrophoresis still the method of choice? Elec-trophoretic methods are used for qualitative and quantitative separation of proteins in clinical samples, biotechnological production and quality control, genomic and proteomic studies.
Traditional Planar Electrophoresis+Conclusions
This is still a basic tool in biochemistry and bio-medicine since it is simple and often very cheap, parallel analyses are usual and so although any one run is slow, the many bands can be run at the same time so overall throughput is reasonably high. With the appropriate detection techniques, selectivity and sensitivity can be very good. By using thick media electrophoresis the technique can be made at least semi-preparative. Finally, in two-dimensional formats (IEF}SDS}PAGE) electrophoresis probably gives the highest resolution known in separation science.
However, perceived disadvantages are that it offers only low resolution in one-dimensional separations and the results are at best only semi-quantitative. Since it is difRcult to use high volt-ages, it is seen as a slow technique made slower by the fact that detection is nearly always off-line.
Figure 12 The configuration of a simple capillary electrophor-esis (CE) instrument.
biology laboratories. However, research still continues into the technology and ultra-thin gels for DNA sequencing are giving excellent results and automated equipment for use with proteomics both in the electrophoresis stage and the sample isolation stage is being developed. Even after 100 and more years there is still much life in this technology.
Capillary Electrophoresis (CE)
For 40 years it had been appreciated that the excess-ive Joule heating that developed when high voltages were used to speed-up electrophoresis caused many of the technique’s disadvantages. These disadvantages ranged from simply boiling the buffer solutions through to instrument Rres and even electrocution. Many attempts were made to overcome the physico-chemical problems that degraded the separations. For a time in the 1960s and 1970s high-voltage elec-trophoresis systems operating at up to 10 kV were available. They were usually very large pieces of equipment that used large sheets of chromatography paper for the separations and required substantial pumped water cooling systems to remove the heat generated. Other equally complex systems with rotat-ing Pyrex tubes to equalize the heatrotat-ing effects were also developed.
As with many problems, the solution when it came was very simple. In 1981 JoKrgenson rationalized the problem to one of increasing the rate of cooling by substantially increasing the surface-to-volume ratio of the electrophoresis buffer. This, he showed, was readily achieved by performing the electrophor-esis in small-bore capillaries. In a classic series of papers in that year Jorgenson and Lukacs described spectacular separations of peptides using zone electrophoresis in glass capillaries of 75m internal diameter using voltages of up to 30 kV with electrokinetic injection and Suorescence detection. This format enabled the Joule heating that normally degrades the resolution by thermal mixing to be ef-Rciently dissipated. In addition, this new format used the signiRcant electroosmotic (EOF)Sow of the back-ground electrolyte in the capillaries to separate ca-tion, anions and uncharged molecules simultaneously with all analytes usually going towards the cathode where a single on-line detector was placed.
This discovery led to the development of a new form of analytical separation instruments that was very equivalent in its operation to HPLC. Most of the major HPLC instrument manufacturers had by the end of the 1980s introduced CE systems with varying degrees of sophistication. There was also consider-able optimism that CE was going to replace HPLC for analytical separations. Ten years later only three
companies are still marketing complete CE instru-ments.
Today CE is characterized by its ability to resolve, using applied DC voltages givingReld strengths up to 500 V\1cm\1, the components of complex aqueous samples with very high resolution (N'250 000) analysing less than 10 nL of sample with analytical precision. To maintain efRciency, detection (UV, Suorescence) is nearly always on-line, i.e. across a window burnt into the polyimide coating of a silica capillary. Detection at the end of capillary can be achieved using electrochemical detectors or more use-fully mass spectrometry.
A typical CE instrument consists of a capillary, detector, high-voltage power supply, recording device (Figure 12). The capillary used is made of fused silica and externally coated with a thin layer of polyimide, to make the capillarySexible. The capillary is usually about 375m outside diameter and 10}150m inside diameter with 50 and 75m the more usual. There is no set capillary length, although in commer-cial instruments there are minimum lengths which can be used, and this is usually dependent on the position of the detector. To allow detection a small section of polyimide coating has to be removed mak-ing a weak point in the capillary.
In CE electroosmoticSow (EOF) is a positive bene-Rt, unlike in traditional electrophoresis systems. The silanol groups on the inner surface of the silica capil-lary are negatively charged above approximately pH 3 so cations build up near the silanol groups to maintain the charge balance. When the potential difference is applied to the capillary these cations are attracted towards the cathode, and they drag the bulk solution along with them (Figure 13).
Figure 13 The electroosmotic flow (EOF) profile in a silica capillary electrophoresis (CE) capillary.
a liquid chromatography pump is due to the shear force at the capillary walls. In CE there is no pressure drop and therefore a Sat Sow proRle is produced giving very much sharper peaks. In addition, at pH'6 the EOF will be of sufRcient magnitude to carry all the analytes regardless of their change in the same direction, this will only happen if the magni-tude of the EOF is greater than the electrophoretic mobilities of the anions. The EOF will also carry neutral molecules along, although it cannot separate them. Since everything is moving in one direction an on-line detector can be placed at the cathodic end of the capillary. The output from a CE system is there-fore very similar to that from HPLC systems}a series of peaks with baselines drawn in (if required) and areas of peaks calculated.
The present generation of commercial CE instru-ments is capable of unattended operation and fea-tures auto-injection using a variety of modes, integra-tion and spectral analysis in a manner analogous to HPLC. CE has become widely available and the tech-nology is now included in a number of other instru-ments such as a clinical protein analyser (Beckman Paragon) and in a DNA sequencer (PE-ABI 3700). In both of these instruments a large number of capillar-ies are operated in parallel in order to increase sample throughput, but the end users buys an instrument de-dicated to a speciRc application not a CE instrument.
Modes of operation for CE CE is generally recog-nized as the description appropriate for the whole Reld of this separation science. CZE stands for capil-lary zone electrophoresis, in which ions are separated according to their mobility in free solution. This is the most frequently used separation mode option avail-able within CE. A subtype of CZE is capillary ion analysis (CIA), which is used to determine simple ion species in aqueous solution rapidly. The other forms of electrophoresis described earlier such as isoelectric focusing and isotachophoresis can also be performed in a capillary format and are called cIEF and cITP, respectively. MEKC, sometimes called MECC } micellar electrokinetic capillary chromatography }is a separation mode introduced in 1984 by Terabe which allows the separation of neutral molecules by
their differential partition into charged micelles formed from detergents incorporated into the CE electrolyte. MECC can also be viewed as a subclass of CE methods involving complexation and inclusion using additives to the background electrolyte. An-other separation mode is capillary gel electrophoresis (CGE), which was introduced by Cohen and Karger in 1988. This offers DNA and SDS}PAGE separ-ations in a capillary, but with advantages in terms of speed, quantitation and ease of automation. TheR ll-ing of capillaries with gels has now been supplanted by the use of entangled viscous polymer solutions to separate DNA. A recent development is the use of EOF to drive eluent through a capillary packed with HPLC stationary phase. This is termed capillary electrochromatography (CEC) and some very high efRciencies for neutral compounds have been demonstrated using this technique. CEC is performed on standard CE instrumentation, but has the added advantage that the eluents used are more readily interfaced to MS than is CE.
Figure 14 High-resolution separation of UV absorbing components of human urine separated by MEKC with detection at 195 nm.
are correspondingly lower, e.g. UV detection samples across a 50m capillary in CE compared to 10 mm in HPLC. There is much activity in detector develop-ment to address the problem of sensitivity. Laser-induced Suorescence (LIF) has been studied widely and promises to bring detection limits down to the single molecule level for appropriate Suorophores. LIF detection is now commercially available. CE-MS with electrospray ionization has proved to be a powerful technique with applications to structural studies of large biomolecules as well as small ions, and there is good concentration sensitivity using cap-illary isotachophoresis as the separation mode.
Applications Clearly CE is very good for separating charged species whether small molecules or macro-molecules. It is necessary to operate in MECC mode to separate neutral molecules such as drugs. There are now some 5000 publications describing separations of some 10 000 compounds by CE. Charged and neutral compounds are all easily separated but there are too many examples in the literature to even attempt to describe them here. The high resolving power of CE is such that it can readily resolve enan-tiomeric compounds. The most commonly employed method is to include cyclodextrins into the electro-lyte. -Cyclodextrin is the most readily available compound, but recently sulfated derivatives of -cyclodextrin have been shown to give separation of chiral compounds with spectacular resolution between the enantomers. Oligonucleotides have
pro-ved to be readily separated using entangled polymeric additives such as hydroxyethylcellulose in the electro-lyte to increase its viscosity and therefore gel-R ltra-tion effects. While the potential for quantitaltra-tion shows enormous promise for proteins, there are sev-eral problems which remain to be overcome. Wall interactions degrade resolution and at worst lead to total adhesion of proteins to negatively charged sites on the silica capillary. Strategies to minimize this include covalent bonding to give coverage of the surface by hydrophobic groups, and dynamic coating using solution-phase additives.
In comparison to HPLC, CE achieves better resolu-tion than both isocratic and gradient HPLC using simpler instrumentation. CE is not a preparative tech-nique, although it has been used as a microprepa-rative system to isolate very small amounts of protein for sequencing. It is less sensitive than HPLC by about an order of magnitude. There is little difference in terms of quantitative data and analytical precision. Sample preparation probably needs to be better controlled and understood than for HPLC. At present, CE instrumentation is more expensive than HPLC, although running costs are considerably lower. CE uses much less sample and reagents than HPLC. Waste disposal problems are considerably reduced.
See Colour Plates 6, 7, 8, 9.
Further Reading
Andrews AT (1986) Electrophoresis Theory, Techniques and Biochemical and Clinical Applications, 2nd edn Oxford: Oxford University Press.
Camilleri P (1997)Capillary Electrophoresis:Theory and Practice, 2nd edn. Boca Raton, FL: CRC Press. Dunn MJ (1993)Gel Electrophoresis of Proteins. Oxford:
Bios.
Everaerts FM, Beckers JL and Verheggen TP (1976) Iso-tachophoresis: Theory, Instrumentation and Applica-tions. New York: Elsevier.
Landers JP (ed.) (1994) Handbook of Capillary Elec-trophoresis. Boca Raton, FL: CRC Press.
Mosher RA, Saville DA and Thormann W (1992) The Dynamics of Electrophoresis. Weinheim: VCH. Smith I (1968)Chromatography and Electrophoresis, vol.
II.Zone Electrophoresis. London: Heinemann. Vindevogel J and Sandra P (1992)Introduction to Micellar
Electrokinetic Chromatography. Heidelberg: HuKthig. Weinberger R (1993)Practical Capillary Electrophoresis.
New York: Academic Press.
Westermeier R (1997)Electrophoresis in Practice, 2nd edn. Weinheim: VCH.
Zweig G and Whitaker JR (1967)Paper Chromatography and Electrophoresis, vol. 1.Electrophoresis in Stabiliz-ing Media. New York: Academic Press.
EXTRACTION
D. E. Raynie, The Procter & Gamble Company, Cincinnati, OH, USA
Copyright^ 2000 Academic Press
Introduction
Extractions are common in the world around us. Each time we brew a cup of tea or a pot of coffee, and each time we launder our clothes, we’re perform-ing a chemical extraction process. Perhaps because of this familiarity, extraction processes in chemical laboratories are often not fully appreciated, or fully understood. Quite simply, an extraction is the process of moving one on more compounds from one phase to another. Yet behind this simple deRnition lies a great deal of subtlety: separations are contrary to thermodynamic intuition, because entropy is gained through mixing, not separation; extraction methods are developed based on a drive towards equilibrium, yet the kinetics of mass transfer cannot be ignored. Such a list of physical chemical nuances provides the basis for this chapter on the fundamentals of chemical extractions.
Extractions are carried out for a variety of reasons, for example when distillation is either impractical (e.g., distillations are favourable when the relative volatility of the compounds to be separated is greater than about 1.2) or is too expensive, to isolate material for characterization, to purify compounds for sub-sequent processing, etc. Extractions can be classiRed according to a number of schemes:
E analytical versus preparative (depending on the quantity of pure compound to be separated);
E batch versus continuous (depending on the mode of feeding the material to be separated into the extrac-tion apparatus);
E based on the physical principles involved (is the extraction strictly based on partitioning, or are adsorption or other processes involved?);
E based on the types of phases involved (so called liquid}liquid extraction, gas}solid extraction, supercriticalSuid extraction, etc.).
Perhaps the biggest recent advances in the Reld of chemical extractions have taken place in the petro-leum, nuclear, and pharmaceutical industries. The understanding and practise of extraction lies at the crossroads of analytical, inorganic, organic, and physical chemistry, with theoretical and applied chemical engineering. Yet the fundamental physico-chemical principles involved are the same. Because of the author’s background, this chapter presents a de-scription of the fundamental basis for chemical ex-tractions and an overview of extraction techniques with a slant, or emphasis, towards the analytical chemists’ perspective.