Athermal Tuning for a Two-Section, All-Active
DBR Laser With High-Order Grating
Volume 10, Number 5, September 2018
Frank Bello
Michael J. Wallace
Robert McKenna
Gaurav Jain
Qiaoyin Y. Lu
Weihua H. Guo
John F. Donegan, Senior Member, IEEE
Athermal Tuning for a Two-Section,
All-Active DBR Laser With
High-Order Grating
Frank Bello ,1,2Michael J. Wallace,1,2Robert McKenna ,1,2 Gaurav Jain ,1,2Qiaoyin Y. Lu ,3Weihua H. Guo,3
and John F. Donegan ,1,2Senior Member, IEEE
1School of Physics and Center for Research on Adaptive Nanostructures and Nanodevices,
Trinity College Dublin, Dublin, 2 Ireland
2Advanced Materials and Bioengineering Research, Trinity College Dublin, Dublin 2, Ireland 3Wuhan National Laboratory for Optoelectronics, Huazhong University of Science and
Technology, Wuhan 430074, China
DOI:10.1109/JPHOT.2018.2871317
1943-0655C 2018 European Union. Translations and content mining are permitted for academic
research only. Personal use is also permitted, but republication/redistribution requires IEEE permission. See http://www.ieee.org/publications_standards/publications/rights/index.html for more
information.
Manuscript received September 11, 2018; accepted September 14, 2018. Date of publication Septem-ber 26, 2018; date of current version OctoSeptem-ber 3, 2018. This work was supported in part by the Science Foundation of Ireland under Grants 15/IFB/3317, 15/IA/2854, and CONNECT 13/RC/2077; and in part by the European Union’s Horizon 2020 research and innovation program under the Marie Skłodowska-Curie Grant agreement 713567. Corresponding author: Frank Bello (e-mail: [email protected]).
Abstract:We incorporate thermal effects for injection currents ranging up to 150 mA in order to model the tuning behavior of a two-section, all-active distributed-Bragg-reflector (DBR), ridge-waveguide semiconductor laser utilized for a single-mode operation. In particular, we investigate wavelength tuning as a function of injected currents within the grating and phase/gain sections of the laser cavity and examine how any athermal lasing conditions may arise. The effect of thermal drift on the resonant wavelength due to a change in refractive index as well as thermal expansion of the laser cavity is included within a traveling wave analysis (TWA). From the TWA, the spatial distribution of gain along the active region of the laser is also derived in order to help describe the tuning behavior for a high-order (37th) grating previously optimized to minimize linewidth. A comparative analysis with a single mirrored, active-passive DBR laser is also included. Results show a good agreement with reported experimental data and compare well with the wavelength stability of other laser devices.
Index Terms:Tunable semiconductor laser, single-mode laser, surface grating, high order grating, athermal.
1. Introduction
Fig. 1. (a) An optical image of the actual device modeled shows a 1 mm active region composed of grating (right) and phase/gain (left) sections. The slots are just visible in the grating section. (b) 2D representation of the scheme utilized to dissect the laser into sections of differing effective indices of refraction for implementation within the traveling wave equations. Refractive indices (n) of each layer and thicknesses of the active and slotted regions are given with a slot width (ds) and slot period (dp)
optimized for a 37th order grating.
active region, the partially-slotted DBR laser presented here incorporates a periodic Bragg grating positioned on only one side of a ridge waveguide thus requiring only a single cleaved facet. The high-order (37th) enables a larger slot width of circa 1μm for ease of fabrication. The dimensions of the high-order grating may be optimized such that the reflection and transmission coefficients are robust against small changes in slot width and period [6]. In our design, we use two contacts over the grating and phase sections, as shown in Fig. 1(a). Small adjustments to the currents in the two sections allow high performance in SMSR as well as a low linewidth even considering an increase in photon loss due to the high order grating, and in principle allows for etching using photolithography [7]. A disadvantage of high-order gratings is that they introduce radiation loss not observed with first-order DFB lasers, so placement of the slots within the cavity must be carefully managed to minimize this loss.
[image:3.594.106.497.66.222.2]includes data previously retrieved from a scattering matrix analysis [14] to derive the coupling factor, radiation loss, and reflectivity coefficient of the grating which are then implemented within a finite-difference time-domain (FDTD) method for traveling waves [16]. Calculations are shown to match well against measured experimental data.
2. Theoretical Methods
The traveling wave equations are simulated using the scheme outlined in Fig. 1(b), where the laser cavity is broken into ‘N’ partitions. We then solve the following differential equations for the amplitudes of the forward (F) and reverse (R) traveling waves within each section of the laser cavity [17], [18],
u c
∂F (t,z) ∂t +
∂F (t,z)
∂z =(g−iδ−αs−h1)F (t,z)+i(κ+h1)R(t,z)+sf (1)
u c
∂R(t,z) ∂t −
∂R(t,z)
∂z =(g−iδ−αs−h1)R(t,z)+i(κ+h1)F (t,z)+sr (2) Waveguide loss, radiation loss from the slots, and coupling factor are defined by αs, h1, and
κ respectively, with c being the speed of light and u the group refractive index. δ is the Bragg wavelength detuning defined as
δ= ω
cni− u
2cαG(z,t)− qπ dp
(3)
with designations for the resonant frequency of the laser (ω) at threshold, the linewidth enhancement factor (α), the gain per unit time (G), and the order of the grating (q). The subscript on effective index, ni, corresponds to which section of the laser we are simulating; namely the grating or phase/gain
section which in general have differing injection currents. At constant temperature, the effective indices depend only on whether or not a slot is present in that particular section. The effective refractive index for a section containing a slot with a depth of 1.35μm has been calculated to be 3.1965 and 3.1997 if no slot is present [14]. As temperatures change due to varying the injection current, thermal effects are included in the refractive indices by considering the thermal expansion coefficient of the lasing cavity,σe, as well as the thermo-optic coefficient,∂ni/∂T [19]. Together these
two factors contribute to the detuning of the resonant wavelength of the laser quantified as,
dλr
dT ≈
λr
u
niσe+∂
ni
∂T
(4)
whereλr is the resonant wavelength at threshold and the thermo-optic coefficient is retrieved from
experimental data with a value of 2.3 ×10⁻⁴ K−1 [11], [20]. The thermal expansion is found to account for roughly 3% of the tuning in our model. The gain per unit time is dependent on the detuning between the photon mode and Fermi level separation which is defined as
G(z,t)=Rsp
1−exp ω−
Ef
kBT
(5)
withkBas Boltzmann’s constant and using a quasi-Fermi level separation,Ef =Eef f +σT2/(β+T),
where Eef f is the effective bandgap energy withσandβbeing empirically derived fitting parameters
previously determined in [21]. The effective bandgap energy includes the first electron and hole subbands in the conduction and valence band which is estimated to be approximately 0.9 eV [22]. Altogether this yields a quasi-Fermi level separation of 0.832 eV at ambient temperature; agreeing well with calculations done in [23]. The spontaneous emission is defined as a function of the number of carriers,
Rsp = βspηspγeN(z,t) (6)
where βsp is the spontaneous emission coefficient, γe is the carrier-recombination rate, and
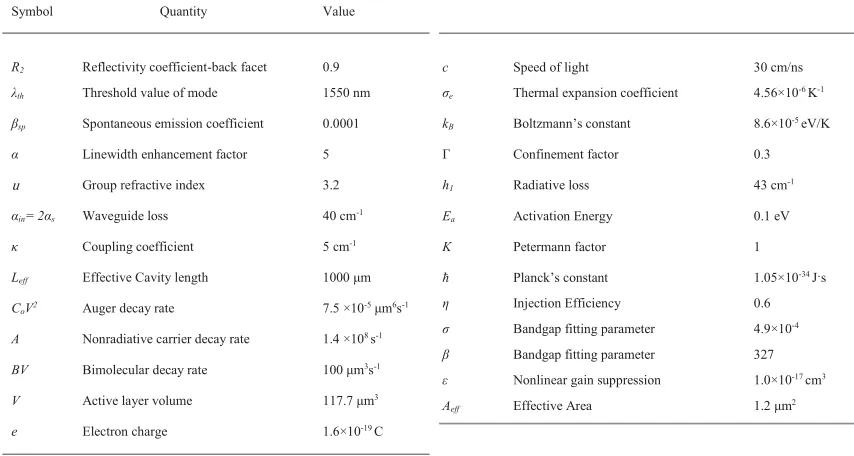
TABLE 1
Parameters Used in Simulations
Parameters have been previously determined when calculating the intrinsic linewidth of the laser cavity [3], [17] with radiative loss estimated using experimental data for the 37th order grating [1] and βsp ranged between typical values of 10−4and 10−5 for a more precise fitting. The gain per
unit distance is then,
g(z,t)= u G(z,t)
2c(1+εP) (7)
which includes nonlinear gain suppression,ε, and P is the photon density.κ, the amount of coupling between the forward and reverse waves, is approximated to second order as rࣈ tanh (κ ×Leff) where r is the reflectivity of the grating structure calculated to be 0.427 from the scattering matrix method with the coupling factor considered to be zero in the phase/gain section of the laser [6], [7]. It is noteworthy thatκis an imaginary term in the traveling wave equations and contributes to the total shift of the resonant wavelength. The reflectivity is also used to estimate the radiation loss through the slots. The spontaneous noise terms are defined bysf andsr which satisfy
s(z,t)szt = u K Rspδ(t−t
)δ(z−z)
cLef f
(8)
where K is the Petermann factor. There is a separate equation utilized to calculate the number of carriers in each section given by
dN (z,t)
dt =
ηJiV
ed −A N −B N
2−C N3−G(z,t)
1+εPP. (9)
The injection current per volume is given byJi/d, withηthe injection efficiency and d the active
layer thickness of 400 nm. Typical parameter values for semiconductors utilized in the calculations are listed in Table 1 which include 2nd (B) and 3rd order (C) decay processes in carrier lifetime with the latter taken as an exponential function of the activation energy and temperature as described in [24].
Before simulating the traveling wave equations to retrieve the wavelength tuning, we must first calculate the change in temperature due to the power dissipated given by [25],
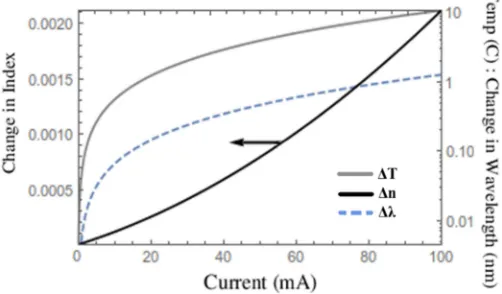
Fig. 2. Change in refractive index (n) and change in wavelength (λ) calculated from (4) for the grating section. The quadratic change in temperature (T) from (10) is also depicted.
where Pdi s(Pin) is the dissipated (input) power for each section with a quadratic dependence on current given by
Pi n=Ji2R+Ji(VD +VS). (11)
R =9.2is the Ohmic resistance of the laser, VD +VS =0.8865 V are the diode (VD) and
series (VS) voltages, respectively, whileZT is the thermal impedance with an approximate value of
75.43±3.12 K/W. All values are estimated from measurements taken for an array of similar high-order grating, all-active DBR lasers by I. Matthews et al. in [26].U is the wall-plug efficiency of the laser defined asPout/PinwithPoutthe output power of the device.
Although this may vary for individual sections at very high injection currents and consequently changes of temperature, injection currents in our analysis only adjust the temperature on the order of 10 K and significant thermal diffusion between grating and phase/gain sections is not anticipated. Therefore, we conservatively approximateυat 0.35 for both sections of the all-active DBR laser; similar to many active-passive DBR and DFB laser cavities [25].
Fig. 2 demonstrates the effect a change in temperature of 10 K has on the refractive indexes and subsequently the resonant wavelength within the grating section. The overall change in temperature is calculated from (10) and agrees well with previously reported experimental results [27]. The thermal drift is most significant well above threshold with a total shift predicted of roughly 1.1 nm when adjusting currents up to 100 mA. For this range of injection currents, the quadratic dependence of temperature is predominant causing a change of index (n) of more than 0.001. It should be noted that although the index within the phase/gain section may also change due to temperature, this change had a negligible effect on the wavelength tuning (ࣈ10−2 nm) due to the absence of slots in this region.
3. Theoretical Methods
The derived wavelength tuning map presented in Fig. 3(a) is for the laser presented in Fig. 1 with a 1 mm long cavity containing a phase/gain section of 760 microns and relatively short grating section of 240 microns. This asymmetry within the design along with the high-reflective coating at the end of the phase/gain section contributes to a non-uniform distribution of particles along the cavity as will be shown. The end of the grating section is covered with an antireflective coating and serves as the output end of the cavity [6], [17].
Fig. 3. (a) Simulated wavelength tuning map for the all-active DBR laser using the traveling wave analysis described in Section 2. The tuning behavior is found to be a balance of changes in the refractive indexes due to temperature for increasing grating currents labeled with arrow (R1) as well as changes in gain/carrier density highlighted with arrows (B1) and (R2). (b) Average carrier density along the entire active region of the cavity. As the grating current is increased and gain is becoming saturated, the rate of change of the carrier density is reduced for the full range of currents in the phase/gain section.
tuning effect when varying currents in the front and rear mirror sections [29]. Notably in these types of lasers, the overall redshift in wavelength due to thermal effects for increasing front grating current is comparable to that of the all-active DBR laser demonstrated in Fig. 2 [30]–[32] though the exact range of tuning may vary depending on current range in each section [33]. We need to fully understand the tuning behavior of our two-section slotted lasers so that we can determine the best conditions for athermal operation.
This is the first investigation for the all-active DBR laser aimed at sharply examining the effects of currents under 150 mA though the nonlinear behavior was demonstrated in [27], [28], [34] with less detail/analysis. In addition, we further contribute a comparison with a 2-section active-passive DBR laser using identical gratings to demonstrate the contrasting effects that can occur.
3.1 Tuning Map Analysis
3.1.1 Two-Section All-Active DBR Laser: As labeled in Fig. 3(a), we find a balance of three main
effects in the tuning map: a redshift (R1) of the wavelength for increasing grating currents well above threshold, a blueshift (B1) for increasing grating currents below and near threshold, and a redshift (R2) for increasing phase/gain currents.
Shifts B1 and R2 are found to be primarily from the effects of gain on wavelength tuning which is quantified in the second term of the Bragg detuning in (3) with gain being proportional to N2 [6]. Here an increase in carrier density will subsequently produce a blueshift in the resonant wavelength while a decrease in carrier density causes a redshift. This is corroborated in Fig. 3(b) where we have plotted the carrier density profile as a function of injection currents. Indeed a decrease in carrier density is shown for growing phase/gain currents causing the redshift R2 with thermal drift from the phase/gain section found to be negligible with the grating (coupling) effect on the waves removed. Conversely, an increase is seen near threshold for increasing grating currents causing the blueshift B1.
For increasing grating currents above threshold, the carrier density is still increasing, however with the rate of change slowing down. Here, as we move above threshold circa a grating current of 40 mA, the thermal drift begins to take over and we see the redshift R1.
3.1.2 Active-Passive DBR Laser With Similar Grating: In order to confirm this behavior, we
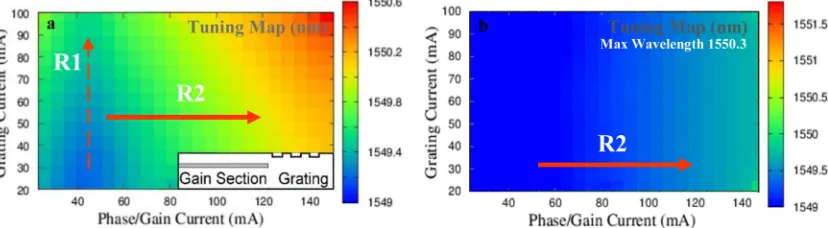
[image:7.594.88.506.68.182.2]Fig. 4. (a) Tuning map (nm) calculated from the traveling wave analysis for an active-passive DBR laser with gain section of 1 mm. This 37th order grating described in the text is placed at the end of the cavity however now without gain material. Results demonstrate different tuning behavior than that of the tuning map in Fig. 3 with notably the blueshift (B1) at low injection currents disappearing. (b) The same simulation as in (a) however the temperature effects on the refractive index are no longer included. This removes the thermal redshift we see for increasing grating currents labeled as (R1). The scale of (b) is kept over the full tuning range shown in Fig. 3 to demonstrate the different wavelengths achievable.
now only the redshift R1 for increasing grating currents clearly appears. The redshift R2 due to gain in the phase/gain section also remains though notably the tuning range is reduced from 2.5 nm when gain is present to 1.6 nm without the gain. It should be reemphasized that tuning maps for SG-DBR and multi-sectioned DBR lasers may have an altered tuning range as well due to differing injection currents [28], [33], [34].
In Fig. 4(b) we further adjust the active-passive DBR model by deliberately neglecting the effects of temperature on wavelength tuning. As anticipated, the redshift attributed to the thermal drift for increasing grating currents in the all-active DBR laser disappears. In this scenario, the wavelength tuning is dominated by the gain in the phase/gain section for increasing phase/gain currents for which we see the redshift R2 now is roughly 1 nm.
3.2 Comparison With Experiment
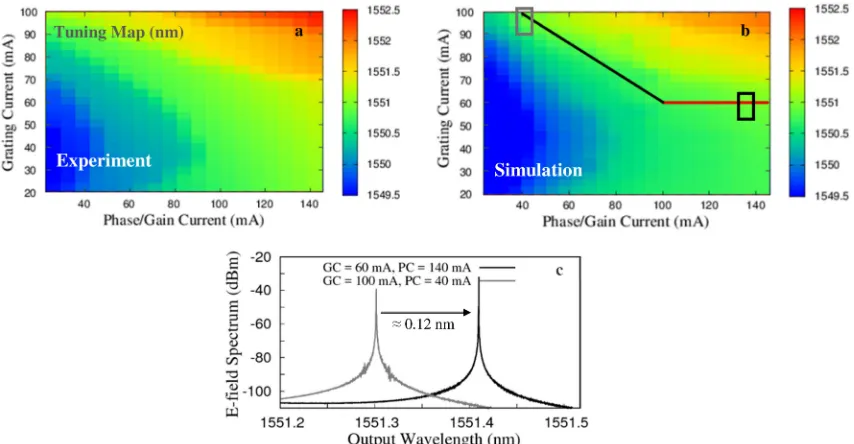
[image:8.594.93.507.68.182.2]Fig. 5. (a) Experimental results showing the resonant wavelength as a function of currents applied to the grating and phase/gain section. Results shown are for a 1 mm laser and using a 37th order grating composed of 24 slots. (b) Tuning map calculated from the travelling wave analysis. Overall shift matches well with experimental data after mode hops are added in with a maximum wavelength shift ofࣈ3.0 nm. Solid lines demark an athermal area with no mode hopping as a function of injection currents. (c) The total wavelength shift along the athermal region is demonstrated by plotting the E-field spectrum for grating currents (GC) of 100 mA (blue square) and 60 mA (black square) with phase/gain currents (PC) of 40 mA and 140 mA, respectively.
injection efficiency and the spontaneous emission rate [1], [15]. This also compensates for the shift in hopping position of roughly 5–10 mA between experiment and theory.
Following the solid lines in Fig. 5(b), one can notice athermal behavior for which the laser output avoids mode hopping and which the wavelength is unchanged for the full range of phase/gain currents. This behavior may again be explained by examining the wavelength tuning in the all-active DBR laser and comparing it to that of the 2-section active-passive DBR laser. To reiterate, a mode hop is expected if the reflected wavelength of the grating shifts by roughly half a mode hop in relation to the peak gain wavelength [25]. From the thermal drift equation in (4), it is determined that the grating current ranging from 20 to 100 mA is able to produce the total redshift R1 of roughly 1 nm in the reflected wavelength we see in Fig. 4(a) due to changes in the refractive index with temperature. Following the black diagonal line in Fig. 5(b), a reduction in grating current from 100 mA→60 mA will produce a blueshift in wavelength by reducing the temperature. This is counterbalanced by the redshift R2 in wavelength as phase/gain currents are increased from 40 mA→100 mA due to the significant reduction in carrier density[displayed in Fig. 3(b)]. Changes to the peak gain wavelength have been shown to be linearly proportional to the average carrier density throughout the active region [25], [35]. Overall, following the black diagonal line, the blueshift due to temperature effects and the redshift due to gain/carrier density are both approximately 1 nm helping to offset each other and prevent significant detuning or mode hopping.
[image:9.594.84.511.64.286.2]Fig. 6. Measured spectra taken at various points along the tuning map of Fig. 5a (highlighted). The spectra demonstrate lasing with very good SMSR values over 40 dBm as well as the anticipated blueshift (B1) when adjusting grating currents near threshold (black to blue curve) and the redshift (R1) at higher grating currents (solid red curve). The redshift (R2) is also shown for increasing phase/gain currents (70 mA–100 mA) while keeping the grating current constant. Comparison of the solid and dashed red spectra exhibits a wavelength change of 0.04 nm/5 Ghz along the athermal region of the tuning map.
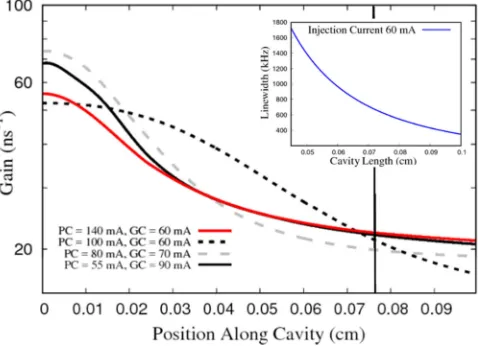
Fig. 7. The gain distribution throughout the cavity is plotted for various points along the athermal line of Fig. 5b. For constant phase/gain (PC) currents well above threshold (solid curves) changes throughout the majority of the cavity are within maximum noise fluctuations of roughly±2 ns−1with average gain
values of 29.7 ns−1and 25.4 ns−1for PC=100 mA and 140 mA respectively. Below PC=100 mA
the gain distribution begins to change considerably and the grating current (GC) needs to be adjusted in order to compensate for the detuning due to the changes in gain as shown by the gray dashed and solid black curves. A vertical line delineates the phase/gain section from the grating section (ࣈ240μm from front facet). Linewidth values are shown under a uniform injection current of 60 mA (inset).
[image:10.594.180.419.316.489.2]the gain distribution for increasing phase/gain currents at values taken along the solid athermal line of Fig. 5(b). For phase/gain currents between 100–150 mA changes to the average rate of gain across the cavity are approximate to noise fluctuations in particle number, hence little change to the peak gain wavelength is anticipated. Below phase/gain currents of 100 mA, the gain begins to noticeably vary across the entire length of the cavity and grating currents need to be adjusted to counterbalance any wavelength shift because of this. The asymmetric distribution in gain agrees well with previous reports and is strongly dependent on photon loss in the grating region as well as the coupling factor [17], [36]. Sample linewidth values (inset) are plotted under uniform injection current for various cavity lengths. The best fit curve agrees well with previous reported experimental data and in general the linewidth behavior follows the well-known Schawlow-Townes formula for varying currents [6], [37]. Furthermore, a mode-hop free wavelength stability of 0.04 nm/5 GHz was verified over a temperature range of 8–47 C that extended the phase/gain current up to 350 mA [34]. That stability compares well with results reported for a 5-section digital-supermode DBR laser but now achieved through the simpler fabrication scheme for our laser [9], [38]. Although the gain distribution is non-uniform along the cavity, the variation in gain along the active region is comparable to that of 1st order active-passive DBRs as well as quarter-wavelength shifted DFB lasers with similarκL values yielding very good SMSR while minimizing spatial hole burning [39].
4. Conclusion
To conclude, we have used a traveling wave analysis to accurately account for the total wavelength tuning in a two-section laser by including changes due to thermal drift along with gain in the study. The analysis included a detailed comparison with a 2-section active-passive DBR laser using a similar grating design without gain. Altogether, the theoretical analysis matched well with the tuning behavior and the total wavelength shift taken from experiment. The thermal drift was found to dominate the wavelength tuning above threshold for increasing grating currents as well as the increased rate of mode hopping. For increasing phase/gain currents the wavelength tuning was found to be dominated by gain while thermal drift in the phase/gain section had little effect on the output wavelength found in the grating section. Together this behavior resulted in a unique method (via design) and region to athermally tune the laser, useful for WDM systems where overall one looks to balance the shift in wavelength due to gain/carrier density with the thermal drift in the grating section. This requires adjusting currents in only the phase/gain and grating sections simultaneously, notably simpler than a number of multi-section lasers.
References
[1] A. Abdullaev et al., “Improved performance of tunable single-mode laser array based on high-order slotted surface grating,” Opt. Exp., vol. 23, pp. 12072–12078, Apr. 2015.
[2] M. Nawrocka et al., “Widely tunable six-section semiconductor laser based on etched slots,” Opt. Exp., vol. 22, pp. 18949–18957, Aug. 2014.
[3] F. Bello, Q. Lu, A. Abdullaev, M. Nawrocka, and J. F. Donegan, “Linewidth and noise characterization for a partially-slotted, single mode laser,” IEEE J. Quantum Electron., vol. 50, no. 9, pp. 755–759, Sep. 2014.
[4] Q. Lu et al., “Two-section single mode lasers based on slots suitable for photonic integration,” Electron. Lett., vol. 48, pp. 945–946, Jul. 2012.
[5] G. P. Agrawal and N. K. Dutta, Semiconductor Lasers, 2nd ed. New York, NY, USA: Van-Nostrand, 1993.
[6] F. Bello et al., “Traveling wave analysis for a high-order grating, partially-slotted laser,” IEEE J. Quantum Electron., vol. 51, no. 11, Oct. 2015, Art. no. 2200305.
[7] Q. Lu, W. Guo, D. Byrne, and J. F. Donegan, “Design of slotted single-mode lasers suitable for photonic integration,”
IEEE Photon. Technol. Lett., vol. 22, no. 11, pp. 787–797, Jun. 2010.
[8] C. A. Brackett, “Dense wavelength division multiplexing networks: Principles and applications,” IEEE J. Sel. Areas
Commun., vol. 8, no. 6, pp. 948–964, Aug. 1990.
[9] W. Zhang, L. Shen, Y. Yang, and H. Chen, “Thermal management for a micro semiconductor laser based on thermo-electric cooling,” Appl. Therm. Eng., vol. 90, pp. 664–673, Jul. 2015.
[10] Y. Zhou and J. Yu, “Design optimization of thermoelectric cooling systems for applications in electronic devices,” Int. J.
Refrig., vol. 35, pp. 1139–1144, Dec. 2012.
[11] J. Zhu et al., “Athermal colorless c-band optical transmitter system for passive optical networks,” IEEE J. Lightw.
[12] S. H. Lee et al., “Self-configuring athermal tunable DS-DBR laser for passive optical networks,” in Proc. Int. Conf.
Lasers Electro-Opt., San Jose, CA, USA, May 2010, Paper CWN5.
[13] J. Bovington, S. Srinivasan, and J. E. Bowers, “Athermal laser design,” Opt. Exp., vol. 22, pp. 19357–19364, Aug. 2014. [14] Q. Lu, W. Guo, D. Byrne, and J. F. Donegan, “Analysis of slot characteristics in slotted single-mode semiconductor lasers using the 2-D scattering matrix method,” IEEE Photon. Technol. Lett., vol. 18, no. 24, pp. 2605–2607, Dec. 2006. [15] A. Abdullaev et al., “Linewidth characterization of integrable slotted single-mode lasers,” IEEE Photon. Technol. Lett.,
vol. 26, no. 22, pp. 2225–2228, Nov. 2014.
[16] M. Jabbari, M. K. Moravvej-Farshi, R. Ghayour, and A. Zarifkar, “XPM response of a chirped DFB-SOA all-optical flip-flop injected with an assist light at transparency,” IEEE J. Lightw. Technol., vol. 27, no. 13, pp. 2199–2207, Jul. 2009. [17] J. Park, X. Li, and W. Huang, “Performance simulation and design optimization of gain-clamped semiconductor optical
amplifiers based of distributed Bragg reflectors,” IEEE J. Quantum Electron., vol. 39, no. 11, pp. 1415–1423, Nov. 2003. [18] L. M. Zhang, S. F. Yu, M. C. Nowell, D. D. Marcenac, J. E. Carroll, and R. G. S. Plumb, “Dynamic analysis of radiation and side-mode suppression a second-order DFB laser using time-domain large-signal traveling wave model,” IEEE J.
Quantum Electron., vol. 30, no. 6, pp. 1389–1395, Jun. 1994.
[19] J. Teng et al., “Athermal silicon-on-insulator ring resonators by overlaying a polymer cladding on narrowed waveguides,”
Opt. Exp., vol. 17, pp. 14627–14633, Aug. 2009.
[20] F. G. Della Corte, G. Cocorullo, M. Iodice, and I. Rendina, “Temperature dependence of the thermo-optic coefficient of InP, GaAs, and SiC from room temperature to 600 K at the wavelength of 1.5μm,” Appl. Phys. Lett., vol. 77, pp. 1614–1616, Jul. 2000.
[21] Y. P. Varshni, “Temperature dependence of the energy gap in semiconductors,” Physica, vol. 34, pp. 149–154, Jan. 1967. [22] J. Masum, D. Ramoo, N. Balkan, and M. J. Adams, “Temperature dependence on spontaneous emission factor in
VCSELs,” IEE Proc. -Optoelectron., vol. 146, no. 6, pp. 245–251, Dec. 1999.
[23] W. Guo, D. C. Byrne, Q. Lu, B. Corbett, and J. F. Donegan, “Fabry–Perot laser characterization based on the amplified spontaneous emission spectrum and the Fourier series expansion method,” IEEE J. Sel. Topics. Quantum Electron., vol. 17, no. 5, pp. 1356–1363, Sep. 2011.
[24] J. Piprek, J. K. White, and A. J. SpringThorpe, “What limits the maximum power output of long-wavelength AlGaInAs/InP laser diodes,” IEEE J. Quantum Electron., vol. 38, no. 9, pp. 1253–1259, Sep. 2002.
[25] L. A. Coldren and S. W. Corzine, Diode Lasers and Photonic Integrated Circuits. New York, NY, USA: Wiley, 1995. [26] I. Mathews, A. Abdullaev, S. Lei, R. Enright, M. Wallace, and J. Donegan, “Reducing thermal crosstalk in tenc-hannel
tunable slotted-laser arrays,” Opt. Exp., vol. 23, pp. 23380–23393, Sep. 2015.
[27] M. J. Wallace, R. O’Reilly Meehan, R. Enright, F. Bello, and J. F. Donegan, “Athermal operation of a multi-section laser,” in Proc. Int. Conf. Optical Fiber Commun., 2017, Paper W2A.3.
[28] D. C. Byrne, W. H. Guo, Q. Lu, and J. F. Donegan, “A tunable semiconductor lased based on etched slots suitable for monolithic integration,” in Advances in Optical and Photonic Devices, K. Y. Kim Ed. London, U. K.: InTech, 2010. [29] X. Han, Q. Cheng, F. Liu, and Y. Yu, “Numerical analysis on thermal tuning efficiency and thermal stress of a thermally
tunable SG-DBR laser,” IEEE Photon. J., vol. 8, no. 3, Jun. 2016, Art. no. 1501512.
[30] A. Davies, S. Fan, R. Penty, and I. White, “Active wavelength control of tunable lasers for use in uncooled WDM systems,” in Proc. Int. Conf. Lasers Electro-Opt., Baltimore, MD, USA, 2003, pp. 1828–1829.
[31] S. Sakamoto, “Reduced temperature dependence of lasing wavelength in membrane BH-DFB lasers with polymer cladding layers,” IEEE Photon. Technol. Lett., vol. 19, no. 5, pp. 291–293, Mar. 2007.
[32] Y. Liu, “Uncooled DBR laser directly modulated at 3.125 Gb/s as athermal transmitter for low-cost WDM systems,”
IEEE Photon. Technol. Lett., vol. 17, no. 10, pp. 2026–2028, Oct. 2005.
[33] H. Wang and Y. Yu, “New theoretical model to analyze temperature distribution and influence of thermal transients of an SG-DBR laser,” IEEE J. Quantum Electron., vol. 48, no. 2, pp. 107–113, Feb. 2012.
[34] M. J. Wallace et al., “Athermal operation of multi-section slotted tunable lasers,” Opt. Exp., vol. 25, pp. 14426–14438, Jun. 2017.
[35] H. Ishii, H. Tanobe, F. Kano, Y. Tohmori, Y. Kondo, and Y. Yoshikuni, “Quasicontinuous wavelength tuning in super-structure-grating (SSG) DBR lasers,” IEEE J. Quantum Electron., vol. 32, no. 3, pp. 433–441, Mar. 1996.
[36] A. Abd El Aziz, W. P. Ng, Z. Ghassemlooy, M. H. Aly, R. Ngah, and M. F. Chiang, “Impact of signal wavelength on the semiconductor optical amplifier gain uniformity for high speed optical routers employing the segmentation model,” in
Proc. 10th Int. Conf. Inf. Sci. Signal Process. Appl., Kuala Lumpur, Malaysia, 2010, pp. 259–262.
[37] W. Sun, Q. Lu, W. Guo, M. Wallace, F. Bello, and J. F. Donegan, “Analysis of high-order slotted surface gratings by the 2-D finite-difference time-domain method,” IEEE J. Lightw. Technol., vol. 35, no. 1, pp. 96–102, Jan. 2017.
[38] A. J. O’Carroll, R. Phelan, B. Kelly, D. Byrne, L. P. Barry, and J. O’Gorman, “Wide temperature range 0<T<85°C narrow linewidth discrete mode laser diodes for coherent communications applications,” Opt. Exp., vol. 19, pp. B90–B95, Nov. 2011.