This Provisional PDF corresponds to the article as it appeared upon acceptance. Fully formatted PDF and full text (HTML) versions will be made available soon.
Detecting microRNA activity from gene expression data
BMC Bioinformatics 2010, 11:257 doi:10.1186/1471-2105-11-257 Stephen F Madden ([email protected])
Susan B Carpenter ([email protected]) Ian B Jeffery ([email protected])
Harry Bjorkbacka ([email protected]) Katherine A Fitzgerald ([email protected])
Luke A O'Neill ([email protected]) Desmond G Higgins ([email protected])
ISSN 1471-2105 Article type Research article Submission date 22 December 2009 Acceptance date 18 May 2010
Publication date 18 May 2010
Article URL http://www.biomedcentral.com/1471-2105/11/257
Like all articles in BMC journals, this peer-reviewed article was published immediately upon acceptance. It can be downloaded, printed and distributed freely for any purposes (see copyright
notice below).
Articles in BMC journals are listed in PubMed and archived at PubMed Central.
For information about publishing your research in BMC journals or any BioMed Central journal, go to http://www.biomedcentral.com/info/authors/
BMC Bioinformatics
© 2010 Madden et al. , licensee BioMed Central Ltd.
Detecting microRNA activity from gene expression
data
Stephen F Madden
1,3, Susan B Carpenter
2, Ian B Jeffery
1, Harry
Björkbacka
4, Katherine A Fitzgerald
2, Luke A O’Neill
2, Desmond G
Higgins
1§1
School of Medicine and Medical Science, Conway Institute, University College
Dublin, Belfield, Dublin 4, Ireland.
2
School of Biochemistry and Immunology, Trinity College Dublin, Dublin 2, Ireland.
3
National Institute for Cellular Biotechnology, Dublin City University, Glasnevin,
Dublin 9, Ireland.
4
Department of Clinical Sciences, Malmö University Hospital, Lund University,
Malmö, Sweden.
§
Corresponding author
Email addresses:
SFM: [email protected]
SBC: [email protected]
IBJ: [email protected]
KAF: [email protected]
LAON: [email protected]
Abstract
Background
MicroRNAs (miRNAs) are non-coding RNAs that regulate gene expression by
binding to the messenger RNA (mRNA) of protein coding genes. They control gene
expression by either inhibiting translation or inducing mRNA degradation. A number
of computational techniques have been developed to identify the targets of miRNAs.
In this study we used predicted miRNA-gene interactions to analyse mRNA gene
expression microarray data to predict miRNAs associated with particular diseases or
conditions.
Results
Here we combine correspondence analysis, between group analysis and co-inertia
analysis (CIA) to determine which miRNAs are associated with differences in gene
expression levels in microarray data sets. Using a database of miRNA target
predictions from TargetScan, TargetScanS, PicTar4way PicTar5way, and miRanda and
combining these data with gene expression levels from sets of microarrays, this
method produces a ranked list of miRNAs associated with a specified split in samples.
We applied this to three different microarray datasets, a papillary thyroid carcinoma
dataset, an in-house dataset of lipopolysaccharide treated mouse macrophages, and a
multi-tissue dataset. In each case we were able to identified miRNAs of biological
importance.
Conclusions
We describe a technique to integrate gene expression data and miRNA target
Background
MicroRNAs (miRNAs) are non-coding RNAs of approximately 22 nucleotides (nt) in
length that regulate gene expression through translational inhibition or mRNA
degradation [1, 2]. MiRNAs have been shown to play an important role in a wide
variety of biological processes such as apoptosis [3], cell proliferation [4] and
carcinogenesis [5]. Currently there are approximately 10,000 miRNAs from 115
species in miRBase, an online database and repository for miRNAs [6].
Computational miRNA target prediction is a key component in predicting
miRNA action. Although miRNAs are ~22nt in length, it has been shown that the ~6nt
5’ miRNA ‘seed’ region is the most crucial component for recognising and binding to
target sites in the 3’UTRs of genes [7]. Most miRNA target prediction programs
exploit this complementarity as well as the fact that true sites tend to be conserved
between related species. TargetScan, PicTar and miRanda all use cross species
conservation and different ways of measuring seed complementarity in their
prediction algorithms [8-11]. More recently there have been several prediction
methods based on filtering or processing the above databases e.g. MiRTif [12] and
NBmiRTar [13].
Gene expression microarrays are widely used to measure mRNA gene
expression levels in biological material. When differences are observed between two
conditions or between and experiment and a control, most of these differences are
likely to be due to differences in transcriptional activity. Some differences, however,
may also be due to the actions of miRNAs. Clearly, if a miRNA acts through
translational repression, then you do not expect to see this reflected in differences in
the mRNA levels of its targets. However, the effects of miRNA directed mRNA
predict miRNA activity. The basic principle is to search for overrepresentation of
miRNA target sites in sets of genes which are down regulated [14, 15]. In each case
they linked gene expression data and miRNA target predictions.
Arora and Simpson [14] used a combination of three different statistical tests to
detect miRNA signatures from gene expression data, the wilcoxon rank sum test, the 'rank
ratio test' [16], and the absolute expression t-test. They used these tests to identify tissue
specific miRNAs in both human and mouse, based primarily around TargetScan predictions.
Cheng and Li [15], use an enrichment score, where a ranked vector of genes is
compared to a ranked vector of degenerated binding score profiles in which miRNA
target prediction binding scores (from miRanda [11]), above and below a certain
threshold are set to 1 and 0 respectively. This is similar to the gene set enrichment
algorithm (GSEA) [17]. They identified the activity enhancement of miRNAs that
were transfected into HeLa cells and showed that their method performed better then
GSEA and the wilcoxon test.
In this paper we describe the use of a multivariate statistical technique called
co-inertia analysis (CIA) [18, 19] that can be used to link gene expression data and
miRNA target predictions from multiple programs to associate miRNAs with
particular diseases or conditions. This is a simple yet highly effective approach that
allows us to simultaneously analysis whole microarray datasets and databases of
miRNA target predictions, and visualise the data in linked two dimensional plots. This
allows us to visually identify miRNAs that are associated with particular groups in the
data. The analysis can be supervised using a discriminant technique called Between
Groups Analysis (BGA) [20] to focus on groups of arrays that are of a priori interest.
This approach is especially useful as there is no requirement for the filtering of gene
entire microarray dataset and cross reference/integrate it with miRNA prediction
databases without the use of user defined thresholds. CIA can be used in a supervised
mode where we specify groups in advance. It can also be used for data exploration in
an unsupervised mode. This is useful in cases where the samples show great
heterogeneity or are poorly characterised, as happens, for example, in many cancer
related datasets.
In this paper we use CIA to predict miRNA activity in three different gene
expression microarray datasets. The first is a papillary thyroid carcinoma (PTC)
dataset [21], where both mRNA microarray and miRNA expression data for the same
tissues, were available. This allows us to compare our predicted miRNAs against
those that are actually observed to be highly expressed in the tissue. The second is an
in-house dataset where we measured gene expression in mouse macrophages from
wild type versus MAL knockout mice, after treatment with lipopolysaccharide. The
results were confirmed by directly measuring the levels of predicted miRNAs, using
RT-PCR. The third dataset was that used by Arora and Simpson [14] to demonstrate
their miRNA prediction method.
Results
For each dataset we used CIA to simultaneously analyse mRNA gene expression data
and predicted miRNA target sites in the 3’ UTRs of the same genes. The starting point
is two tables: one table of gene expression values for g genes from n “samples” (n
microarrays) and one table giving the counts of predicted target sites for m miRNAs
in the same g genes. These tables (gxn and gxm) are analysed using Non-symmetric
Correspondence Analysis (NSC) and linked using CIA. The CIA analysis gives us
diagrams which can be visually inspected and show the relationships between gene
the occurrence of miRNA target sites. This is unsupervised and is used for data
exploration and visualisation purposes.
The analysis can be made supervised by applying Between Group Analysis
(BGA, [18, 22]) which takes class information and a NSC analysis and finds axes or
vectors that best discriminate pre-assigned groups by maximising the between group
variance. We use this technique to automate the analysis by specifying a
predetermined split in the microarray samples such as between those from normal and
cancer tissue, and so identify putative regulating miRNAs associated with the split.
The result of a BGA analysis on 2 groups is a ranked list of miRNAs.
Papillary Thyroid Cancer Dataset
We first applied CIA to find miRNAs associated with papillary thyroid cancer (PTC).
He et al [21] produced mRNA and miRNA gene expression data using microarrays
from PTC and adjacent unaffected tissue for 9 patients. CIA was applied to the 18
microarrays (9 PCT and 9 unaffected tissue), and the associated miRNA/gene
frequency tables. To simplify the comparison between our prediction technique and
the experimental data, only those miRNAs present on the miRNA microarray, were
analysed (see additional file 1: ‘MiRNAs on the OSU_CCC version 2.0 miRNA
microarray chip’ for details). The full analysis including all miRNAs predicted by the
target prediction software are available in additional file 2: ‘Results of the CIA for
PTC using all available miRNAs’. This includes miRNAs that were not tested by He
et al.[21] but may be potential novel miRNAs involved in PTC. Axes 1 and 2 of the
resultant CIA for the gene expression microarrays using the TargetScan gene/miRNA
frequency table can be seen in figure 1.
In figure 1a we see the PTC and the normal thyroid tissues highlighted in blue
homogeneous, than the PTC samples. Figure 1b, shows the miRNA motifs associated
with this split in the data. The most extreme motifs along each axis are labelled and
named. Motifs that are in the opposite orientation (direction from the origin) as the
PTC array samples are associated with PTC. This is counterintuitive, but reflects the
way in which miRNAs usually negatively regulate gene expression. Genes that are
upregulated in normal tissue may contain predicted binding sites for miRNAs
upregulated in PTC. In other words, these genes are subsequently down regulated in
the presence of these miRNAs. Those miRNAs highlighted in blue (221,
miR-222, and miR-146) are predicted to be upregulated in PTC, from visual inspection of
the plots.
In order to systematically identify the miRNAs specifically associated with the
split we are interested in (9 PTC vs 9 normal tissue), we performed a supervised
analysis of the data, combining CIA and BGA. Informally this is the equivalent of
plotting a line between the centres of the two groups in figure 1a and then finding the
equivalent line in the lower panel (with the same orientation from the origin) and
plotting the miRNA motifs along this. This is done automatically by BGA and
produces a single vector with the co-ordinate of every miRNA. This procedure was
repeated for each of the 5 miRNA/gene frequency tables, one for each of the 5
miRNA prediction programs. This returns 5 lists of miRNA motifs that are ranked
based on the motifs association with PTC. As each of these programs has distinct
characteristics, they returned different lists of motifs. To allow for this, we only
considered those motifs which ranked highly (in the top 20) with two or more of the
programs.
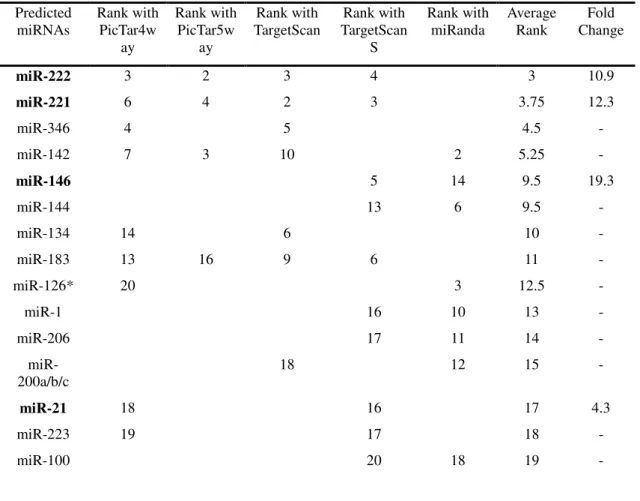
Table 1 shows the results of the comparison between PTC and normal thyroid
average ranking. The miRNAs that were identified by He et al. [21] are highlighted in
bold. Although we did not predict all miRNAs that were upregulated in PTC, we did
identify the four mostly highly upregulated, based on their analysis, 146,
miR-221, miR-222, miR-21 (upregulated 19.3 fold, 12.3 fold, 10.9 fold and 4.3 fold
respectively) (Table 1). MiR-146, miR-221 and miR-222, are an order of magnitude
more upregulated than any of the other miRNAs.
The above analysis was performed using computationally predicted target
sites. These predictions are noisy with a high false positive and false negative rate. In
order to test our approach with experimentally verified miRNA targets we also
applied CIA to data from miRecords [23].This is a resource which contains relatively
small numbers of high quality experimentally confirmed miRNA targets. MiRecords
currently contains target information for 90 miRNAs across 599 human genes.
Although this is not the only database for experimentally verified miRNA targets it is
comprehensive, well curated and comparable to other databases such as Tarbase [24].
Again this was used to find miRNAs associated with PTC. Axes 1 and 2 of the
resultant CIA can be seen in figure 2. In figure 2a we can see a plot of the 18 samples.
The plot is similar to figure 1a in that the more homogeneous normal samples are
clustered together (red), while the PTC samples (blue) are more scattered. Figure 2b
shows the miRNAs associated with the split in the data. To the right of the figure,
along the horizontal axis, we can see miR-221 and miR-222 highlighted in blue.
Again these motifs are in the opposite orientation relative to the origin of the PTC
samples in figure 2a, and are predicted to be upregulated in PTC. Performing a
supervised analysis on this dataset using BGA confirms that miR-221 and miR-222
This analysis confirms that CIA is capable of integrating both predicted and
experimentally confirmed miRNA target information with gene expression data.
Ideally it would be preferable to focus on experimental rather than predicted miRNA
data, but at present this is not feasible as currently available miRNA target data are
limited. For example, there are no confirmed targets of miR-146 in miRecords. This
is the most highly upregulated miRNA in the PTC data set, and therefore we would
only be able to detect this miRNA using target predictions.
LPS Treated Macrophages Dataset
In this dataset, bone marrow derived macrophages from wild type (WT) and MAL
knockout (MALKO) mice were treated with lipopolysaccharide (LPS). MAL
(MyD88-adaptor-like) is part of the Toll-like receptor (TLR) signalling pathway, a key
signalling molecule of the innate immune response [25]. The innate immune response
is triggered in the presence of the Gram-negative bacterial product LPS.
MAL-deficient mice are known to be defective in TLR2 and TLR4 signalling but show
normal signalling with other members of the TLR family [26]. The aim of this
experiment was the identification of miRNAs whose activation is independent of
MAL i.e. is upregulated in both MALKO and WT macrophages after exposure to
LPS. In total there were four replicates of LPS treated WT arrays, and four replicates
of LPS treated MALKO arrays.
As with the thyroid cancer dataset, supervised CIA was performed using BGA
for each of the 5 gene/miRNA frequency tables, on the two datasets to identify
MAL-independent miRNAs. This returns 5 lists of miRNAs that are ranked based on their
association with LPS treated cells. The lists vary depending on the individual
characteristics of the prediction programs used. The resulting axes are shown in figure
based on their association with LPS treated macrophages. These plots illustrate the
overlap between the WT and the MALKO results i.e. those miRNAs that are MAL
independent. They also demonstrate the variation between the different miRNA target
prediction programs. Again we selected those motifs which ranked highly (in the top
20) with two or more of the programs, as being most likely to be true results. The
results can be seen in table 2 for both datasets and are highlighted in blue in figures 3
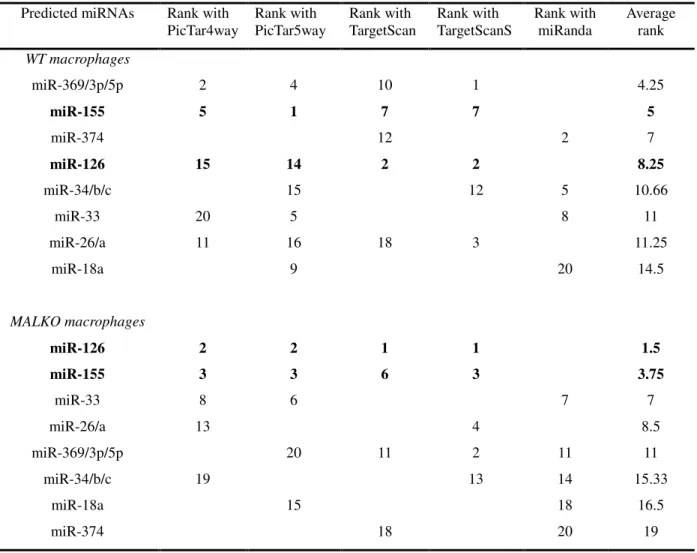
and 4. Table two only contains those miRNAs that are MAL independent, and gives
the ranking for each of these miRNAs. From this table miR-155 and miR-126 were
selected for experimental confirmation of their induction by LPS using quantitative
RT-PCR. These miRNAs were chosen as they were predicted to be upregulated in
both MALKO and WT by four of the programs, and they had a very low average
ranking in the two datasets. The consistently low ranking across all four programs in
both MALKO and WT cells suggested that these predictions were the most likely to
be correct and were therefore chosen as the most suitable miRNAs for further
experimental confirmation.. In figure 5 we can see that miR-155 is 23 fold and 25 fold
upregulated in WT and MALKO LPS treated macrophages respectively. This is based
on the expression of miR-155 relative to time zero, in macrophages extracted from
MAL-deficient mice, after being treated with LPS for two hours. MiR-155 has been
previously shown to be an LPS inducible miRNA [27], and this analysis confirms that
its induction is also MAL independent. Figure 6 shows that miR-126 is 5 fold and 2
fold upregulated in WT and MALKO macrophages respectively. The upregulation of
the miRNA in this case is not as strong as with miR-155 but is still consistent with the
Comparison with Arora and Simpson
Previously Arora and Simpson developed an approach to detect the effect of particular
miRNAs on their target mRNA gene expression levels [14]. As with our approach,
they used gene expression data and publicly available miRNA target prediction data.
Their analyses were based primarily around TargetScan target predictions (version
3.1). They used three statistical tests to detect miRNA signatures from gene
expression data, the wilcoxon rank sum test, the 'rank ratio test' [16], and the absolute
expression t-test. They used these techniques for the identification of tissue specific
miRNAs, using data from a number of sources including GEO series GSE3256
[28-30]. This dataset comprised 353 microarrays spanning 65 normal human tissues.
Arora and Simpson focused on a comparison of 8 tissue types using one
representative microarray from each tissue type (there were multiple microarrays for
each tissue type). Extensive literature mining was used to identify evidence of tissue
specific expression profiles of the miRNAs. This evidence included cloning, Northern
hybridization and expressed sequence tag mapping [14].
We applied unsupervised CIA to the same 8 tissues used by Arora and
Simpson [14]: midbrain, heart atrium, kidney medulla, liver, lung, ovary, skeletal
muscle, and testis. In total there were 29 microarrays, as we included all microarrays
from each tissue in our analysis rather than one representative microarray. These were
combined with the 5 miRNA/gene frequency tables in the unsupervised CIA. Axes 1
and 2 of the resultant CIA for the PicTar5way table can be seen in figure 7a. Visual
inspection of this plot reveals a number of interesting splits in the data.
In figure 7a, the skeletal muscle (red) is separated from the other tissues along
the vertical axis. Figure 7b, shows the miRNAs associated with each tissue type. As
origin) as the skeletal muscle, that are associated with skeletal muscle. This can be
seen in the case of miR-1/206 (highlighted in red) located in the centre bottom of
figure 7b. This is in the opposite orientation relative to the origin and is a known
muscle specific miRNA [31]. This miRNA was not identified by Arora and Simpson
as being associated with skeletal muscle, but was associated with heart tissue (grey in
figure 7a). Another major split in this data, is that of the midbrain tissue (blue) along
the horizontal axis. Again it is the miRNAs in figure 7b that are in the opposite
direction relative to the origin that are associated with brain tissue. These include
miR-196a/b and miR-29a/c. These miRNAs were also identified by Arora and
Simpson, although only miR-29a/c has been previously characterised in brain tissue
[32, 33].
In order to systematically identify tissue specific miRNAs we compared
individual tissues against the rest e.g. the 3 skeletal muscle microarrays vs. the rest.
As before, this supervised CIA was performed using BGA, and consistency between
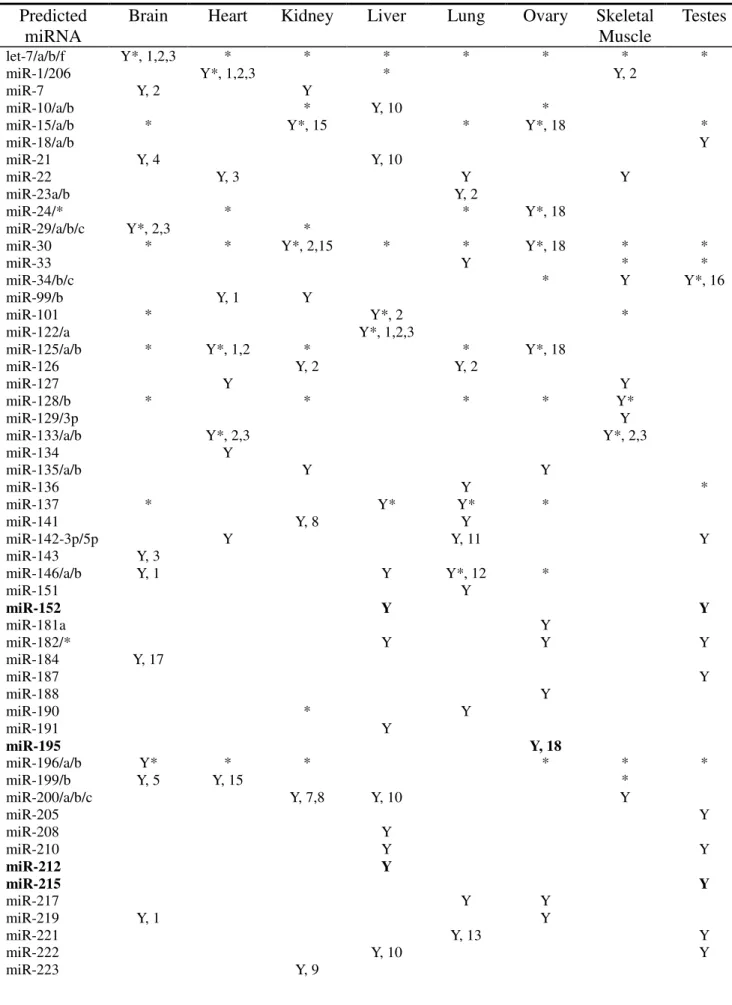
miRNA prediction programs was required. Table 3 summaries the miRNAs we
identified, and the overlap between our analysis and that of Arora and Simpson, as
well as information on available experimental data. As can be seen from the table,
there is a great deal of overlap between the two datasets. For example, a known
muscle specific miRNA, miR-1/206, was identified by both techniques in the heart.
However, only our technique identified miR-1/206 in skeletal muscle, while we did
not identify brain specific miR-124. A direct comparison between the two approaches
is difficult as we used more recent miRNA target predictions and a greater number of
microarrays were tested (we used more than just a representative microarray for each
tissue). However, approximately a quarter of the predictions overlap between the two
both of the techniques roughly half the results are supported by literature review
(~44% vs 47%). This suggests that although neither approach is exhaustive they are
complementary.
Discussion
In this paper we describe a method for inferring the action of miRNAs by integrating
the information provided by miRNA target prediction programs with mRNA gene
expression data. This method can be used to predict the activity of a miRNA when
there is down regulation of multiple potential target genes for that miRNA.
A drawback of this and similar approaches is that it assumes that mRNA
degradation instead of translation repression is the primary mode of action of the
miRNAs. This will only be true for some miRNAs. MiRNAs which act through
repression will be undetectable using our methodology. Instead, the action of the
miRNA might be inferred through correlating genomic locus with co-expression of
nearby genes [34, 35].
A further drawback of the current method is that it relies on predictions of
target sites in potential target mRNAs. Such predictions will contain false positives as
well as false negatives and it is often difficult to strike a balance between sensitivity
and specificity. Nonetheless, we have shown the current method does provide good
quality predictions of miRNA activity. In the case of PTC, the method was able to
predict miRNAs which had been experimentally measured as showing significant
differential expression. In the case of the MAL knockout data set, we were able to
verify predicted miRNAs using RT-PCR. In the third dataset, we obtained
comparable results to the method of Arora and Simpson [14] whose method has
A major advantage of this method is that no pre-processing of gene expression
data, such as the generation of clusters or gene lists, is required. This is in marked
contrast to most other methods such as those based on Gene Set Enrichment Analysis
(GSEA) [17]. The method can take an entire microarray data set and cross
reference/integrate it with miRNA prediction databases. We also use multiple miRNA
target gene predictions. This allows us to use consistency across target prediction
programs and so minimise the effect of weaknesses in any one program, while
maximising the number of miRNAs that can be investigated. The congruence between
the sets of predicted targets of miRNA sets can often be weak, particularly between
TargetScan/PicTar vs. miRanda. Even the confirmed targets from miRecords [23] may
often be context specific due to tissue specific expression and 3’ UTR splice variants.
Methods in the past have often used just one of the predicted databases [14, 15] and
so it may be assumed the results would vary depending on the choice of miRNA
target prediction software used. By using multiple miRNA target gene predictions we
can use consistency across target prediction programs to maximise the reproducibility
of the analysis, while retaining a large proportion of the miRNAs. Creighton et al [36]
also developed a technique that facilitated the use of multiple target prediction
algorithms, to associate miRNAs with gene expression profiles of interest. However,
they required the user to specify a predefined list of genes, while our approach does
not require any pre-processing of gene expression data.
The method can also be used to visualise and analyse multiple groups of
arrays. In the data sets that we tested in this paper, we only compared two groups at a
time, in order to compare the method with other methods. The visualisations are
powerful as they allow simple graphical representations of highly complex datasets
Conclusions
In this study we have shown how CIA can be used to integrate gene expression data
and miRNA target prediction data from multiple sources to predict miRNAs
associated with particular diseases or conditions. Although this is not the first attempt
to predict miRNA expression profiles using gene expression data, we believe that it is
complementary to other currently available methods, and would be a useful addition
to the field. The method allows clear visualisation and data exploration of complex
datasets. It can be used in a supervised or un-supervised mode and can detect the
activity of miRNAs which have been experimentally measured as being expressed.
Methods
Co-inertia analysis
To study two linked data tables simultaneously, we used CIA,a multivariate coupling
approach that was first introduced to study ecologicaldata [18, 19]. In this case the
two linked tables are expression data, and a miRNA frequency table on the same set
of genes. We treat these as two sets of measurements on the same objects, the genes.
We have previously used this method to compare gene expression data with
transcription factor binding site information [37], and proteomics data [38]. CIA is
used in conjunction with an ordination method such as non-symmetric
correspondence analysis (NSC) or principal components analysis (PCA). These
methods summarise a data table in a low dimensional space, by projecting the samples
onto axes which maximise the variances of the coordinates of the projected points.
CIA performs two simultaneous NSCs on the two linked tables, and identifies pairs of
axes, from the two datasets which are maximally covariant [37].
BGA is a supervised classification method which can be used in combination
samples rather than individual samples [20, 22]. First a normal NSC is performed,
BGA then finds the linear combination of the NSC axes that maximizes
between-group varianceand minimizes within-group variance, for specified groups.
BGA can be used to perform a supervised NSC on the gene expression data by
directing the CIA to find the maximum co-variance between the gene expression
difference between groups of samples and the miRNA-gene target frequency tables.
We have two data tables. One table gives genes by target sites and the second genes
by gene expression data. Two simultaneous NSCs are performed on the two tables
using BGA. We find two resultant axes, one for each dataset with minimal between
group variance. This forcesthe analysis to rank arrays or tissues along a first axis that
best discriminates the two groups of samples (e.g. PTC versus normal thyroid tissue)
and a second axis with ranked miRNAs. The two axes are found as the ones that
maximizetheir covariance. The miRNAs that are upregulated in a group of samples
are those that are at the opposite end of the miRNA axis to those samples. For
example, genes upregulated in normal thyroid, contain binding sites for miRNAs that
are upregulated in PTC (e.g. miR-221). Therefore miR-221 is at the opposite end of
the miRNA axes to PTC on the sample axes. This is indicative of the decrease in gene
expression caused by the miRNA that we are attempting to identify. Thus, for each
split in the data thatwe specify using BGA, we get a ranked list of miRNA motifs.
We get a separate ranked list of motifs for each of the miRNA prediction
methods used. We used five prediction methods (see below). The results are combined
using consistency among the prediction programs. To be considered a true result a
motif was required to be highly ranked (top 20) by two or more programs. This
produces a single ranked list of miRNAs expressed in a particular disease or
source R package. MADE4 can be downloaded freelyfrom the Bioconductor web site
(www.bioconductor.org). All the scripts used are available upon request from the
authors.
MiRNA target prediction
Five different miRNA target prediction programs were used, TargetScan and
TargetScanS [8, 9], PicTar4way and Pictar5way [10], and miRanda [11]. Each of
these programs search for complementarity to the miRNA seed region in the 3’UTRs
of mRNAs and incorporate cross species conservation into their target prediction
calculations. The miRNA target prediction data were downloaded from the TargetScan
website http://www.targetscan.org/ (version 4.1), the UCSC genome browser tract for
pictar4way and pictar5way (http://genome.ucsc.edu/), and from miRBase for
miRanda (http://microrna.sanger.ac.uk/sequences/ [6]). The overlap between the target
lists varied depending on the number of miRNAs being examined and the number of
predicted target genes. Two variations of the TargetScan program were used,
TargetScan and TargetScanS. TargetScan predicted 7,611 target genes for 195
miRNAs, while the more stringent TargetScanS predicted 4,769 target genes for 90
miRNAs. Two version of PicTar were used, PicTar4way which incorporates
conservation across 4 species and predicted 9,151 target genes for 178 miRNAs and
PicTar5way which uses conservation across 5 species and predicts 3,454 target genes
for 130 miRNAs. MiRanda is the least selective of the prediction programs used,
predicting 17,759 target genes for 470 miRNAs. We used these data to generate a
gene/miRNA frequency table of counts of predicted targets per gene, for each of the
MiRecords Data
Experimentally validated miRNA target information was downloaded from
miRecords (http://mirecords.biolead.org/). As with the miRNA prediction programs
this information was used to construct a gene/miRNA frequency table of counts of
miRNA targets per gene. In total miRecords contains data for 90 miRNAs targeting
599 genes
Gene Expression data
The Papillary Thyroid Cancer dataset
The thyroid cancer mRNA expression data were obtained from He et al. [21]. The
data were downloaded from http://www.ncbi.nlm.nih.gov/projects/geo/ (Gene
Expression Omnibus (GEO), accession number: GSE3467) as raw data files (.cel
files). Gene expression values were calledusing the robust multichip average method
[40] and data were quantile normalized using the Bioconductor package, affy.
Affymetrix Human Genome U133 Plus 2.0 Array containing 54,675 Affymetrix
probes was used. The RefSeq ids that correspondedto the Affymetrix probes were
obtained using the hgu133plus2 annotationlibrary. Probes that hit multiple genes were
filtered out. If there were multipleprobes for the same gene, the probes were averaged
for that gene. The intersection between the target gene prediction software and the
hgu133plus2 gene set was as follows, TargetScan: 5,355genes, TargetScanS: 3,311
genes, miRanda: 10,819 genes, PicTar4way: 4,781 genes, and PicTar5way: 1,693
genes. In addition gene expression information was available for 385 of the genes in
miRecords.
The Tissue Dataset used by Arora and Simpson
Roth et al. [28] generated gene expression profiles for 65 normal adult human tissues.
In total this dataset comprises 353 microarrays (GEO series GSE3526). These included
atrium, kidney medulla, liver, lung, ovary, skeletal muscle, and testis). Although Arora
and Simpson only chose a representative sample for each tissue type we included all
the available microarrays for each tissue type in our analysis. The tissue expression
data were also downloaded from the GEO database in the form of raw data files. The
GEO sample and platform accession numbers can be found in additional file 3: ‘GEO
sample and platform accession numbers’. The same normalisation and analysis
procedure was used as for the PTC data. Affymetrix Human Genome U133 Plus 2.0
Array containing 54,675 Affymetrix probes was used. The intersection between the
gene prediction software and the hgu133plus2 gene set was the same as above.
LPS Treated Macrophage Dataset
Materials: MAL-deficient mice were a gift from S.Akira (Osaka, Japan) [26] and
were backcrossed onto a C57BL/6 background for approximately 9 generations. LPS
derived from E.Coli strain O111:b4 was purchased from Sigma, dissolved in
deoxycholate, and re-extracted by phenol:chloroform as previously described [41].
Cell culture and RNA isolation: Mice were anaesthetized with CO2 inhalation and
then killed by cervical dislocation. Bone marrow was isolated from 6- to 8-week-old
C57BL/6 wild type and MAL-deficient mice. Macrophages from these marrows were
cultured in DMEM media supplemented with 10% FBS and 15% L929 conditioned
media (a source for colony-stimulating factor CSF-1) for 10 days. For mRNA
expression studies by quantitative reverse transcriptase PCR (QRT-PCR) and
microarray analysis in bone marrow derived macrophages (BMDMs), cells were
treated at day 10 ex vivo for 2 hours with 10 ng/ml lipopolysaccharide and their gene
expression profiles were compared with that of mock treated cells incubated for the
same time. Cells from four individual mice for each genotype were used, and each
isolated using an RNeasy extraction kit (Qiagen, Valencia, CA) according to the
manufacturer’s recommendations. RNA quality was assessed using the 2100
Bioanalyzer (Agilent Teachologies, Palo Alto, CA).
Microarray analysis. The Operon Mus musculus ver. 1.1 probe set (Qiagen)
consisting of over 21,000 oligonucleotide probes (70-mers) was printed in the
Massachusetts General Hospital (Cambridge, MA) microarraycore facility using an
Omnigrid 100 (GeneMachines, San Carlos, CA) on CodeLink activated slides
(Amersham, Piscataway, NJ).RNA was reverse transcribed and differentially labelled
withCy3 and Cy5 dyes (Amersham) using the Atlas PowerScript fluorescentlabeling
kit (BD Biosciences, Palo Alto, CA). Labelled samples were hybridized overnight
using an automated hybridization station(Genomic Solutions; Perkin-Elmer, Boston,
MA). Fluorescent imagesfrom the arrays were acquired using a microarray scanner
and its accompanying software (GenePix 4000B microarray scanner; Axon
Instruments, Union City, CA). Data was stored and furtherquality controlled using the
GeneTraffic software (Iobion Informatics,La Jolla, CA) and the BioArray Software
Environment (BASE) [42]. In total there were 4 replicates for LPS treated WT cells
and LPS treated MALKO cells.
The raw gene expression data (the genepix .gpr files) were read, background
corrected with the “normexp” option and quantile normalised, using the Bioconductor
package limma [43]. In the two datasets, the pre and post LPS treated mRNA is
hybridised to the same array. This is a common experimental design for two colour
arrays. For our analysis we wished to compare two groups (e.g. WT vs LPS treated
WT cells), and identify which miRNAs are associated with each group using CIA. To
do this it is necessary to analyse the red and green channel intensities separately i.e. as
than their log-ratios. Details for performing this analysis are available in the limma
user guide [43] and relevant scripts are available upon request. The intersection
between the target prediction software and the microarray gene set was as follows,
TargetScan: 4,310 genes, TargetScanS: 2,879 genes, miRanda: 9,444 genes,
PicTar4way: 5,205 genes, and PicTar5way: 2,000 genes.
RT-PCR: RT-PCR was performed using TaqMan Reverse Transcription reagents
(Applied Biosystems, Foster City, CA) Kit following manufacturer’s protocol and
assayed on the Applied Biosystems 7900HT. The primers for miR155, miR-126 and
U6 were obtained from Applied Biosystems. Data was presented as fold differences
relative to time 0 and were based on calculations of 2(−∆∆Ct). Ubiquitously expressed
U6 small nuclear RNA was used for normalization.
Authors' contributions
SFM assembled the data and software, carried out the analyses, analysed the results
and drafted the manuscript. SBC and IBJ assisted in the analysis, the generation of
figures and the drafting of the manuscript. SBC, HB, KAF preformed the microarray
experiment for the LPS treated macrophage dataset and the subsequent RT-PCR
confirmations. DGH and LAON conceived the project, assisted in the design of the
study and in drafting of the manuscript. All authors read and approved the final
manuscript.
Acknowledgements
The authors would like to acknowledge Frederick Sheedy for his technical assistance
with the real time PCR. The authors wish to thank the Irish Health Research Board,
and Science Foundation Ireland, Strategic Research Cluster award to Molecular
References
1. Du T, Zamore PD: microPrimer: the biogenesis and function of microRNA.
Development 2005, 132:4645-4652.
2. Bagga S, Bracht J, Hunter S, Massirer K, Holtz J, Eachus R, Pasquinelli AE:
Regulation by let-7 and lin-4 miRNAs results in target mRNA degradation.
Cell 2005, 122:553-563.
3. Xu P, Guo M, Hay BA: MicroRNAs and the regulation of cell death. Trends in Genetics 2004, 20:617-624.
4. Cheng AM, Byrom MW, Shelton J, Ford LP: Antisense inhibition of human miRNAs and indications for an involvement of miRNA in cell growth and apoptosis. Nucl. Acids Res. 2005, 33:1290-1297.
5. Calin GA, Sevignani C, Dumitru CD, Hyslop T, Noch E, Yendamuri S, Shimizu M, Rattan S, Bullrich F, Negrini M, Croce CM: Human microRNA genes are frequently located at fragile sites and genomic regions involved in cancers.
Proceedings of the National Academy of Sciences of the United States of America
2004, 101:2999-3004.
6. Griffiths-Jones S, Grocock RJ, van Dongen S, Bateman A, Enright AJ: miRBase: microRNA sequences, targets and gene nomenclature. Nucl. Acids Res. 2006,
34:D140-144.
7. Kiriakidou M, Nelson PT, Kouranov A, Fitziev P, Bouyioukos C, Mourelatos Z, Hatzigeorgiou A: A combined computational-experimental approach predicts human microRNA targets. Genes Dev 2004, 18:1165-1178.
8. Lewis BP, Shih I, Jones-Rhoades MW, Bartel DP, Burge CB: Prediction of mammalian microRNA targets. Cell 2003, 115:787-798.
9. Lewis BP, Burge CB, Bartel DP: Conserved seed pairing, often flanked by adenosines, indicates that thousands of human genes are microRNA targets.
Cell 2005, 120:15-20.
11. Enright AJ, John B, Gaul U, Tuschl T, Sander C, Marks DS: MicroRNA targets in Drosophila. Genome Biol 2003, 5:R1.
12. Yang Y, Wang Y, Li K: MiRTif: a support vector machine-based microRNA target interaction filter. BMC Bioinformatics 2008, 9:S4.
13. Yousef M, Jung S, Kossenkov AV, Showe LC, Showe MK: Naive Bayes for MicroRNA Target Predictions Machine Learning for MicroRNA Targets.
Bioinformatics 2007:btm484.
14. Arora A, Simpson D: Individual mRNA expression profiles reveal the effects of specific microRNAs. Genome Biology 2008, 9:R82.
15. Cheng C, Li LM: Inferring microRNA activities by combining gene expression with microRNA target prediction. PLoS ONE 2008, 3:e1989.
16. Yu Z, Jian Z, Shen S, Purisima E, Wang E: Global analysis of microRNA target gene expression reveals that miRNA targets are lower expressed in mature mouse and Drosophila tissues than in the embryos. Nucl. Acids Res. 2007,
35:152-164.
17. Subramanian A, Tamayo P, Mootha VK, Mukherjee S, Ebert BL, Gillette MA, Paulovich A, Pomeroy SL, Golub TR, Lander ES, Mesirov JP: Gene set
enrichment analysis: A knowledge-based approach for interpreting genome-wide expression profiles. Proceedings of the National Academy of Sciences of the United States of America 2005, 102:15545-15550.
18. Dolédec S, Chessel D: Co-inertia analysis: an alternative method for studying species - environment relationships. Freshwater Biology 1994, 31:294, 277.
19. Dray S, Chessel D, Thioulouse J: Co-inertia analysis and the linking of ecological data tables. Ecology 2003, 84:3078-3089.
20. Dolédec S, Chessel D: Rhythmes saisonniers et composantes stationelles en milieu aquatique I—Description d'un plan d'observations complet par projection de variables. Acta Oecologica Oecologica Generalis 1987, 8 :403-426.
microRNA genes in papillary thyroid carcinoma. Proc. Natl. Acad. Sci. U.S.A
2005, 102:19075-19080.
22. Culhane AC, Perrière G, Considine EC, Cotter TG, Higgins DG: Between-group analysis of microarray data. Bioinformatics 2002, 18:1600-1608.
23. Xiao F, Zuo Z, Cai G, Kang S, Gao X, Li T: miRecords: an integrated resource for microRNA-target interactions. Nucleic Acids Res 2009, 37:D105-110.
24. Papadopoulos GL, Reczko M, Simossis VA, Sethupathy P, Hatzigeorgiou AG:
The database of experimentally supported targets: a functional update of TarBase. Nucl. Acids Res. 2009, 37:D155-158.
25. O'Neill LAJ, Bowie AG: The family of five: TIR-domain-containing adaptors in Toll-like receptor signalling. Nat Rev Immunol 2007, 7:353-364.
26. Yamamoto M, Sato S, Hemmi H, Sanjo H, Uematsu S, Kaisho T, Hoshino K, Takeuchi O, Kobayashi M, Fujita T, Takeda K, Akira S: Essential role for TIRAP in activation of the signalling cascade shared by TLR2 and TLR4.
Nature 2002, 420:324-329.
27. Ruggiero T, Trabucchi M, De Santa F, Zupo S, Harfe BD, McManus MT, Rosenfeld MG, Briata P, Gherzi R: LPS induces KH-type splicing regulatory protein-dependent processing of microRNA-155 precursors in macrophages.
FASEB J 2009, 23:2898-2908.
28. Roth R, Hevezi P, Lee J, Willhite D, Lechner S, Foster A, Zlotnik A: Gene expression analyses reveal molecular relationships among 20 regions of the human CNS. neurogenetics 2006, 7:67-80.
29. Barrett T, Troup DB, Wilhite SE, Ledoux P, Rudnev D, Evangelista C, Kim IF, Soboleva A, Tomashevsky M, Edgar R: NCBI GEO: mining tens of millions of expression profiles--database and tools update. Nucl. Acids Res. 2007,
35:D760-765.
30. Edgar R, Domrachev M, Lash AE: Gene Expression Omnibus: NCBI gene expression and hybridization array data repository. Nucleic Acids Res 2002,
31. Zhao Y, Samal E, Srivastava D: Serum response factor regulates a muscle-specific microRNA that targets Hand2 during cardiogenesis. Nature 2005,
436:214-220.
32. Lagos-Quintana M, Rauhut R, Yalcin A, Meyer J, Lendeckel W, Tuschl T:
Identification of tissue-specific microRNAs from mouse. Curr. Biol 2002,
12:735-739.
33. Sempere LF, Freemantle S, Pitha-Rowe I, Moss E, Dmitrovsky E, Ambros V:
Expression profiling of mammalian microRNAs uncovers a subset of brain-expressed microRNAs with possible roles in murine and human neuronal differentiation. Genome Biol 2004, 5:R13.
34. Wang D, Lu M, Miao J, Li T, Wang E, Cui Q: Cepred: Predicting the Co-Expression Patterns of the Human Intronic microRNAs with Their Host Genes. PLoS ONE 2009, 4:e4421.
35. Baskerville S, Bartel DP: Microarray profiling of microRNAs reveals frequent coexpression with neighboring miRNAs and host genes. RNA 2005, 11 :241-247.
36. Creighton CJ, Nagaraja AK, Hanash SM, Matzuk MM, Gunaratne PH: A bioinformatics tool for linking gene expression profiling results with public databases of microRNA target predictions. RNA 2008, 14:2290-2296.
37. Jeffery IB, Madden SF, McGettigan PA, Perriere G, Culhane AC, Higgins DG:
Integrating transcription factor binding site information with gene expression datasets. Bioinformatics 2007, 23:298-305.
38. Fagan A, Culhane AC, Higgins DG: A multivariate analysis approach to the integration of proteomic and gene expression data. PROTEOMICS 2007,
7:2162-2171.
39. Culhane AC, Thioulouse J, Perrière G, Higgins DG: MADE4: an R package for multivariate analysis of gene expression data. Bioinformatics 2005, 21 :2789-2790.
41. Hirschfeld M, Ma Y, Weis JH, Vogel SN, Weis JJ: Cutting edge: repurification of lipopolysaccharide eliminates signaling through both human and murine toll-like receptor 2. J. Immunol 2000, 165:618-622.
42. Saal LH, Troein C, Vallon-Christersson J, Gruvberger S, Borg A, Peterson C:
BioArray Software Environment (BASE): a platform for comprehensive management and analysis of microarray data. Genome Biol 2002,
3:SOFTWARE0003.
43. Smyth GK: Linear models and empirical bayes methods for assessing differential expression in microarray experiments. Stat Appl Genet Mol Biol
2004, 3:Article3.
44. Gu J, He T, Pei Y, Li F, Wang X, Zhang J, Zhang X, Li Y: Primary transcripts and expressions of mammal intergenic microRNAs detected by mapping ESTs to their flanking sequences. Mammalian Genome 2006, 17:1033-1041.
45. Sathyan P, Singh G, Eong KA, Raman GV, Sathyan P, Prashanth S:
Suprachoroidal hemorrhage following removal of releasable suture after combined phacoemulsification-trabeculectomy. J Cataract Refract Surg 2007,
33:1104-1105.
46. You-Jia, Xiao H: Identification and target prediction of miRNAs specifically expressed in rat neural tissue. BMC Genomics 2009, 10:214.
47. Chan JA, Krichevsky AM, Kosik KS: MicroRNA-21 Is an Antiapoptotic Factor in Human Glioblastoma Cells. Cancer Res 2005, 65:6029-6033.
48. Gregory PA, Bert AG, Paterson EL, Barry SC, Tsykin A, Farshid G, Vadas MA, Khew-Goodall Y, Goodall GJ: The miR-200 family and miR-205 regulate epithelial to mesenchymal transition by targeting ZEB1 and SIP1. Nat Cell Biol 2008, 10:593-601.
49. Nakada C, Matsuura K, Tsukamoto Y, Tanigawa M, Yoshimoto T, Narimatsu T, Nguyen LT, Hijiya N, Uchida T, Sato F, Mimata H, Seto M, Moriyama M:
Genome-wide microRNA expression profiling in renal cell carcinoma: significant down-regulation of miR-141 and miR-200c. The Journal of Pathology 2008, 216:418-427.
50. Anglicheau D, Sharma VK, Ding R, Hummel A, Snopkowski C, Dadhania D, Seshan SV, Suthanthiran M: MicroRNA expression profiles predictive of
51. Ladeiro Y, Couchy G, Balabaud C, Bioulac-Sage P, Pelletier L, Rebouissou S, Zucman-Rossi J: MicroRNA profiling in hepatocellular tumors is associated with clinical features and oncogene/tumor suppressor gene mutations.
Hepatology 2008, 47:1955-1963.
52. Liu X, Sempere L, Galimberti F, Freemantle S, Black C, Dragnev K, Ma Y, Fiering S, Memoli V, Li H, Direnzo J, Korc M, Cole C, Bak M, Kauppinen S, Dmitrovsky E: Uncovering Growth-Suppressive MicroRNAs in Lung Cancer.
Clin Cancer Res 2009, 15:1183, 1177.
53. Raponi M, Dossey L, Jatkoe T, Wu X, Chen G, Fan H, Beer DG: MicroRNA Classifiers for Predicting Prognosis of Squamous Cell Lung Cancer. Cancer Res 2009, 69:5776-5783.
54. Navarro A, Marrades RM, Viñolas N, Quera A, Agustí C, Huerta A, Ramirez J, Torres A, Monzo M: MicroRNAs expressed during lung cancer development are expressed in human pseudoglandular lung embryogenesis. Oncology
2009, 76:162-169.
55. Lagos-Quintana M, Rauhut R, Meyer J, Borkhardt A, Tuschl T: New microRNAs from mouse and human. RNA 2003, 9:175-179.
56. Naraba H, Iwai N: Assessment of the microRNA system in salt-sensitive hypertension. Hypertens. Res 2005, 28:819-826.
57. Yu Z, Raabe T, Hecht NB: MicroRNA Mirn122a reduces expression of the posttranscriptionally regulated germ cell transition protein 2 (Tnp2)
messenger RNA (mRNA) by mRNA cleavage. Biol. Reprod 2005, 73:427-433.
58. Nomura T, Kimura M, Horii T, Morita S, Soejima H, Kudo S, Hatada I: MeCP2-dependent repression of an imprinted miR-184 released by depolarization.
Figures
Figure 1 – Unsupervised CIA of the papillary thyroid carcinoma dataset.
Axis 1 (horizontal) and 2 (vertical) of the unsupervised CIA for the PTC dataset. The gene/miRNA frequency table generated from TargetScanS was used to make the figure. (A) Shows the projection of the PTC (blue) and normal thyroid tissue (red). The first and second axes split the data with the more homogeneous normal tissue samples clustering in the top right hand corner. (B) Shows the projection of the miRNAs. MiRNAs that are in the opposite orientation relative to the origin are associated with those samples. Highlighted in blue are miRNA associated with PTC identified on the miRNA microarray.
Figure 2 – Axes 1 and 2 of the CIA of the PTC dataset using miRecords target data
Unsupervised CIA of the PTC dataset generated using the gene/miRNA frequency table from miRecords target data. (A) Shows the projection of the PTC (blue) and normal thyroid tissue (red). Axis 1 (horizontal) splits normal thyroid tissue samples from the PTC samples. (B) Shows the projection of the miRNAs. MiRNAs that are in the opposite orientation relative to the origin are associated with those samples. Highlighted in blue are miR-221 and miR-222, which are associated with PTC.
Figure 3 – Supervised CIA results for the LPS treated WT macrophages.
Supervised analysis using BGA was performed with the gene expression data and the 5 gene/miRNA frequency tables. Each axis shows the projection of the miRNAs that are predicted to be upregulated in LPS treated WT macrophages produced with each of the 5 target prediction programs. Highlighted in blue are miRNAs that are highly ranked by multiple programs.
Figure 4 – Supervised CIA results for the LPS treated MALKO macrophages.
BGA was performed with the gene expression data and the 5 gene/miRNA frequency tables. Each axis shows the projection of the miRNAs that are predicted to be upregulated in LPS treated MALKO macrophages. The axes were produced with the 5 target prediction programs. Highlighted in blue are miRNAs that are highly ranked by multiple programs.
Figure 5 - miR155 is induced following LPS stimulation.
Bone marrow derived macrophages (BMDM) were obtained from wild-type (WT) and Mal knockout mice. Cells were differentiated for 10 days and stimulated with 100ng/ml LPS for 2 h. RNA was extracted and miR155 levels were tested by quantitative RT-PCR. Results are expressed as a mean ± S.D for triplicate determinations. All results are representative of 3 separate experiments.
Figure 6 - miR126 is induced following LPS stimulation.
Figure 7 – Axes 1 and 2 of the unsupervised CIA for the tissue dataset
The gene/miRNA frequency table generated from PicTar5way was used to make this figure. (A) Shows the projection of the tissue samples. Axis 1 (horizontal), separates the midbrain tissue (blue) from the rest of the samples, while axis 2 (vertical) separates skeletal muscle tissue (red) and to a lesser extent heart tissue (grey) from the rest of the samples. (B) Shows the projection of the miRNAs. Motifs in the opposite orientation relative to the origin are associated with that tissue. Highlighted in blue are miRNA associated with brain tissue, and in red are motifs associated with skeletal muscle.
Tables
Table 1 - miRNAs predicted to be associated with papillary thyroid cancer Predicted miRNAs Rank with PicTar4w ay Rank with PicTar5w ay Rank with TargetScan Rank with TargetScan S Rank with miRanda Average Rank Fold Change
miR-222 3 2 3 4 3 10.9
miR-221 6 4 2 3 3.75 12.3
miR-346 4 5 4.5 -
miR-142 7 3 10 2 5.25 -
miR-146 5 14 9.5 19.3
miR-144 13 6 9.5 -
miR-134 14 6 10 -
miR-183 13 16 9 6 11 -
miR-126* 20 3 12.5 -
miR-1 16 10 13 -
miR-206 17 11 14 -
miR-200a/b/c
18 12 15 -
miR-21 18 16 17 4.3
miR-223 19 17 18 -
miR-100 20 18 19 -
Table 2 - miRNAs predicted to be up-regulated in Macrophage cells treated with LPS
Predicted miRNAs Rank with
PicTar4way
Rank with PicTar5way
Rank with TargetScan
Rank with TargetScanS
Rank with miRanda
Average rank
WT macrophages
miR-369/3p/5p 2 4 10 1 4.25
miR-155 5 1 7 7 5
miR-374 12 2 7
miR-126 15 14 2 2 8.25
miR-34/b/c 15 12 5 10.66
miR-33 20 5 8 11
miR-26/a 11 16 18 3 11.25
miR-18a 9 20 14.5
MALKO macrophages
miR-126 2 2 1 1 1.5
miR-155 3 3 6 3 3.75
miR-33 8 6 7 7
miR-26/a 13 4 8.5
miR-369/3p/5p 20 11 2 11 11
miR-34/b/c 19 13 14 15.33
miR-18a 15 18 16.5
miR-374 18 20 19
Table 3 – Overlap between predicted tissue specific miRNAs, Arora and Simpson data, and available experimental data
Predicted miRNA
Brain Heart Kidney Liver Lung Ovary Skeletal
Muscle
Testes
let-7/a/b/f Y*, 1,2,3 * * * * * * *
miR-1/206 Y*, 1,2,3 * Y, 2
miR-7 Y, 2 Y
miR-10/a/b * Y, 10 *
miR-15/a/b * Y*, 15 * Y*, 18 *
miR-18/a/b Y
miR-21 Y, 4 Y, 10
miR-22 Y, 3 Y Y
miR-23a/b Y, 2
miR-24/* * * Y*, 18
miR-29/a/b/c Y*, 2,3 *
miR-30 * * Y*, 2,15 * * Y*, 18 * *
miR-33 Y * *
miR-34/b/c * Y Y*, 16
miR-99/b Y, 1 Y
miR-101 * Y*, 2 *
miR-122/a Y*, 1,2,3
miR-125/a/b * Y*, 1,2 * * Y*, 18
miR-126 Y, 2 Y, 2
miR-127 Y Y
miR-128/b * * * * Y*
miR-129/3p Y
miR-133/a/b Y*, 2,3 Y*, 2,3
miR-134 Y
miR-135/a/b Y Y
miR-136 Y *
miR-137 * Y* Y* *
miR-141 Y, 8 Y
miR-142-3p/5p Y Y, 11 Y
miR-143 Y, 3
miR-146/a/b Y, 1 Y Y*, 12 *
miR-151 Y
miR-152 Y Y
miR-181a Y
miR-182/* Y Y Y
miR-184 Y, 17
miR-187 Y
miR-188 Y
miR-190 * Y
miR-191 Y
miR-195 Y, 18
miR-196/a/b Y* * * * * *
miR-199/b Y, 5 Y, 15 *
miR-200/a/b/c Y, 7,8 Y, 10 Y
miR-205 Y
miR-208 Y
miR-210 Y Y
miR-212 Y
miR-215 Y
miR-217 Y Y
miR-219 Y, 1 Y
miR-221 Y, 13 Y
miR-299-3p/5p Y
miR-302 Y
miR-324-5p Y
miR-325 Y Y Y
miR-326 Y
miR-335 Y, 4 *
miR-340 Y
miR-361 Y
miR-369-3p/5p Y
miR-375 Y*
miR-411 Y
Additional files
Additional file 1Title: miRNAs on the OSU_CCC version 2.0 miRNA microarray chip
Description: This file contains the human microRNAs present on the miRNA
microarray chip
Additional file 2
Title: Results of the CIA for PTC using all available miRNAs
Description : This file contains the results of the CIA for PTC using all of the
miRNAs. It also contains how each miRNA is ranked using the 5 different target
prediction programs.
Additional file 3
Title: GEO sample and platform accession numbers
Description: This file contains GEO accession numbers and the tissue information
miR 155
5 10 15 20 25 WT cells ld c h a n g e r e la ti v e t o t im e0
miR 155
10 20 30
MAL KO cells
miR 126
1 2 3
MAL KO cells
Additional files provided with this submission:
Additional file 1: Additional_file_1.xls, 24K
http://www.biomedcentral.com/imedia/1814587750337721/supp1.xls
Additional file 2: Additional_file_2.doc, 42K
http://www.biomedcentral.com/imedia/3068816493377218/supp2.doc
Additional file 3: Additional_file_3.doc, 49K