Effect of Friction Fatigue on Pile Capacity in Dense Sand
Kenneth G. Gavin
1and Brendan C. O’Kelly
2Abstract: The paper presents the results of a series of field tests performed to study the causes of friction fatigue experienced by displacement piles. Four instrumented model piles were installed at a dense sand test-bed site. The test series was designed to impose different levels of cyclic loading during pile installation. Static and cyclic load tests were subsequently performed to study the differences in the axial capacities developed for ostensibly monotonic and cyclic installations. The test results indicated that the mobilized horizontal effective stress regime that controls pile side friction primarily depends on the in situ sand state, as reflected by the cone penetration test 共CPT兲qcresistance. A zone of highly stressed sand that produced a concentration of high shear resistance was mobilized in the vicinity of the pile base. The horizontal effective stress that acted on the pile shaft reduced in response to cyclic loading, with the largest reductions occurring for high-intensity cyclic loading or when the pile had experienced only a few load cycles during installation. Although cyclic loading caused a reduction in the horizontal effective stress that acted on the pile shaft, the elevated stress built up in the vicinity of the pile base during installation remained higher than that remote from the base. The elevated stress in the vicinity of the pile base only dissipated after cyclic tension loading had been applied.
DOI:10.1061/共ASCE兲1090-0241共2007兲133:1共63兲
CE Database subject headings:Field tests; Models; Friction; Fatigue; Piles; Sand; Displacement.
Background
The first test that studied the effects of friction fatigue was per-formed by Vesic共1970兲, in which the shear stresses mobilized at discrete points along the shaft of a 356-mm-square concrete pile were measured as the pile was driven to 15.25 m below ground level共bgl兲 共Fig. 1兲. Friction fatigue reduced the shear stress mo-bilized at a given depth in the ground as the distance共h兲 to the pile base increased. Instrumented pile tests共Lehane 1992; Chow 1997兲have shown that the peak shaft resistance共f兲is given by
f=hp⬘ tan␦f 共1兲
hp⬘ =hs⬘ +⌬rd⬘ 共2兲
wherehp⬘ = horizontal effective stress at failure, which comprises two components, the stationary horizontal effective stresshs⬘ and a dilation component⌬rd⬘; and␦f= interface friction angle.
Boulon and Foray共1986兲and others have shown that cavity expansion theory can be used to estimate the increase in the hori-zontal effective stress due to dilation
⌬rd⬘ = 2G␦h/D 共3兲 where G= shear modulus; ␦h= horizontal displacement of a soil particle at the pile-soil interface; andD= pile diameter.
Dilation effects can dominate the shaft capacity for model piles关small values ofD in Eq.共3兲兴, although the effects reduce considerably for full-scale piles. Therefore, while quantification of the dilation component is particularly important in the interpre-tation of model pile test results, prediction of the shaft resistance of full-scale piles requires the accurate determination ofhs⬘.
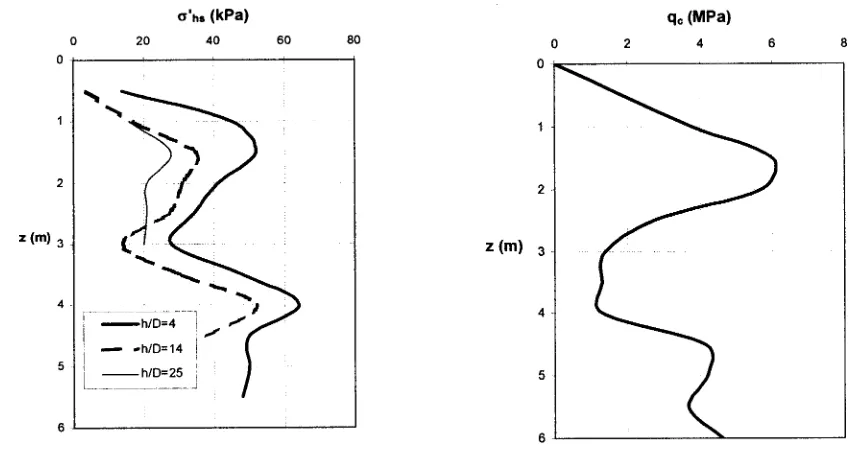
Lehane共1992兲reported data from the installation of the steel, closed-ended Imperial College pile共102 mm in diameter and 6 m in length兲into a loose-to-medium dense sand deposit at Labenne, in southwest France. The pile was instrumented with horizontal stress sensors at three locations along the pile shaft, which were identified in terms of the distance共h兲from the pile base, normal-ized by the pile diameter 共D兲. The hs⬘ profiles共Fig. 2兲closely agreed with the cone penetration test 共CPT兲end resistance 共qc兲
profiles, suggesting that hs⬘ was controlled by the in situ sand state. Critically, hs⬘ at a given depth decreased with increasing distanceh. Chow共1997兲reported data from the installation of the same pile in a dense sand deposit at Dunkirk共France兲for which thehs⬘ values were 4–5 times greater than the values measured at the Labenne site. The data from both sites indicated that the value of hs⬘ mobilized at a given location along the pile shaft was almost directly proportional to the CPTqcvalue and depended on the distance 共h兲 of that point above the pile base. Jardine and Chow 共1996兲 and Jardine et al. 共2005兲 proposed the following best-fit relationship共known as the IC design approach兲:
hs⬘ = 0.029qc共v⬘/Patm兲0.12共h/R兲−0.38 共4兲
where v⬘= vertical effective stress; Patm= atmospheric pressure;
andR= pile radius.
In this expression, qcreflects the combined effects of the soil density and stress level on the value of hs⬘, while the h/R 共or
h/D兲term takes account of the friction fatigue effects. Jardine et al.共2005兲suggested that a number of factors contributed to fric-tion fatigue, including: 共1兲 the reduction in horizontal effective stress at a given depth due to migration of the high stress field located about the pile base as the pile was driven past the point 1
Lecturer, Dept. of Civil Engineering, University College Dublin, Earlsfort Terrace, Dublin 2, Ireland. E-mail: [email protected]
2
Lecturer, Dept. of Civil, Structural, and Environmental Engineering, Trinity College Dublin, Dublin, Ireland.
under consideration;共2兲 the effects of cyclic loading during in-stallation; and共3兲the creation by circumferential arching of con-ditions where high radial effective stresses in the ground were prevented from acting on the pile shaft.
The effects of cyclic loading at the pile-soil interface were studied using direct interface-shear tests by Airey et al. 共1992兲, Fioravante共2002兲, and DeJong et al.共2003兲. The tests were per-formed using constant normal stiffness boundary conditions to simulate the stiffness of the ground remote from the pile shaft. As the strains were concentrated in the narrow shear zone adjacent to the pile shaft, the shear stiffness of the unstrained soil outside this shear zone remained at or close to the low-strain Go value. The tests indicated that densification in the shear zone due to cyclic
loading caused a gradual reduction in the normal stress 共 corre-sponding to the horizontal effective stress acting on the pile shaft兲.
[image:2.612.67.265.41.261.2]White and Lehane 共2004兲studied the effects of the mode of installation on the shaft resistance of model piles共9 mm square in cross section兲using a centrifuge. In particular, three different in-stallations were studied: 共1兲 monotonic, in which the piles were continuously pushed to the final depth;共2兲jacked, in which the piles were subjected to a number of installation load cycles by pushing downwards 2.0 mm and subsequently unloading fully; and 共3兲 pseudodynamic in stages, each stage comprising a 2.0 mm push followed by a 1.5 mm withdrawal to simulate elas-tic rebound. The stationary horizontal effective stress共hs⬘兲, mea-sured at three locations along the pile shaft following installation,
Fig. 1. Profile of shear stress versus depth for 356 mm square concrete pile关after Vesic共1970兲兴
[image:2.612.366.517.46.249.2]Fig. 2.Profiles of stationary horizontal stress and CPTqcresistance at Labenne关after Lehane共1992兲兴
[image:2.612.89.522.489.718.2]is shown in Fig. 3. The hs⬘ values were greatest for monotonic installation, intermediate for the jacked pile, and lowest for pseudodynamic installation. A key finding was that, unlike the tests reported by Jardine and Chow共1996兲, the plots of normal-ized stationary horizontal effective stress共hs⬘ /qc兲versus distance
hfrom the pile base did not produce a unique relationship; rather, the ratio for a given h value depended on the number of load cycles. Using experimental data from the jacked and pseudody-namically installed piles, White and Lehane 共2004兲 argued that the number of load cycles experienced by the soil element rather than the absolute distance of that element from the pile base con-trolled hs⬘. Field measurements by DeJong and Frost 共2002兲 of the sleeve friction 共fs兲acting on a cone penetrometer with mul-tiple friction sleeves appeared to support this hypothesis, with the
fs values measured on sleeves located more than three cone di-ameters from the cone tip being similar. All readings were, how-ever, lower than the sleeve friction measured at the standard location共i.e., near the cone tip兲.
Despite these findings, a comprehensive review of a large da-tabase of instrumented pile tests by Lehane et al.共2005兲found that design approaches incorporatingh/Drather than the number of load cycles共N兲provided better estimates of the side friction for large databases of field tests. Best-fit correlations to the field data were proposed关Eq.共5兲兴and are known as the University of West-ern Australia共UWA兲design approach共Lehane et al. 2005兲
hs⬘ = 0.03qc共h/D兲
−0.5 共5兲
The development of high-capacity pile jacking equipment al-lows the possibility of pile installation with minimal cyclic dis-turbance. The data in the literature suggests that the side friction of jacked piles may be significantly underestimated if design methods such as the IC and UWA approaches, which incorporate reduction factors for friction fatigue effects, are applied. How-ever, there is little guidance for designers to estimate potential improvements in the capacity of jacked piles. In addition, there appears to be some discrepancy between the physical mechanisms advanced to explain friction fatigue effects for model tests and for full-scale pile behavior. It was in this context that a series of field tests were conducted in dense sand using an instrumented model pile with sensors located at three different levels along the pile shaft. Different installation modes, ranging from monotonic to
installations involving large numbers of load cycles, were studied. A number of static and cyclic load tests were also performed to quantify the effects of cyclic loading on the pile capacity.
Description of Experiments
Site Conditions
The pile tests were performed in a heavily overconsolidated, gla-cially derived, very dense, fine sand deposit in Blessington, situ-ated 25 km southwest of Dublin city. Thein situmaterial had a preconsolidation pressure of about 1.0 MPa and a bulk unit weight of 20 kN/ m3, and it was close to 100% relative density.
The ground water table was located at about 6 m below the piling platform level. Thein situ water content was relatively uniform above the groundwater table, ranging between 10 and 12%共 de-gree of saturation of 71%兲, and did not vary seasonally. The mean particle size共D50兲of the sand was between 0.10 and 0.15 mm.
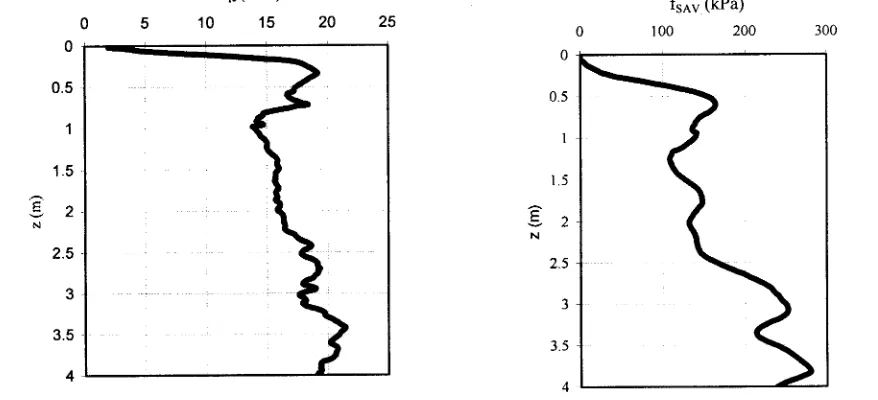
Eight CPTs were conducted in the area of the pile installations, although two of these tests stopped prematurely on a gravel layer located at about 1.0 m bgl. Profiles of mean CPT end resistance 共qc兲 are shown in Fig. 4共a兲. Theqc profiles indicate a variable deposit above 1.0 m bgl. Below this depth, theqc profiles were reasonably consistent, with values of about 15 MPa for 1.0– 2.5 m bgl, increasing to about 18 MPa at 2.5 m bgl. The mean sleeve friction共fs兲measured using a friction sleeve located ath/D= 3 from the cone tip is plotted in Fig. 4共b兲.
Model Pile
[image:3.612.89.528.42.242.2]The stainless-steel model pile was tubular, 73.0 mm in outer di-ameter, and closed-ended. Its lower section, 1.7 m in length, com-prised three instrumented units that included total earth-pressure sensors and pore pressure transducers manufactured by Entran Ltd., U.K. The pore pressure transducers, of 3 MPa capacity, were mounted in predrilled holes in the wall thickness of the instru-mented units. A porous ceramic disc, 8.5 mm in diameter and 2.5 mm in thickness, was mounted flush with the outer wall sur-face in front of each of the pore pressure transducers. The earth-pressure sensors and pore earth-pressure transducers were located
diametrically apart in the instrumented units ath/D= 1.5, 5.5, and 10.0. Spacer sections, 1.0 m in length and machined from the same steel pipe, were attached to the top end of the instrumented section, allowing installation of the pile to depths of up to 6 m. Although the pore pressure transducers were installed in the in-strumented units during the test program, no excess pore water pressures were recorded at any stage of the tests.
Electrical resistance strain gauges were glued to the inner wall of the pile at the top and bottom of the instrumented section and at the top of all spacer sections. These allowed the distribution of load that acted along the pile and the base load to be determined throughout testing.
Test Program
The piles were pushed into the dense sand deposit at a rate of 20 mm/ s using a 20 metric ton capacity CPT truck. The installa-tion loads were measured using a load cell located above the pile head. The load cell and the pile instrumentation were continu-ously logged at 0.1 s intervals using a System 5000 data logger throughout the pile installation and load tests. The aim of the work was to study the differences in the behavior of driven and jacked piles. Pile driving was modeled in the tests by applying short jacking strokes using the CPT truck, fully removing the applied load at the end of each stroke, thereby creating a prede-termined number of load cycles. Two displacement transducers attached to an independent reference beam monitored the vertical displacement of the pile head during the load tests. Pile installa-tion generally continued until the reacinstalla-tion capacity of the CPT truck was approached, an exception being pile B4, where instal-lation was halted at 2.0 m bgl due to the very high horizontal stress that mobilized near the pile base. The need to add spacer sections at stages during monotonic installation to increase the overall length of the pile resulted in periodic unloading for even the ostensibly monotonically installed piles. Full details of the installation procedures共including depths at which the spacer sec-tions were added兲 and the load tests that were performed are given in Table 1. Schematics of the pile installations showing details of the starter boreholes and the final penetration depths are shown in Fig. 5.
Pile Installation
Base Resistance
Typical profiles of the base resistance 共qb兲measured during the installation of the monotonically 共B2兲 and cyclically 共B3兲 in-stalled piles are shown in Fig. 6. Pile B2 was inin-stalled through a shallower starter borehole, which may explain its relatively high base resistance for shallow penetrations. However, there was no overall systematic variation between the base resistances of either pile and the CPT end resistance value.
Mean Shear Stress
The mean shear stresses共av= shaft load/shaft area兲measured dur-ing the installation of piles B1 and B2 are compared in Fig. 7. The applied load at the pile head was fully removed after each 50 mm drive for pile B1 共cyclic installation兲. Pile B2 was continuously pushed, and the applied load was only removed twice during its installation at depths of 2.1 and 2.6 m bgl to allow the addition of spacer sections to increase the overall pile length.
The monotonically installed pile B2 共solid symbols, Fig. 7兲 had a higher side friction than the cyclically installed pile B1. The capacity of pile B2 temporarily dropped immediately after the pile-head load had been removed at 2.1 and 2.6 m bgl, where the installation was briefly halted. However, the side friction quickly recovered and was typically 40% greater than that measured for the cyclic installation.
Stationary Horizontal Stress
[image:4.612.317.572.47.323.2]In order to understand the side friction response, it was necessary to consider both the stationary and peak horizontal effective stresses共including the dilation component兲mobilized at the pile-soil interface. The stationary horizontal effective stress共hs⬘兲 val-ues recorded during monotonic and cyclic installations are shown in Fig. 8共closed symbols indicating monotonic installation兲. The stationary hs⬘ values for piles installed by continuous jacking Table 1.Details of Installation Procedures and Load Tests
Pile
number Details
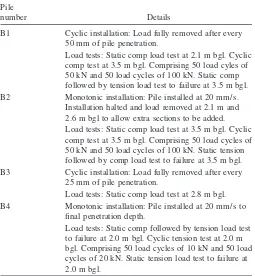
B1 Cyclic installation: Load fully removed after every 50 mm of pile penetration.
Load tests: Static comp load test at 2.1 m bgl. Cyclic comp test at 3.5 m bgl. Comprising 50 load cyles of 50 kN and 50 load cycles of 100 kN. Static comp followed by tension load test to failure at 3.5 m bgl. B2 Monotonic installation: Pile installed at 20 mm/ s.
Installation halted and load removed at 2.1 m and 2.6 m bgl to allow extra sections to be added. Load tests: Static comp load test at 3.5 m bgl. Cyclic comp test at 3.5 m bgl. Comprising 50 load cycles of 50 kN and 50 load cycles of 100 kN. Static tension followed by comp load test to failure at 3.5 m bgl. B3 Cyclic installation: Load fully removed after every
25 mm of pile penetration.
Load tests: Static comp load test at 2.8 m bgl. B4 Monotonic installation: Pile installed at 20 mm/ s to
final penetration depth.
Load tests: Static comp followed by tension load test to failure at 2.0 m bgl. Cyclic tension test at 2.0 m bgl. Comprising 50 load cycles of 10 kN and 50 load cycles of 20 kN. Static tension load test to failure at 2.0 m bgl.
[image:4.612.334.553.571.723.2]could only be measured at the pause periods when the applied load had been fully removed. The following trends were observed:
1. The cyclically installed pile had been pushed from the bot-tom of a starter borehole, 0.8 m in depth. The hs⬘ values increased with the penetration depth and became reasonably constant for a givenh/Dvalue when the pile had penetrated 1.2 m below the bottom of the borehole, corresponding to a distance of about 16 pile diameters.
2. A clearh/Dtrend was evident for the cyclically installed pile withhs⬘ progressively reducing in a given horizon as the pile moved downward.
3. The hs⬘ values were higher for the monotonically installed pile and at a givenh/Dwere at least 50% higher than those recorded for the cyclic installation.
4. Contrary to the findings of White and Lehane共2004兲, a clear
h/Dtrend is evident for the monotonic installation, withhs⬘ values forh/Dof 5.5 and 10.0 at only 60 and 40%,
respec-tively, of the values recorded ath/D= 1.5, despite negligible differences in theqcvalues over the depth range.
Peak Horizontal Stress
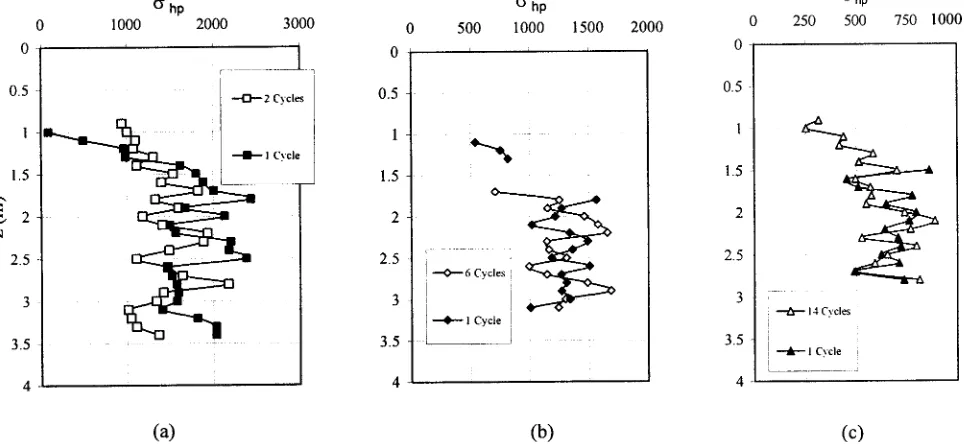
Although it was noted that full-scale pile behavior is principally controlled byhs⬘, significant dilation during load tests on model piles causes large increases in the horizontal effective stress共h⬘兲, which can dominate the shear stress response. The peak horizon-tal effective stress 共hp⬘兲 profiles for the monotonic and cyclic installations, including the numbers of load cycles experienced by the sensors, are given in Fig. 9:
[image:5.612.78.258.39.210.2]1. In common with thehs⬘ values for cyclic installation, thehp⬘ values measured for both piles increased with depth and be-came roughly constant for a givenh/Dvalue when the pile
Fig. 6.Base resistance during installation of Piles B2 and B3
[image:5.612.358.528.46.239.2]Fig. 7.Average shear stress during installation of Piles B1 and B2
[image:5.612.100.514.480.718.2]had penetrated 1.2 m, corresponding to a distance of about 16 pile diameters.
2. The hp⬘ values were three to four times greater than the corresponding stationary values, indicating that the dilation-induced stress increases had been greatest remote from the pile base.
3. Although there was a trend for thehp⬘ values to reduce with increasingh/D, the measured values for both piles were re-markably similar 共apart from the sensor ath/D= 1.5兲, sug-gesting that thehp⬘ values at locations further away from the pile base were independent of the number of installation load cycles.
4. In general, thehp⬘ values measured ath/D= 1.5 were greater for the ostensibly monotonically installed pile共closed sym-bols兲that experienced a single load cycle during installation. However, the monotonically installedhp⬘ values were simi-lar to those recorded for cyclic installation, when just a single load cycle had been experienced at, for example, 2.1 or 2.6 m bgl.
In summary, the hp⬘ values were greatest near the pile base and reduced with increasingh/D. Thehp⬘ values were equal at a given location along the pile shaft for two or more load cycles. Significant differences in the stationary horizontal effective stresses, which control the shaft capacity of full-scale piles, were evident for the monotonic and cyclic installations. However, dur-ing loaddur-ing these differences were partially masked by dilation along much of the shaft of the small diameter model pile.
Load Tests
A series of static load tests were performed on the piles at the final penetration depths and also in some cases at intermediate depths. In general, a static compression load test was performed to establish the axial capacity of the pile, which was then fol-lowed by a one-way compression or cyclic tension load test. The cyclic tests were load-controlled, in which two batches of 50 load cycles representing 33 and 66% of the axial capacity were
ap-plied. Static tension load tests usually completed the test regime. Full details of the sequence of loads that were applied to the piles are given in Table 1.
Static Load Tests
Given the high side friction resistance during installation, it was perhaps unsurprising that the monotonically installed piles exhib-ited greater capacities for the first-time load tests than the cycli-cally installed piles. The load-displacement responses measured during the static load tests performed at 3.5 m bgl on the mono-tonically installed pile共B2兲and cyclically installed pile共B1兲are compared in Fig. 10共a兲. Pile B2 showed a stiffer response and had a higher ultimate resistance, defined herein as the load at which plunging failure occurred 共at which the pile displacement in-creased under a constant applied load兲. The unit base resistance that were mobilized during the load tests were calculated to allow direct comparison of the behavior of piles with different final penetration depths. Fig. 10 shows the normalized base resistance 共qb/qc兲mobilized during the static load tests for both the mono-tonic and cyclic installations. The initial value of the residual base pressure was greater for the cyclically installed pile共B3兲, due to its greater penetration. However, both piles displayed similar stiffness responses, with end-bearing stresses of 90–95% of the measured qc values for h/D⬵0.05 共pile penetration of 4 mm兲 with the base resistance equaling the measured qc values for
h/D艌0.20共pile penetrations艌15 mm兲.
Therefore, the differences in the axial load capacities of the piles must have occurred due to the higher side friction resistance that was mobilized during monotonic installation. A feature of all the first-time compression load tests was that, despite the large vertical displacements共typically 50% of pile diameter兲, the total pile resistance mobilized was always lower than the applied load during pile installation. The ratio of the load measured during the static load tests共QST兲to that applied during pile installation共QIN兲
[image:6.612.68.550.41.265.2]appeared to be independent of the installation mode and, based on the small number of tests performed, ranged between 70 and 80%. Given that the base resistance values measured during both
installation and the static load tests were similar, the reduction in ultimate pile capacity can only be explained by the reductions in the side friction resistance. As the side friction resistance of the model piles was controlled byhp⬘, the changes in this value be-tween pile installation and subsequent loading were studied.
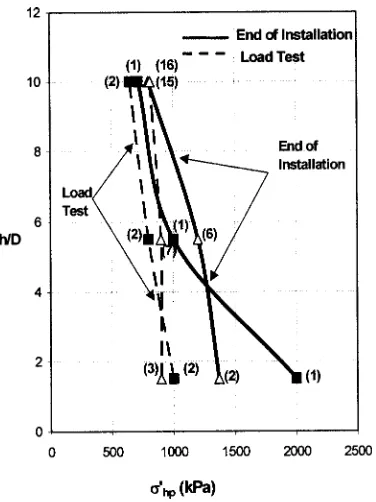
Thehp⬘ profiles at the end of pile installation were compared with those measured during subsequent load tests for the mono-tonic共closed symbols兲and cyclic installations共open symbols兲in Fig. 11. The numbers of load cycles experienced by the sensors are also shown in brackets in Fig. 11. The data provided the following insights into the degradation of the shaft resistance: 1. The hp⬘ values at h/D= 1.5 were significantly greater than
the values measured with increasing distance from the pile base共h/D= 5.5 or 10.0兲for monotonic installation.
2. Thehp⬘ values reduced for allh/Dduring static loading. The greatest reductions were measured at h/D= 1.5, namely, a 50% decrease in the installation value for the monotonically installed pile and a 34% decrease in the installation value for the cyclically installed pile.
3. The reductions inhp⬘ ath/D= 5.5 and 10.0 were much lower and the rate of reduction appeared to decrease as the number of load cycles increased.
4. Thehp⬘ profiles for the monotonically installed piles and the CPTqcdata关Fig. 4共a兲兴indicate a tendency for the peak side friction resistance to be higher near the pile base and roughly equal along the remainder of the pile shaft. However, the application of a single load cycle reduced the positive effect of high stress on the shaft resistance near the pile base and resulted in a relatively uniform profile of peak side friction resistance along the entire pile shaft.
Cyclic Load Tests
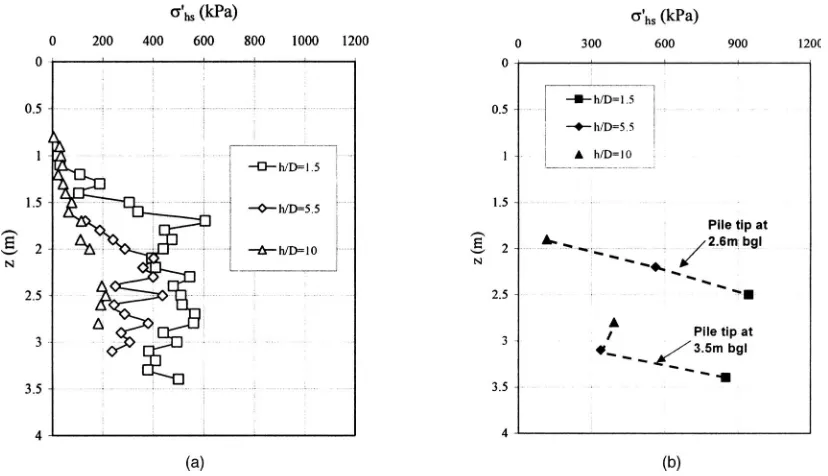
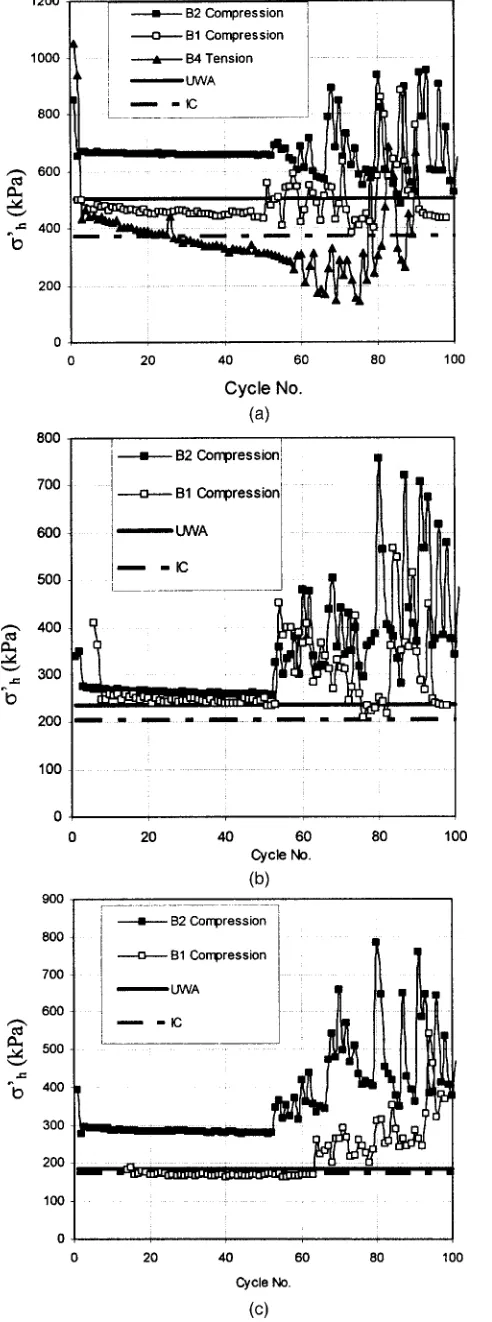
The test regime of cyclic loading was chosen to examine the behavior of the piles at typical working loads of between one-third and two-one-thirds of the ultimate capacity. Although detailed consideration of the cyclic load tests is beyond the scope of this paper共Chatta 2006兲, this load level was not sufficient to mobilize the peak shaft resistance so the variation in the peak horizontal stress could not be determined. Nevertheless, the effects of cyclic loading on the stationary horizontal effective stress were studied, because this parameter controls full-scale pile behavior. Thehs⬘ values forh/D= 1.5, 5.5, and 10.0 are shown in Fig. 12. Only the data for the lowermost sensor共h/D= 1.5兲, which had penetrated greater than the critical depth of 16 pile diameters, is shown for pile B4, because its installation had been prematurely halted. For the monotonically installed pile B4 关solid triangles, Fig. 12共a兲兴, the hs⬘ values rapidly reduced from 1,050 to 950 kPa immedi-ately after installation and reduced further to 650 kPa at the end of the static load tests. Similar large reductions in the initialhs⬘ value were measured for pile B2, such that the hs⬘ value mea-sured at h/D= 1.5 at the end of the third load cycle was only slightly greater than that for cyclic installation共B1兲.
[image:7.612.86.530.37.212.2]Low-level cyclic loading was performed at one-third of the pile capacity and comprised 50 compression load cycles of 50 kN
[image:7.612.75.263.455.706.2]Fig. 10.共a兲Load-displacement response of Piles B1 and B2 measured at 3.5 m bgl;共b兲mobilization of base resistance during static load tests on piles B2 and B3
for piles B1 and B2 and 50 tension load cycles of 10 kN for pile B4. During compression cyclic loading, the hs⬘ values reduced only slightly, as very little side friction resistance had been mo-bilized due to the high residual base resistance of up to 40 kN under the applied pile-head load of 50 kN. In contrast, cyclic tension loading reduced the locked-in base pressures and de-creasedhs⬘ in the vicinity of the pile base.
High-level cyclic loading 共cycle numbers 50–100兲 caused large reductions in thehs⬘ values measured for the monotonically installed piles B2 and B4 ath/D= 1.5. In the case of pile B2, the applied pile-head load of 100 kN was significantly greater than the 50– 60 kN ultimate base resistance, so a significant proportion of the side friction resistance had been mobilized. Although there is some scatter in thehs⬘ values measured at h/D= 1.5 for pile B1, the values at the end of high-level cycling remained largely unchanged from the initial values throughout the loading se-quence. The hs⬘ values at h/D= 1.5 for both compression piles were very similar after 14 cycles at the higher load level. The IC and UWA design approaches 关Eqs. 共4兲 and 共5兲兴 both provided reasonable estimates of the measuredhs⬘ values. Thehs⬘ values acting on the pile in tension loading were about 33% of those that acting on the compression piles. Greater scatter occurred in the hs⬘ measurements for monotonic installation with increasing numbers of load cycles关N⬎64; Fig. 12共a兲兴. Although there was a trend for the piles tested in compression to achieve residualhs⬘ values 共intermediate of the estimates given by the IC and UWA design approaches兲, large increases in thehs⬘ values occasionally occurred accompanied by large pile settlement. However, the re-covery in the hs⬘ values was temporary and the values quickly reduced to residual levels following a small number of additional load cycles, at which point further pile settlement occurred.
In general, the level ofhs⬘ acting further from the pile base increased in magnitude during cyclic loading for both the mono-tonically and cyclically installed piles关Figs. 12共b and c兲兴. Thehs⬘ values at these locations were much closer after only a relatively small number of load cycles关Figs. 12共b and c兲兴and did not vary much from the residual levels, even after a large number of load cycles had been applied. Again, the IC and UWA design ap-proaches both accurately predicted thehs⬘ values measured after a small number of load cycles.
Conclusions
Cyclic loading had no effect on the base resistance or base stiff-ness of the displacement piles that were installed in dense sand. In contrast, the side friction resistance of ostensibly monotonically installed piles was significantly greater than that for cyclic installation.
The following conclusions are made in relation to the station-ary horizontal effective stress共hs⬘兲that controls the side friction resistance:
1. The hs⬘ values that were mobilized during pile installation were greatest for monotonic installation and were dependent on the CPT end resistance, theh/Dratio, and the number of load cycles.
2. The highesths⬘ values were mobilized in the vicinity of the pile base and reduced with increasing distance away from the pile base, regardless of the mode of installation.
[image:8.612.51.297.38.699.2]3. Thehs⬘ values reduced during load cycling, with the greatest reduction occurring during the initial load cycles and at higher cyclic load levels.
4. Although the levels of hs⬘ acting on the monotonically in-stalled piles were initially much higher than those recorded for the cyclically installed piles, the values were indistin-guishable after the application of a relatively small number of working load cycles.
Anh/Dtrend whereby the stresses were elevated in the vicin-ity of the pile base was evident even after cyclic compression loading. However, the trend disappeared during cyclic tension loading, suggesting that the effect arises, at least in part, due to the presence of high residual stress built up near the pile base during installation.
The significance of these observations is that, although the shaft resistance of jacked piles may be greater than that of driven piles, a small number of load cycles are sufficient to remove any enhancement in the horizontal stress regime that was gained as a result of monotonic installation. This explains the relatively good performance of existing design approaches that do not explicitly account for cyclic loading effects in their formulation.
The data from the model piles were strongly influenced by dilation during loading. Erroneous conclusions would arise, par-ticularly in relation toh/D trends under both monotonic and cy-clic loading, if the dilation effects were not taken into account in the analysis.
Acknowledgments
The writers wish to thank the following people for significant contributions to the work described: Mr. Irfan Chatta, former re-search student at University College Dublin, who performed the site testing; David Gallagher and Frank Dillon, who designed and built the instrumented pile; the technical staff at University Col-lege Dublin and Trinity ColCol-lege Dublin, including George Cos-grave, David McCauley, Martin Carney, and George Jones, who assisted in the fieldwork; and Roadstone Ltd., for permission to use the quarry at Blessington, County Wicklow.
Notation
The following symbols are used in this paper: D ⫽ outer pile diameter;
fs ⫽ friction sleeve resistance measured during cone penetration test;
G ⫽ shear modulus of soil;
Go ⫽ small strain modulus of soil;
h ⫽ height above pile tip;
N ⫽ number of load cycles;
Patm ⫽ atmospheric pressure;
QIN ⫽ pile resistance during installation;
QST ⫽ pile resistance during static load test;
qb ⫽ total end bearing resistance;
qc ⫽ end bearing resistance measured during cone penetration test;
R ⫽ outer pile radius;
␣ ⫽ a reduction factor applied toqc when estimating end bearing;
⌬h⬘ ⫽ increase in horizontal effective stress during pile loading;
␦f ⫽ interface friction angle at failure;
␦h ⫽ horizontal displacement of soil particle at pile-soil interface;
h⬘ ⫽ horizontal effective stress;
hp⬘ ⫽ horizontal effective stress at peak shear stress; hs⬘ ⫽ horizontal effective stress measured when pile is
stationary;
v⬘ ⫽ vertical effective stress;
av ⫽ average shear stress acting on pile shaft; and f ⫽ peak local shear stress.
References
Airey, D. W., Al-Douri, R., and Poulos, H. G.共1992兲. “Estimation of pile friction degradation from shear box tests.”Geotech. Test. J., 15共4兲, 388–392.
Boulon, M., and Foray, P.共1986兲. “Physical and numerical simulation of lateral shaft friction along offshore piles in sand.”Proc., 3rd Int. Conf. on Numerical Methods in Offshore Piling, Institut Francais du Petrol, Nantes, France, 127–147.
Chatta, I.共2006兲. “Investigation of installation effects and cyclic loading on piles in sand.” MS thesis, University College, Dublin, U.K. Chow, F.共1997兲. “Investigations into the behavior of displacement piles
for offshore structures.” Ph.D. thesis, University of London共Imperial College兲, London.
DeJong, J. T., and Frost, J. D.共2002兲. “A multi-friction sleeve attachment for the cone penetrometer.”Geotech. Test. J., 25共2兲, 111–127. DeJong, J. T., Randolph, M. F., and White, D. J.共2003兲. “Interface load
transfer degradation during cyclic load: A microscale investigation.”
Soils Found., 43共4兲, 81–93.
Fioravante, V. 共2002兲. “On the shaft friction modelling of non-displacement piles in sand.”Soils Found., 42共2兲, 23–33.
Jardine, R. J., and Chow, F. C.共1996兲. “New design methods for offshore piles.” Publication No. 96/103, Marine Technology Department, London.
Jardine, R. J., Chow, F. C., Overy, R., and Standing, J.共2005兲.ICP design methods for driven piles in sands and clays, Thomas Telford, London. Lehane, B. M. 共1992兲. “Experimental investigations of pile behavior using instrumented field piles.” Ph.D. thesis, University of London
共Imperial College兲, London.
Lehane, B. M., Scheider, J. A., and Xu, X.共2005兲. “CPT based design of driven piles in sand for offshore structures.” Internal Rep. No. GEO:05345, University of Western Australia, Perth, Australia. Vesic, A. S.共1970兲. “Tests on instrumented piles, Ogeechee River site.”J.
Soil Mech. and Found. Div., 96共2兲, 561–584.