Original Research Article
A clinical study of hyperreactive airway disease with wheeze in children
aged five to twelve years with special reference to pulmonary
function test
Arjun Reddy, Abhishek Patel*, Sanjeev Chetty
INTRODUCTION
Respiratory diseases are the most common cause of death in both developed and developing countries. Bronchial asthma during childhood is a common chronic airway disease. There is enough evidence to suggest that the prevalence of this disease is increasing, consequently the morbidity and mortality of bronchial asthma is also increasing.1,2 Pulmonary function tests are helpful in
evaluation, monitoring, management and follow, up of patients with hyperreactive airway disease.3 PFT is easily
measured using spirometer and can be recorded by the
doctors at the clinic to reflect the severity of outflow obstruction and was shown to anticipate early deterioration of patients conditions before it actually happens.3,4 Bronchial asthma is a common respiratory
disease of childhood which is associated with fluctuation in airway caliber and one of the earliest sign of impending attack is fall in PFT.4,5 Personal best PFT is a
useful concept for asthma self-management plan. Serial PFT monitoring is a convenient method for investigation and diagnosis of asthma.
ABSTRACT
Background: Pulmonary function test is the easiest and most cost-effective method to evaluate respiratory functions. PFT can be measured by a simple instrument spirometer. Measuring PFT has been suggested as an important tool in understanding HRAD and its complications and management by all international guidelines. The objectives of this study were to clinically diagnose the hyperreactive airway disease in children coming to Navodaya Medical College, Raichur, of age group 5 to 12 years. And to perform pulmonary function test before and after the use of a bronchodilator.
Methods: PFT was measured in 100 children who came with HRAD with wheeze using Spiro lab III spirometer. The child was given then nebulization with salbutamol and PFT was performed again after 30 min.
Results: A total of 100 clinically diagnosed cases of HRAD of age group 5 to 12 years of both the gender was taken into the study, of which more than 44% of the children showed more than 20% improvement in parameters FEV1, PEF, FVC and marginal improvement in EV1/FVC post bronchodilator compared to their prebronchodilator parameters. The young children of both the gender showed better improvement than elder children.
Conclusions: Spirometry is the best tool to assess HRAD even in younger children, early diagnosis and regular follow up with PFT helps to understand and prevent the progression of the disease with prompt treatment.
Keywords: Bronchodilator, HRAD, PFT, Spirometry
Department ofPediatrics, Navodaya Medical College, Raichur, Karnataka, India
Received: 15 March 2019
Accepted: 02 April 2019
*Correspondence:
Dr. Abhishek Patel,
E-mail: [email protected]
Copyright: © the author(s), publisher and licensee Medip Academy. This is an open-access article distributed under the terms of the Creative Commons Attribution Non-Commercial License, which permits unrestricted non-commercial use, distribution, and reproduction in any medium, provided the original work is properly cited.
A variation of greater than 20 percent of baseline may indicate airway reactivity. The use of bronchodilators and the relative improvement in the PFT is the basis for this study.6,7
Predictive normal values are essential for clinical interpretation of lung function tests. Nomograms predicting are available for various population groups.
While using lung function tests in epidemiology, it is important to ensure that the population from which the hyperreactive airway disease is seen comparing with predicted normal values which are affected by many factors including ethnic, regional and environmental influences.8-10 Importance of having reference normal
values of PFT in Raichur school children is more so because of large incidence of respiratory diseases, especially bronchial asthma.
The objectives of this study were to clinically diagnose hyperreactive airway disease in children coming to tertiary care hospital, Raichur of age group 5 to 12 years. And to perform pulmonary function test before and after the use of a bronchodilator.
METHODS
One hundred children of age group 5 to 12 years of both sexes who came to Navodaya Medical college and hospital, Raichur, for treatment of clinically diagnosed hyperreactive airway disease were enrolled.
Children presenting with acute onset cough without fever with past history of at least more than two episodes of wheeze and family history of asthma parents or siblings with or without wheeze were labeled as probable asthma. The study was approved by the institutional ethics committee.
Detailed history and examination findings were recorded. These children constitute a representative cross section of normal children of Raichur. Proper consent was taken from the parents, school and college authorities before starting the study.
These children were examined to rule out the following:
• H/o acute respiratory tract infection with in preceding three weeks,
• H/o chronic respiratory disease,
• H/o skeletal deformities of thorax,
• H/o cardiac and neurological disease.
Exclusion criteria
Children who were found as malnourished as per IAP criteria were excluded from the study.
PFT was measured by using Spiro lab III® spirometer all the measurements of PFT were taken in sitting position.
The purpose of the test and procedure was explained to the children. Then procedure was demonstrated in detail so as to familiarize them with the procedure and to gets their fullest cooperation.
Each child was told to take a deep breath and then blow into spirometer, Spiro lab III®, as hard and as fast as
possible through mouth piece and was closely watched to ensure that he/she maintained an air tight seal between lungs and mouth piece of Instrument, this was considered as the baseline PFT. The child was then given nebulization with salbutamol (0.4 mg/kg) using standard nebulizer machine, PFT was performed again after 30 minutes. The procedure was repeated thrice, highest value of these 3 readings was taken as observed PFT. Disposable mouth piece was used for recording of PFT for each individual child.
Statistical analysis
Statistical analysis was done for all the parameters, “p‟ value was determined. p>0.05 was considered as non-significant. Data obtained was fed to the computer and analyzed and valid conclusions were drawn.
RESULTS
Baseline characteristics of the study population
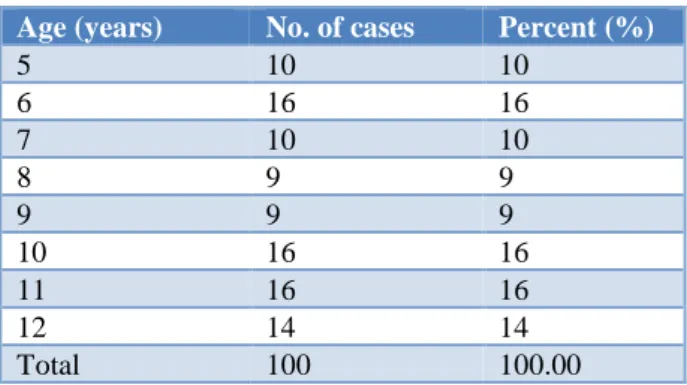
It was observed that 10 children were of 5 and 7 years of age, 16 children were of 6, 10 and 11 years, 9 children were of 8 and 9 years, and 14 children were of 12 years old. And among 100 children, 58 children were boys and 42 were girls (Table 1).
Table 1: Age wise distribution of study population.
Age (years) No. of cases Percent (%)
5 10 10
6 16 16
7 10 10
8 9 9
9 9 9
10 16 16
11 16 16
12 14 14
Total 100 100.00
It was observed that the mean value of the of FEV1 in the
and a standard deviation of 0.32 and post bronchodilator mean was 1.47 standard deviation of 0.38 and p-value <0.001 which was highly significant. It was observed that the mean value of the of FEV1/FVC in the study
population pre bronchodilator was 1.03 and a standard deviation of 0.12 and post bronchodilator mean was 1.09 standard deviation of 0.12 and p value <0.001 which was highly significant. Comparison of individual parameters gender wise in the study population among boys was taken and was compared to the average value of FEV1 pre
and post bronchodilator of the girls. An average value of FEV1 pre and post bronchodilator an average value of
PEF pre and post bronchodilator among boys was taken and was compared to the average value of PEF pre and post bronchodilator of the girls.
It was observed that the average pre bronchodilator value of PEF among boys was 2.46 while among girls was 2.30 a difference of 0.16 and post bronchodilator average value among boys was 3.14 and among girls was 2.99 a difference of 0.15. These values were statistically significant (p <0.001).
It was observed that the average pre bronchodilator value of FEV1 among boys was 1.27 while among girls was
1.22 a difference of 0.05 and post bronchodilator average value among boys was 1.56 and among girls was 1.52 a difference of 0.04. These values were statistically significant (p <0.012).
An average value of FVC pre and post bronchodilator among boys was taken and was compared to the average value of FVC pre and post bronchodilator of the girls.
It was observed that the average pre bronchodilator value of FVC among boys was 1.24 while among girls was 1.18 a difference of 0.06 and post bronchodilator average value among boys was 1.51 and among girls was 1.41 a difference of 0.1.
These values were statistically significant (p <0.001). An average value of FEV1/FVC pre and post bronchodilator
among boys was taken and was compared to the average value of FEV1/FVC pre and post bronchodilator of the
girls.
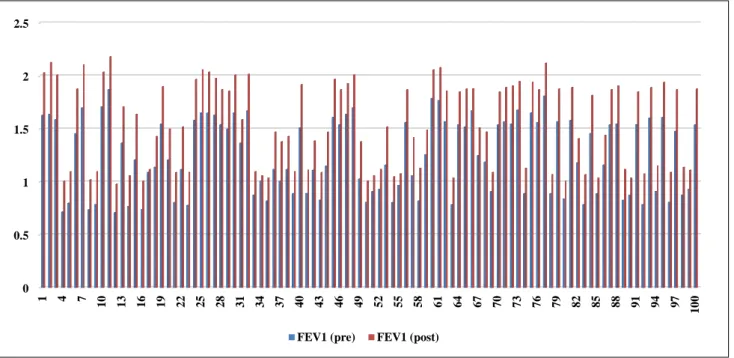
Figure 1: Individual values in FEV1 pre and post-bronchodilator.
Table 2: Interpretation of values in FEV1 pre and post-bronchodilator.
Mean SD T-value P-value Result
FEV1(pre) 1.25 0.35
5.513 <0.001 HS FEV1(post) 1.545 0.4
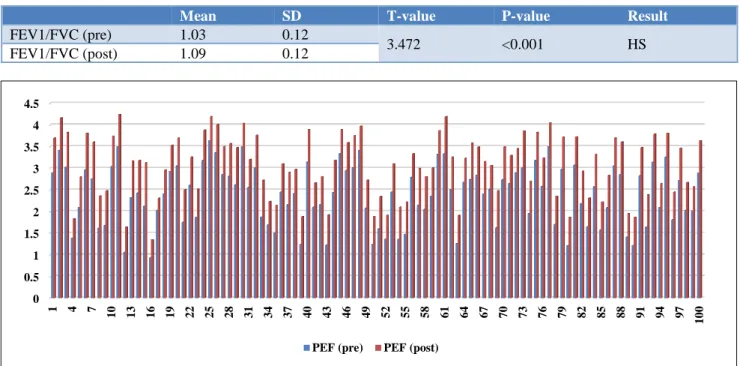
Table 3: Interpretation of values in PEF pre and post-bronchodilator.
Mean SD T-value P-value Result
PEF (pre) 2.39 0.69
6.894 <0.001 HS PEF (post) 3.07 0.7
0 0.5 1 1.5 2 2.5
1 4 7 10 13 16 19 22 25 28 31 34 37 40 43 46 49 52 55 58 61 64 67 70 73 76 79 82 85 88 91 94 97
1
0
0
Table 4: Interpretation of values in FVC pre and post-bronchodilator.
Mean SD T-value P-value Result
FVC (pre) 1.21 0.32
5.19 <0.001 HS FVC (post) 1.47 0.38
Table 5: Interpretation of values in FEV1/FVC pre and post-bronchodilator.
Mean SD T-value P-value Result
FEV1/FVC (pre) 1.03 0.12
3.472 <0.001 HS FEV1/FVC (post) 1.09 0.12
Figure 2: Individual values in PEF pre and post-bronchodilator.
Figure 3: Individual values in FVC pre and post.
It was observed that the average pre bronchodilator value of FEV1/FVC among boys was 1.03 while among girls was 1.04 a difference of 0.01 and post bronchodilator average value among boys was 1.09 and among girls was 1.10 a difference of 0.01. These values were statistically significant (p <0.001). The Table 10 showing percentage
improvement in FEV1 in the study conducted showing an
improvement of 20-30% in FEV1 post bronchodilator in
50% of the children.
Table 12 shows percentage improvement in FVC in the study conducted showing an improvement of 20- 30% in 0
0.5 1 1.5 2 2.5 3 3.5 4 4.5
1 4 7 10 13 16 19 22 25 28 31 34 37 40 43 46 49 52 55 58 61 64 67 70 73 76 79 82 85 88 91 94 97
1
0
0
PEF (pre) PEF (post)
0 0.2 0.4 0.6 0.8 1 1.2 1.4 1.6 1.8 2
1 4 7 10 13 16 19 22 25 28 31 34 37 40 43 46 49 52 55 58 61 64 67 70 73 76 79 82 85 88 91 94 97
1
0
0
FVC post bronchodilator in 57% of the children. Table 13 shows percentage improvement in FEV1/FVC in the
study conducted showing an improvement of up to 4% in FEV1/FVC post bronchodilator in 36% and 4 to 8%
improvement in 34% of the children.
Table 6: Comparison between male and female in FEV1 (pre) and FEV1 (post).
Sex FEV1 (pre) FEV1 (post) P-value
Male 1.27 1.56
0.012, Sig Female 1.22 1.52
Increase 0.05 0.04
Table 14 shows an average improvement in FEV1 post
bronchodilator age wise, showing an improvement of 29.96% among 5 years old and 21.18% among 10 years children.
Table 7: Comparison between male and female in PEF (pre) and PEF (post).
Sex PEF (pre) PEF (post) P-value
Male 2.46 3.14
0<0.001, HS Female 2.30 2.99
Increase 0.16 0.15
Figure 4: Individual values in FEV1/FVC pre and post-bronchodilator.
Table 8: Comparison between male and female in FVC (pre) and FVC (post).
Sex FVC(pre) FVC(post) P-value
Male 1.24 1.51
<0.001, HS Female 1.18 1.41
Increase 0.06 0.1
Table 9: Comparison between male and female in FEV1/ FVC (pre) and FEV1/ FVC (post).
Sex FEV1/ FVC
(pre)
FEV1/ FVC
(post) P-value
Male 1.03 1.09
<0.001, HS Female 1.04 1.10
Increase 0.01 0.01
Table 15 shows an average improvement in PEF post bronchodilator age wise, showing an improvement of
47.93% among 5 years old and 21.43% among 12 years old children.
Table 16 showing an average improvement in FVC post bronchodilator age wise, showing an improvement of 27.61% among 9 years old and 16.87% among 10yr old children.
Table 10: Improvement distribution of FEV1.
Class interval Frequency %
0-10 2 2
10-20 25 25
20-30 50 50
30-40 22 22
40-50 1 1
Total 100 100
Table 17 showing an average improvement in FEV1/FVC
post bronchodilator age wise, showing an improvement 0.00
0.20 0.40 0.60 0.80 1.00 1.20 1.40 1.60
1 4 7 10 13 16 19 22 25 28 31 34 37 40 43 46 49 52 55 58 61 64 67 70 73 76 79 82 85 88 91 94 97
1
0
0
of 8.04% among 6 years old and 3.65% among 12 years old children. It is concluded that role of bronchodilator is significant in hyper reactive airway disease in children showing marked reversibility in lung functions, an early diagnosis and use of bronchodilator has a good outcome of the disease.
Table 11: Improvement distribution of PEF.
Class interval Frequency %
10-20 11 11
20-30 44 44
30-40 24 24
40-50 11 11
50-60 10 10
Total 100 100
Table 12: Improvement distribution of FVC.
Class interval Frequency %
0-10 3 3
10-20 36 36
20-30 57 57
30-40 4 4
Total 100 100
Table 13: Improvement distribution of FEV1/FVC.
Class interval Frequency %
0-4 36 36
4-8 34 34
8-12 25 25
12-16 5 5
Total 100 100
Table 14: Age wise average improvement in FEV1 post bronchodilator.
Age (years) Total cases
(100)
Avg improvement in FEV1 (%)
5 10 29.96
6 16 26.72
7 10 26.46
8 9 27.79
9 9 26.81
10 16 21.18
11 16 21.53
12 14 21.43
DISCUSSION
In the present study authors have selected diagnosed cases of HRAD fulfilling the mentioned criteria.
The standard reference values were taken from the article published. In the present study the baseline PFT showed below the normal values for their respective age and sex,
thesis study correlates with the study done by Srivastava A et al, and Budhiraja S et al.11,12
Table 15: Age wise average improvement in PEF post bronchodilator.
Age (years) Total cases
(100)
Avg improvement in PEF (%)
5 10 47.93
6 16 43.76
7 10 31.44
8 9 30.35
9 9 30.76
10 16 25.52
11 16 22.43
12 14 21.43
Table 16: Age wise average improvement in FVC post bronchodilator.
Age (years)
Total cases (100)
Avg improvement in FVC (%)
5 10 26.01
6 16 19.74
7 10 17.16
8 9 21.08
9 9 27.61
10 16 16.87
11 16 22.59
12 14 23.00
Table 17: Age wise average improvement in FEV1/FVC post-bronchodilator.
Age
(years) Total cases (100)
Avg improvement in FEV1/FVC (%)
5 10 7.33
6 16 8.04
7 10 7.95
8 9 6.45
9 9 6.10
10 16 5.05
11 16 4.04
12 14 3.65
Table 18: Normal values for age/mean height.
Age (years)
Mean height (cms)
FEV1 FVC PEF FEV1/
FVC
FEV1
In the present study the baseline FEV1 had a mean value
of 1.25 which improved to 1.545 post bronchodilator which is statistically highly significant with a p-value <0.001. This finding is in accordance with the study done by Shital S et al, and Bhattad et al, where children 6 years and above were taken into two groups, of which 76 were diagnosed as asthmatics, were taken as a study group and 80 healthy children as control group, they concluded that percent FEV1 values were decreased significantly in asthmatic children as compared to healthy children.13
In studies by Bacharier LB et al, and Paull K et al, in asthmatic children between 5-18 years of age found normal FEV1 values (many over 90 percent predicted) in
a majority of the children, but study by Strunk RC et al, had a study with objective of effect of mild to moderate childhood asthma on lung growth found that FEV1 was
lower for boys with asthma than for boys without asthma.14,15
In the present study the baseline mean FEV1 among boys
was 1.27 which improved to 1.56 and baseline mean value among girls was 1.22 which improved to 1.52 post bronchodilator showing males have larger FEV1
compared to girls, which was statistically significant with a p-value <0.012.
This finding is in accordance with David P. Johns in his text book of spirometry, the measurement and interpretation of ventilatory function in clinical practice.16
In the present study FEV1 showed an improvement of
20-30% post bronchodilator among 50% of the children.
This finding is in accordance with the study done by Shital S et al, and Bhattad et al, where children 6 years and above were taken into two groups, of which 76 were diagnosed as asthmatics were taken as a study group and 80 healthy children as control group, they concluded that percent FEV1 values were decreased significantly in asthmatic children as compared to healthy children, their study showed significant improvement post bronchodilator.13
Bussamra MH et al, had a study in children and adolescents with asthma for evaluation of the magnitude of the bronchodilator response, their conclusion was in asthmatic children cut off values established for assessment of bronchodilator response agree with those in literature.17 There was good bronchodilator response in
asthmatics. In asthmatic children when compared with normal children, there was no significant difference in both study and control group in percent predicted values of FVC, but percent predicted values of FEV1 and
FEV1/FVC ratio in percent were decreased significantly in asthmatic children as compared with healthy children. And in asthmatic children good bronchodilator
reversibility was present as compared with normal children.17
It is also in accordance with a recent study done by Ghalibafsabbaghi B et al, who performed PFT using tidal breathing flow volume loop (TBFVL), rapid thoracic compression (RTC) and raised volume rapid thoracic compression (RVRTC) to document the bronchodilator response in 39 children (mean age 45.2 months) and showed that there was a significant improvement in FEV1, and PEF.18
In the present study FEV1 showed the maximum improvement among 5 years old children which was 29.96% and the least seen in 10 years old children which was 21.18%
PEF
In the present study the percent baseline PEF had a mean value of 2.39 which improved to 3.07 post bronchodilator. In the present study PEF showed an improvement of 20-30% post bronchodilator among 44% of the children. This finding is in accordance with study done by Beydon N et al, who have done a multicentric study including children from eight pediatric lung function testing centers in hospitals in five French cities.20 One of the centers (Physiology Department,
Robert Debré teaching hospital, Paris, France) coordinated the study, with the help of a local study coordinator in each of the other centers. White children, 90 to 130 cm in height, were recruited. They used Spiroteq apparatus (Dyn’R Ltd, Toulouse, France), in the study children were subjected to pre and post bronchodilator and concluded that there was an improvement of up to 52% in their Rintexp values post bronchodilator in comparison with their Rintexp values which was significant in all 91 children.
It is also in accordance with a recent study done by Ghalibafsabbaghi B et al, who performed PFT using tidal breathing flow volume loop (TBFVL), rapid thoracic compression (RTC) and raised volume rapid thoracic compression (RVRTC) to document the bronchodilator response in 39 children (mean age 45.2 months) and showed that there was a significant improvement in FEV1, and PEF.18,19
In the present study the baseline mean PEF among boys was 2.46 which improved to 3.14 and baseline mean value among girls was 2.30 which improved to 2.99 post bronchodilator showing males have better PEF compared to girls, which was statistically highly significant with a p- value <0.001
This finding is in accordance with study done by Beydon N et al, who have done a multicentric study including children from eight pediatric lung function testing centers in hospitals in five French cities.20 One of the centers
Hospital, Paris, France) coordinated the study, with the help of a local study coordinator in each of the other centers. White children, 90 to 130 cm in height, were recruited. They used Spiroteq apparatus in the study children pre and post bronchodilator and concluded that there was an improvement of 52% in their Rexp values post bronchodilator.In the present study PEF showed the maximum improvement among 5 years old children which was 47.93% and the least seen in 12 years old children which was 22.43%.
FVC
In the present study the baseline FVC had a mean value of 1.21 which improved to 1.47 post bronchodilator. With a p value <0.001.
In the present study the baseline mean FVC among boys was 1.24 which improved to 1.51 and baseline mean value among girls was 1.18 which improved to 1.41 post bronchodilator showing males have better FVC compared to girls, which was statistically highly significant with a p- value <0.001
In the present study FVC showed an improvement of 20-30% post bronchodilator among 57% of the children.
This finding is in accordance with the study done by Bhattad SS et al, where children 6 years and above were taken into two groups, of which 76 were diagnosed as asthmatics were taken as a study group and 80 healthy children as control group, they concluded that percent FEV1 values were decreased significantly in asthmatic
children as compared to healthy children, their study showed significant improvement post bronchodilator.13
Bussamra MH et al, had a study in children and adolescents with asthma for evaluation of the magnitude of the bronchodilator response, their conclusion was in asthmatic children cut off values established for assessment of bronchodilator response agree with those in literature.17 There was good bronchodilator response in
asthmatics. In asthmatic children when compared with normal children, there was no significant difference in both study and control group in percent predicted values of FVC, but percent predicted values of FEV1 and FEV1/FVC ratio in percent were decreased significantly in asthmatic children as compared with healthy children. And in asthmatic children good bronchodilator reversibility was present as compared with normal children.
In the present study FVC showed the maximum improvement among 9 years old children which was 27.61% and the least seen in 10years old children which was 16.87%. This finding is in accordance with David P. Johns in his text book of spirometry, the measurement and interpretation of ventilatory function in clinical practice.
FEV1/FVC
In the present study the baseline FEV1/FVC had a mean
value of 1.03 which improved to 1.09 post bronchodilator. With a p-value of <0.001.
In the present study the baseline mean FEV1/FVC among
boys was 1.03 which improved to 1.09 and baseline mean value among girls was 1.04 which improved to 1.10 post bronchodilator showing males have better FEV1/FVC
ratio compared to girls, which was statistically significant with a p-value <0.001.
This finding is in accordance with David P. Johns in his text books of spirometry, the measurement and interpretation of ventilatory function in clinical practice.
In the present study FEV1/FVC showed an improvement
of <4% post bronchodilator among 36% of the children.
This finding is in accordance with the study done by. Bhattad SS et al, where children 6 years and above were taken into two groups, of which 76 were diagnosed as asthmatics were taken as a study group and 80 healthy children as control group, they concluded that percent FEV1 values were decreased significantly in asthmatic
children as compared to healthy children, their study showed significant improvement post bronchodilator.13
Bussamra MH et al, had a study in children and adolescents with asthma for evaluation of the magnitude of the bronchodilator response, their conclusion was in asthmatic children cut off values established for assessment of bronchodilator response agree with those in literature.17 There was good bronchodilator response in
asthmatics. In asthmatic children when compared with normal children, there was no significant difference in both study and control group in percent predicted values of FVC, but percent predicted values of FEV1 and FEV1/FVC ratio in percent were decreased significantly in asthmatic children as compared with healthy children. And in asthmatic children good bronchodilator reversibility was present as compared with normal children. In the present study FEV1/FVC showed the maximum improvement among 6 years old children which was 8.04% and the least seen in 12 years old children which was 3.65%.
CONCLUSION
Funding: No funding sources Conflict of interest: None declared
Ethical approval: The study was approved by the Institutional Ethics Committee
REFERENCES
1. National Asthma Education and Prevention Program: Expert panel report III: Guidelines for the diagnosis and management of asthma. Bethesda, MD: national heart lung and blood Institute. 2007. (NIH publication no.08-4051). Available at: www.nhlbi.nih.gov/guidelines/asthma/asthgdln.htm. 2. Kleigman RM, Jenson HB, Behrman RE, Stanton BF, eds. Regulation of respiration In: Nelson textbook of Pediatrics. 18th ed. India: Elsevier.
2007;(2):1728-1730.
3. Pal GK, Pal P. Pulmonary function tests. In: Textbook of practical physiology, 1st ed. Chennai:
Orient Longman Ltd.; 2001:178-190.
4. Hughes JMB, Pride NB. Lung function tests. Principles and clinical applications. In: Pride NB, Texts of forced expiration and inspiration, 1st ed.
W.B. Saunders Publishers; 1999:23-25.
5. Al-Dawood K. Peak expiratory flow rate in Saudi school boys at Al-Khobar City, Saudi Arabia. Saudi Med J. 2000;21(6):561-4.
6. Swaminathan S, Venkatesan P, Mukunthan R. Peack expiratory flow rate in South Indian Children. Indian Pediatr. 1993;30(2):207-11.
7. Ganong WF. Regulation of respiration: In: Review of medical physiology. 22nd ed. India, Mc Graw
Hill: Company; 2005:671-680.
8. Seaton A, Seaton D, Leiteh GA. Epidemiology and respiratory diseases, In: Crofon and Douglas respiratory diseases, 4th ed. UK: Blackwell Science Oxford; 1989:90.
9. Guyton Ac, Hau JE. Pulmonary ventilation. In: Textbook of medical physiology, 11th Ed. India: W.B. Saunders Company; 2006:471-482.
10. Gardner RM. Standardization of spirometry: 1987 update. Official statement of the American thoracic Society. Am Rev Respir Dis. 1987;136:1285-98.
11. Srivastava A, Kapoor RK, Misra PK, Srivastava KL, Thakur S, Shukla N. Pulmonary function tests in normal Indian children and changes in respiratory disorders. Indian Pediatr. 1995;32(6):629-34. 12. Budhiraja S, Singh D, Pooni PA, Dhooria GS.
Pulmonary functions in normal school children in the age group of 6-15 years in north India. Iranian J Pediat. 2010;20(1):82.
13. Bhattad SS, Asudani B, Dandge VP. Comparison of pulmonary function tests in asthmatic and normal children. Int J Recent Trends Sci Technol. 2013;5(3):170-3.
14. Bacharier LB, Strunk RC, Mauger D, White D, Lemanske Jr RF, Sorkness CA. Classifying asthma severity in children: mismatch between symptoms, medication use, and lung function. Am J Resp Critic Care Med. 2004;170(4):426-32.
15. Paull K, Covar R, Jain N, Gelfand EW, Spahn JD. Do NHLBI lung function criteria apply to children? A cross‐sectional evaluation of childhood asthma at National Jewish Medical and Research Center, 1999–2002. Pediatr Pulmonol. 2005;39(4):311-7. 16. David P. Johns PhD, Rob Pierce MD, Predicted
normal values. In: Guide to spirometry 2nd ed. Australia. McGraw-Hill; 2008:4-10.
17. Bussamra MH, Cukier A, Stelmach R, Rodrigues JC. Evaluation of the magnitude of the bronchodilator response in children and adolescents with asthma. Chest. 2005;127(2):530-5.
18. Ghalibafsabbaghi B, Raj D, Lodha R, Kabra SK. Assessment of bronchodilator response in preschool children by pulmonary function tests. Indian Pediatr. 2013;50(10):957-60.
19. Beydon N, Pin I, Matran R, Chaussain M, Boulé M, Alain B, et al. Pulmonary function tests in preschool children with asthma. Am J Resp Critic Care Med. 2003;168(6):640-4.