Original Research Article
Nutritional status and its influencing factors among adolescents in rural
field practice area of a medical college in Karnataka, India
Anantha Narayana Gowda B. L.
1*, Yamuna B. N.
2INTRODUCTION
Adolescence is a stage of human development encompassing the transition from childhood to adulthood. The term adolescence is derived from the Latin word “adolescere” meaning “to grow up”, the World Health Organization (WHO) defines adolescents as individuals aged 10-19 years.1 Adolescence is often divided into early (10-13 years), middle (14-16 years) and late (17-19 years) adolescence.2 There are around 1.2 billion adolescents worldwide, comprising 20% of the global
population and 350 million adolescents comprising about 22% of the population in countries of the South-East Asia Region (SEAR).3
According to 2011 census of India, 20.9% of total population is adolescents, and in Karnataka 18.9% of total population is adolescents.4 This represents a huge opportunity that can transform the social and economic fortunes of a country. The large and increasing relative share and absolute numbers of adolescent and youth population in India make it necessary that the nation ensures they become a vibrant, constructive force that can 1Department ofPediatrics, Sri Siddhartha Medical College, Tumkur, Karnataka, India
2Clinical Care Coordinator, Child Health, National Health Mission, Bengaluru, Karnataka, India
Received: 01 January 2018
Accepted: 30 January 2018
*Correspondence:
Dr. Anantha Narayana Gowda B. L., E-mail: drananth8023ngowda@gmail.com
Copyright: © the author(s), publisher and licensee Medip Academy. This is an open-access article distributed under the terms of the Creative Commons Attribution Non-Commercial License, which permits unrestricted non-commercial use, distribution, and reproduction in any medium, provided the original work is properly cited.
ABSTRACT
Background: Good nutrition and dietary behavior are important during adolescence to achieve full growth potential and appropriate body composition and to promote health and well-being. Thus, the present study was conducted in order to assess the nutritional status and its influencing factors among the school going adolescents.
Methods: A cross sectional study was conducted among the school going adolescents (Class V to Class X) in the rural field practice area of Sri Siddhartha Medical College, Tumkur from June 2015 to May 2016. Representative sample was drawn proportionately from each of the strata (school, class and gender). Anthropometric measurements, dietary assessment and clinical examination of study participants were made, and other information was collected using semi structured questionnaire. BMI-for-age and height-for-age were considered as the indicators and WHO Anthroplus software was used to calculate and assess the nutritional status. Statistical analysis was performed using SPSS version 16.
Results: The prevalence of thinness and stunting were 32.3% and 25.8% respectively. The prevalence of overweight was 4.8%. The risk of malnutrition was significantly high among adolescents from BPL families, larger family size and the birth order of three and more (p <0.05).
Conclusions: There is an immediate need to address the high burden of under-nutrition in adolescents of both sexes in schools by routine annual monitoring of nutritional status, appropriate management of affected child, providing nutritional counselling for underweight adolescents.
Keywords: Adolescents, BMI for age, Nutritional status, Rural, Thinness
contribute to sustainable and inclusive growth. The skills, knowledge, attitudes and behaviour of today’s young people are essential to the country’s development.5
Adolescence, a period of transition between childhood and adulthood is a significant period of human growth and maturation. The health of adolescents attracted the global attention in the past two decades.6 Adolescents are the future generation of any country. Their nutritional needs are critical for the wellbeing of a society but for many years, their health has been neglected because they are considered to be less vulnerable to diseases compared to relatively young children or the old people.5,7 So far, most of the interventions have either focused on children aged 0-5 years or on pregnant women, and, to some extent on lactating women.7
In South East Asian region, a large number of adolescents suffer from chronic malnutrition and anaemia, which adversely impacts their health and development. Addressing the nutritional needs of adolescents could be an important step towards breaking the vicious cycle of intergenerational malnutrition, chronic diseases and poverty.5 Very few studies are available on the nutritional status and various factors having an effect on nutritional status of adolescents in rural areas of India.8 Hence there is a scope to explore this area further. The present study was carried out to in the rural field practice area of Sri Siddhartha Medical College, Tumkur with the objectives of assessing the nutritional status of adolescents and also the factors influencing the nutritional status of the study population.
METHODS
The present cross-sectional study was conducted with the objective of assessing the nutritional status and to determine the factors influencing the nutritional status of adolescents of rural field practice area of Sri Siddhartha Medical College, Tumkur. The study period was from June 2015 to May 2016.
Based on the review of literature the prevalence of malnutrition in various parts of India was found to be in the range of 40% to 53.7%.9-11 Hence, taking the lowest prevalence,
Sample size is calculated using formula, n = Z2p(1-p)/d2. A total of 400 students from class V to class X comprise the study population. A total of 252 students were from four government schools and 148 students were from four private schools of rural field practice area were included in the study. Students absent on the day of examination and those who are not willing to participate were excluded from the study. Representative sample was drawn proportionately from each of the strata (school, class and gender).
Ethical committee clearance was obtained from the institution ethics and review board (IERB) before starting
the study. Permission for conducting the study was obtained from the block education officer (BEO) of Tumkur and also from the school principals of the schools after explaining the purpose of the study. Written informed consent from the teachers of the respective class and assent from children to participate in the study was taken. A pre-tested semi-structured questionnaire was used to collect information from the students by interview technique. Information regarding student’s socio demographic profile was obtained from the school admission records.
According to WHO, the indicators of nutritional status for adolescents are height for age, BMI for age and clinical signs.12
Measurement of weight
A bathroom weighing scale was used. It was calibrated against known weights regularly. The zero error was checked for and removed if present, every day. With the help of trained investigators weight of all the students was taken without foot-ware and heavy clothing with the subject standing motionless on the weighing machine with feet 15 cm apart with weight equally distributed on each leg and was measured to the nearest 100 g. The same machine was used throughout the study and was calibrated every day before using it.
Measurement of height
Height in centimetres was marked on a wall with the help of measuring tape and height was measured against wall. The students were asked to remove footwear and with heels together and head positioned so that the line of vision was perpendicular to the body, shoulders straight and touching the wall. A scale was brought down to the topmost point on the head. Height was recorded to the nearest 1 cm.
General physical examination
General clinical examination of all the students was carried out in natural light. Head to toe examination was done for clinical signs of malnutrition. The clinical signs looked for in this age-group were: visible signs of wasting, pedal edema, Bitot's spots, conjunctival xerosis, pale conjunctiva, parotid enlargement, thyroid enlargement, angular cheilosis, fluorosis, caries, koilonychia etc.13 All those children who were found to be under nourished were assessed for the reason for under nutrition and appropriately managed and counselling was given.
Statistical analysis
square test was used to know the association between different variables and malnutrition. P value <0.05 was considered statistically significant.
RESULTS
Out of 400 study participants, 206 (51.5%) were in the age group of 14-16 years (middle adolescence) and 194 (48.5%) were in the age group of 10-13 years (early adolescence). In case of gender distribution, the males were relatively high in number when compared to females, 208 (52%) were males and 102 (48%) were females.
Table 1: Socio-demographic characteristics of school children.
Variables
No. of students (n=400)
(%)
Age
10-13 years
(early adolescence) 194 48.5 14-16 years
(middle adolescence) 206 51.5
Gender Female 192 48.0
Male 208 52.0
Class Class V to class VII 170 42.5 Class VII to class X 230 57.5
School Government 252 63.0
Private 148 37.0
Religion Hindu 355 88.8
Muslim 45 11.3
Type of family
Nuclear 252 63.0
Joint 38 9.5
3 generation 110 27.5
Family size 3- 5 members 237 59.3 ≥ 6 members 163 40.8
Birth order
1 148 37.0
2 152 38.0
≥ 3 100 25.0
Poverty line
BPL 282 70.5
APL 118 29.5
Most of the study participants, 252 (63.0%) were from nuclear family, 110 (27.5%) were from three generation family and only 38 (9.5%) were from joint family.
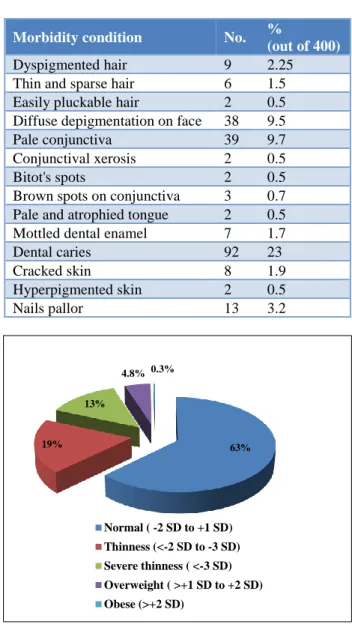
A total of 237 (59.3%) were from the families with the family size being 3 to 5 members, whereas 163 (40.2%) were from the larger family size (more than or equal to 6 members in the family). Among the study participants 148 (37.0%) were of first birth order, 152 (38.0%) were of second birth order and 100 (25.0%) were of birth order three and above three. Around 70.5% of the study participants were from BPL families. Table 1 gives the information regarding socio demographic details of study participants. Figure 1 depicts that prevalence of moderate
thinness was 18.8%, severe thinness was 13.5%. About 4.8% were overweight and only 0.3% were obese.
Table 2: Signs of malnutrition among the school children.
Morbidity condition No. %
(out of 400)
Dyspigmented hair 9 2.25
Thin and sparse hair 6 1.5 Easily pluckable hair 2 0.5 Diffuse depigmentation on face 38 9.5
Pale conjunctiva 39 9.7
Conjunctival xerosis 2 0.5
Bitot's spots 2 0.5
Brown spots on conjunctiva 3 0.7 Pale and atrophied tongue 2 0.5 Mottled dental enamel 7 1.7
Dental caries 92 23
Cracked skin 8 1.9
Hyperpigmented skin 2 0.5
Nails pallor 13 3.2
Figure 1: Distribution of BMI for age among school children.
Figure 2: Prevalence of stunting among school children.
63% 19%
13%
4.8% 0.3%
Normal ( -2 SD to +1 SD) Thinness (<-2 SD to -3 SD) Severe thinness ( <-3 SD) Overweight ( >+1 SD to +2 SD) Obese (>+2 SD)
297 (74.3%) 103
(25.8%)
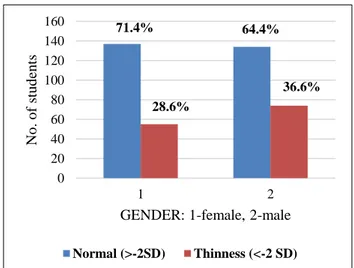
Figure 2 depicts that prevalence of stunting among the school children was 25.8% Prevalence of under nutrition was relatively high among boys 35.6%, when compared to the female counterparts, where in the prevalence was found to be 28.6%. About 28.4% of boys were stunted as compared to girls where in prevalence of stunting was found to be 22.9% as shown in Figure 3.
Clinical signs of malnutrition are represented in Table 2.
Table 3 shows that Under nutrition is significantly high among adolescents from BPL families, adolescent of birth order three and above, and from the families with family size of more than 5 (p<0.05).
Table 3: Association of malnutrition with the factors.
Variables
Bmi for age
Total n=400
Chi square value
Df P value
Normal (≥2 SD) (n = 271)
Thinness (≤2 SD) (n = 129)
Age 10-13 years 130 (67%) 64 (33%) 194 0.094 1 0.759
14-16 years 141 (68.4%) 65 (31.6%) 206
Gender Male 136 (64.2%) 74 (35.2%) 210 1.807 1 0.179
Female 135 (71.1%) 55 (28.9%) 190
Class Class v- class vii 117 (68.8%) 53 (31.2%) 170 0.156 1 0.693 Class vii- class x 154 (67%) 76 (33%) 230
Poverty line BPL 181 (64.2%) 101 (35.8%) 282 5.562 1 0.018*
APL 90 (76.3%) 28 (23.7%) 118
Family size
≥6 members 101 (61.6%) 63 (38.4%) 164
4.835 1
0.028*
3-5 members 170 (72%) 66 (28%) 236
Birth order
≥3 64 (57.1%) 48 (42.9%) 112
8.492 2 0.014*
2 112 (73.7%) 40 (26.3%) 152
1 95 (69.9%) 41 (30.1%) 136
*Significant at 5% level of significance.
Figure 3: Comparison of nutritional status between girls and boys.
DISCUSSION
The study population was 400 school going adolescents, this is similar to the studiesconducted among rural school going adolescents.10,11 The proportion of boys (52%) were greater than girls (48%), this is similar to the studies whereas in some other studies proportion girls were more
than boys. 9,10,14-17The adolescents in the age group 14-16 years, middle adolescents (51.5%) were more and majority of them, 88.8% belongs to Hindu religion and most of them (63%) were from nuclear families this is similar to the studiesdone among rural adolescents in India.11,16
In the present study, the prevalence of under nutrition among rural school going adolescent was 32.3%, this is similar to the study done by Banerjee S et al.14 In the five rural schools of Goa where in the prevalence was 32.6%. In a study done by Dey I et al, among school going adolescents of Naxalbari block of Darjeeling district, the prevalence of under nutrition was found to be 40% and also in a study done by Bhattachaarya A et al among the school going adolescents in Burdwan district of West Bengal, prevalence of under nutrition was 47.41% which is high when compared to the present study finding.10,11
In the above mentioned three studies, they have assessed the nutritional status of school children by using BMI-for-age and referred 2007 WHO growth reference for children 5-19 years, which is similar to the assessment technique in the present study.
In another study done by Yerpude N et al in Guntur district of Andhra Pradesh, they have assessed the under
71.4% 64.4%
28.6%
36.6%
0 20 40 60 80 100 120 140 160
1 2
No
.
o
f
stu
d
en
ts
GENDER: 1-female, 2-male
nutrition following weight for age criteria and the prevalence of under nutrition was found to be 53.3% which is relatively high compared to the present study finding.16
The prevalence of under nutrition ranges from 32.6% to 53.3%. This difference in the prevalence could be attributed to differences in the assessment criteria as well as different cultural practices, level of socio-economic development, prevailing dietary practices in different settings.16
In the present study, prevalence of under nutrition is relatively high among boys (36.6%) when compared to girls (28.6%) and high among early adolescents. This is similar to other studies done among rural school going adolescents in India.8,10,14,16
In the present study, prevalence of severe thinness was 13.5% which is similar to the study done by Banerjee S et al but in a study done by Dey I et al, prevalence of severe thinness (23%) is higher as compared to the present study finding.10,14
In present study, prevalence of overweight and obesity is 4.8% and 0.3% respectively, but the prevalence of overweight and obesity is relatively less, 3.6% in the study done by Banerjee S et al.14 The prevalence of stunting in present study was 25.8% which is relatively less in contrast to the studies where in the prevalence of stunting reported was high. Dey I et al reported the prevalence of stunting as 44% and in the study done by Bhattachharya A et al the prevalence of stunting was 47.1%.10,14 The prevalence of stunting is high among boys (28.4%) when compared to their female counter parts (22.9%), this is similar to the other studies done among rural school going adolescents.10,11,14,16
In the present study, the risk of under nutrition was significantly high among the children of birth order three and more when compared with counter parts with the birth order one and two. This is similar to the study conducted by Srivastva et al this could be attributed to the factors such as improper spacing many pregnancies within short span of time will result in IUGR, which will lead to low birth weight and infections and this will be carried till adolescence.18
Also, more number of children leads to the division food and care among them and could lead to under nutrition. The risk of malnutrition was more among the children from the joint and three generation family, this is similar to the studies.11,18
In the present study, the risk of malnutrition was significantly high among adolescents from below poverty line families when compared to their counterparts from above poverty line family which is similar to other studies.8,9,11,14,16,18
CONCLUSION
In the present study prevalence of thinness, stunting and overweight was 32.3%, 25.8% and 4.8% respectively. The prevalence of obesity was 0.3%. The risk of under nutrition was high among adolescents from BPL families, larger family size and the birth order of three and more and was statistically significant (p <0.05).
ACKNOWLEDGEMENTS
Authors sincerely thank all the staff and head of the department for their constant support and guidance for this study. Authors thank all the interns who helped in the data collection under the guidance of the principal investigator.
Funding: No funding sources Conflict of interest: None declared
Ethical approval: The study was approved by the Institutional Ethics Committee
REFERENCES
1. WHO. Maternal, newborn, child and adolescent health. Programmes and projects WHO Regional office for South East Asian. Available at http://apps.searo.who.int/PDS_DOCS/B4771.pdf/ Accessed 9 April 2016.
2. Sawyer SM, Afifi RA, Bearinger LH, Blakemore SJ, Dick B, Ezeh AC. Adolescence: a foundation for future health. The Lancet. 2012;379:1630-40. 3. Registrar General and Census Commissioner, India.
Release of social and cultural tables - age data highlights. Ministry of Home Affairs. Available at http://www.censusindia.gov.in/2011.../Census_2011 _Age_data-final-12-09-2013 Accessed 3 September 2014.
4. RKSK Operational framework. Rashtriya Kishor Swasthya Karyakram. Adolescent health division Ministry of Health and Family Welfare Government of India. 2014. Available at http://nrhm.gov.in/images/pdf/programmes/RKSK/ RKSK_Operational_Framework.pdf Accessed 6 February 2016
5. WHO. Adolescent nutrition. A review of the situation in selected south-east Asian Countries.
2006. Available at
URL:http://www.searo.who.int/LinkFiles/Nutrition_ for_Health_and_Development_Executive_Summary .pdf Accessed 3 September 2014.
6. Rao G, Aggarwal MC, Yadav R, Das SK, Sahare LK, Bondley LK, et al. Intestinal parasitic infections- anemia and under-nutrition among tribal adolescents of Madhya Pradesh. Indian J Community Med. 2003;28(1):26-9.
7. ACC/SCN. Fourth report on the world nutrition situation: nutrition throughout the life cycle, Geneva: ACC/SCN in collaboration with IFPRI.
http://www.unsystem.org/scn/Publications/4RWNS/ 4rwns.pdf Accessed 28 March 2016.
8. Venkaiah K, Damayanti K, Nayak MU, Vijayaraghavan K. Diet and nutritional status of rural adolescents in India. Eur J Clin Nutr. 2002;56(11):1119-25.
9. Deshmukh PS, Gupta SS, Bharambe MS, Dongre AR, Kaur S, Garg BS, et al. Nutritional status among rural adolescents in rural Wardha. Indian J Pediatr. 2006;76:139-41.
10. Dey I, Biswas R, Ray K, Chakraborthy M, Pal P. Nutritional status of school going adolescents in a rural block of Darjeeling, West Bengal, India. The Health. 2011;2(3):75-7.
11. Bhattacharya A, Basu M, Chatterjee S, Misra RN, Chowdhury G. Nutritional status and morbidity profile of school-going adolescents in a district of West Bengal. Muller J Med Sci Res. 2015;6:10-5. 12. de Onis M, Habicht JP. Anthropometric reference
data for international use: recommendations from a World Health Organization Expert Committee. Am J Clin Nutr. 1996;64:650-8.
13. Expert committe on medical assessment of nutritional status. Technical report series. Geneva; World Health Organization; 1963:258.
14. Banerjee S, Dias A, Shinkre R, Patel V. Under-nutrition among adolescents: a survey in five secondary schools in rural Goa. Natl Med J India. 2011;24:8-11.
15. Vaishnav J, Vaishnav G, Verma M. Socio demographic study among school going adolescents. J Clin Exp Res. 2013;1(2):31-8.
16. Yerpude PN, Jogand KS, Jogand M. A study of health status among school going adolescents in south India. Int J Health Sci Res. 2013;3(11):8-12. 17. Joshi SM, Likhar S, Agarwal SS, Mishra MK,
Shukla U. A study of nutritional status of adolescent girls in rural area of Bhopal District. Nat J Community Med. 2014;5(2):191-4.
18. Srivastava A, Mahmood SE, Srivastava PM, Shrotriya VP, Kumar B. Nutritional status of school-age children: a scenario of urban slums in India. Arch Pub Health. 2012;70:1-8.